
記住我


Amyotrophic lateral sclerosis (ALS) is a devastating neurodegenerative disease associated with both upper and lower motor neuron dysfunction leading to progressive muscle weakness and bulbar dysfunction.1 It is increasingly recognised that ALS also affects energy metabolism,2 eating behaviour,3 sleep4 and autonomic function.5 Patients with ALS have marked weight loss and low body mass index (BMI) that correlate with poor survival.6 Traditionally ALS has been regarded as a disease associated with malnutrition, with suggestions that nutritional intake decreases as the disease progresses.7 However, eating behaviour in ALS is more complex with pre-symptomatic patients8 and patients developing cognitive and behavioural changes3 that increase their caloric intake.
ALS shares strong genetic and pathological overlap with frontotemporal dementia,9 a syndrome in which the hypothalamus has been identified to be affected very early in the disease in association with abnormal eating behaviours.10, 11 Hypothalamic atrophy is observed in ALS using volumetric MRI and is associated with lower BMI.12 The hypothalamus is central to the control of eating behaviour, with an appetite stimulating pathway targeting neurons of the arcuate nucleus, and an appetite suppressing pathway acting on neurons producing both pro-opiomelanocortin and cocaine- and amphetamine-related transcript (CART).13 Oxytocin, vasopressin and orexin neuropeptides produced in the hypothalamus also play an extensive role in the regulation of eating and other behaviours.14-16
As Tar DNA-binding protein 43 (TDP-43) pathology is found in most ALS cases (and in the hypothalamus in one third of patients17), and in patients with frontotemporal dementia those with TDP-43 pathology have the greatest hypothalamus pathology,10 degeneration of hypothalamic neurons may also occur early in ALS and impact abnormal eating behaviours and metabolic function, that can then potentially affect disease progression.18 Using serial section microscopy, the current study aimed to assess the degree of hypothalamic pathology (presence of TDP-43 inclusions, degree of atrophy and peptidergic neuronal loss) in ALS compared to healthy controls, and correlate these pathologies to changes in eating behaviour, sleep, cognition, behaviour and disease progression.
MATERIALS AND METHODS ParticipantsNine patients with ALS were recruited for longitudinal assessments and brain donation from the Forefront ALS clinic based at the Brain and Mind Centre, University of Sydney, Australia. All patients underwent neurological review, cognitive assessment and met current clinical diagnostic criteria for ALS.19 Patients were classified as having either limb or bulbar weakness as their first symptom. All patients were negative for the C9orf72 mutation. Cognitive and behavioural testing was conducted by trained neurologists or neuropsychologists, and physical limitations were taken into account. Data from the initial assessment were used for correlations (see below). Disease duration was calculated from the date of onset until the date of death. The brain donor study protocols were approved by the South Eastern Sydney Local Health District and the University of Sydney human ethics committees.
Brain retrieval at death and pathological characterisation was performed by the Sydney Brain Bank at Neuroscience Research Australia with approval by the South Eastern Sydney Local Health District and the University of New South Wales human ethics committees. The post-mortem brain tissue was released for this study following approval of the project by their Scientific Review Committee (PID500). Tissue from control cases (N = 8) from our previously published study using the same techniques20 was included for comparison. These control cases had no clinical evidence of neurologic disease and were obtained previously from the Sydney Brain Bank at Neuroscience Research Australia following approval by their Scientific Committee (PID073).
Clinical assessment at initial presentationAll clinical assessments were conducted at initial presentation.
General screeningGlobal cognitive functioning was determined using the revised Addenbrooke's Cognitive Examination (ACE-R),21 a validated screening measure of cognitive function covering attention, memory, verbal fluency, language and visuospatial abilities.
Functional assessmentFunctional assessment at initial presentation was measured using the ALS functional rating scale.22, 23
Behavioural assessmentCarers rated the extent of behavioural changes in the patients via the Cambridge Behavioural Inventory (CBI),24 a validated measure of behavioural changes in ALS.
Body mass index (BMI)Height and weight were measured barefoot and BMI calculated (weight in kilograms/height in metres squared).
Post-mortem tissue processingThe entire unilateral hypothalamus from the ALS cases (N = 9) were excised from formalin-fixed coronal slices and processed for immunohistochemistry. The ALS cases were compared to control cases (N = 8) prepared in the same way, as published previously.20 Briefly, hypothalamic tissue blocks spanning the entire hypothalamic region were first cryoprotected in 30% sucrose in 0.1 M tris buffer (pH 7.4). The blocks were then cut serially in the coronal plane using a semi-freezing microtome at a thickness of 50 μm and collected in 15 equally spaced series throughout the entire anteroposterior extent of the hypothalamus. One series was mounted on glass slides and processed for Nissl (0.5% cresyl violet or CV, ICN Biomedicals Inc, stabilised with 10% acetic acid) and myelin (0.1% luxol fast blue or LFB, Solvent Blue 38, Sigma, stabilised with lithium carbonate) staining. Free-floating sections were processed immunohistochemically using a primary antibody against oxytocin (1:10,000, made in rabbit, Phoenix Pharmaceuticals), vasopressin (1:30,000, made in rabbit, Millipore), orexin (1:30,000, made in rabbit, Phoenix Pharmaceuticals), CART (1:10,000, made in rabbit, rabbit, Phoenix Pharmaceuticals) and for Tar DNA Binding Protein 43 phosho Ser409/410 (TDP-43; antibody made in rabbit, 1:2000 Cosmo bio).
The brain sections were first rinsed three times with 50% ethanol solution for 15 mins, any nonspecific peroxidase quenched in 3% H2O2 and 50% ethanol for 20 mins, incubated in potassium phosphate-buffered saline (KPBS) containing 5% serum (from the same species as the corresponding secondary antibody was raised in) for 20 mins to eliminate any non-specific antibody binding, incubated overnight at room temperature in primary antibody solution containing 5% serum in KPBS, incubated with biotinylated secondary antibody for 1 h at room temperature in 1:200 dilution, and then incubated with avidin-biotin-peroxidase complex (ABC elite kit, Vector Laboratories) prepared in KPBS for 1 h at room temperature, all with washing steps in between. Following these incubations, the peroxidase reaction was developed by incubation in 25 mg/ml 3,30-diaminobenzidine for 10 mins and 0.003% H2O2 for 5 mins. The sections were then mounted onto chromalum gelatinised slides, passed through a series of alcohol and xylene baths for delipidation and cover-slipped with DPX mounting media (Sigma). For immunofluorescence, a primary antibody against rabbit primary antibody oxytocin (1:1000, made in rabbit, Phoenix Pharmaceuticals) and orexin (1:1000, made in rabbit, Phoenix Pharmaceuticals) were used together with TDP-43 antibody (made in rabbit, 1:1000 Cosmo bio). Two secondary antibodies were used: biotinylated horse anti-mouse IgG (1:200; Vector Laboratories) and Alexa 488-conjugated affinity pure donkey anti-rabbit (1: 200; Invitrogen). Streptavidin, a biotin-binding protein, conjugated with a fluorescent dye (Alexa Fluor 647; Invitrogen) was used (1:200) against the biotinylated secondary antibody.
Tissue evaluationThe presence of pathological inclusions was evaluated in 2–3 hypothalamic tissue sections/case immunoprocessed for TDP-43 and counterstained with CV. Two investigators (ÅP, SG) assessed TDP-43 immunopositive staining in the lateral hypothalamic area, paraventricular nucleus (PVN) and the fornix. For confocal analyses of co-localisation of TDP-43 inclusions and orexin or oxytocin immunofluorescence, confocal images were acquired using a Nikon Eclipse 90i microscope (Nikon, Instruments Inc., Europe B.V.) coupled to a Nikon D-Eclipse C1 laser scanning confocal unit equipped with a 488-nm sapphire diode laser, a 543-nm argon-ion laser (CVI Melles Griot, Albuquerque, NM, USA) and 639-nm cube diode laser (Coherent Inc.). Confocal Z-stacks were obtained with a 60×Apochromat oil-immersion objective with laser excitation in sequential mode using nis-element ar software version 4.0. Confocal images with orthogonal projections were then generated using the nis-element analysis software version 4.5. Estimation of the number of cells with TDP-43 inclusions and oxytocin or orexin immunofluorescence was made on 20 randomly selected confocal Z-stack images using a 60x Plan-Apo oil objective (numerical aperture = 1.4) in each of the PVN and LHA in 4 ALS cases. For each image, first the number of oxytocin or orexin immunopositive cells was determined and then the number of cells which showed overlap with TDP-43 was determined. Between 97–135 cells were evaluated for each case.
Due to limitations of the tissue, detailed quantification using stereological analyses of the number of neuropeptide-expressing cells was performed on seven to eight cases with ALS and compared with four control cases. In these cases, the volumes of the entire hypothalamus, the fornix within the hypothalamic region, and the PVN were determined on sections stained for CV/LFB using the CAST module in the VIS software (Visiopharm) and applying the optical fractionator using the Cavalieri method.25 As previously described,20 the border of the hypothalamus was outlined in each section between bregma −1.3 to 12 mm and the PVN between bregma 00 and 6.7 mm (based on the Atlas of the Human Brain).26 The cross-sectional areas of the hypothalamus, the fornix and the PVN were then computed, and the volumes were determined by multiplying the cross-sectional areas by the distance between sections (750 μm). The average number of slides assessed per ALS case was 12 ± 2 (mean ± SD), and 12 ± 2 per control case for hypothalamic volume estimations. The average number of slides assessed for the PVN volume estimations per ALS case was 7 ± 1 and 6 ± 1 per control case, and for the fornix 9 ± 1 per ALS case and 8 ± 2 per control case.
Estimates of the total number of immunopositive cells were obtained with an unbiased stereological quantification method by employing the optical fractionator principle25 on blind-coded slides. Neuropeptide-containing neurons were quantified with the Computer Assisted Toolbox Software (CAST) module in VIS software (Visiopharm, Horsholm, Denmark), or post-processed in Metafer software package (Althaussen, Germany) and transferred to the CAST module in the VIS software (Visiopharm, Horsholm, Denmark), using a 60x Plan-Apo oil objective (numerical aperture=1.4) on a Nikon 80i or Zeiss microscope equipped with an x-y axis motorised stage and a high precision linear encoder on the z-axis motor (Heindenhain, Traunreut, Germany). Sampling for the quantitation was initiated with a random position placement of the counting frame, which then moved systematically throughout all the sampling positions with a specifically chosen x-y step length until the entire region of interest was sampled. The x-y step length was adjusted accordingly to achieve maximal sampling and to minimise the coefficient of error, which would usually yield roughly between 150 and 400 neurons per brain for the different neuropeptide staining. The total cell numbers in each case were estimated using the following formula based on the optical fractionator principle: N = ΣQ × (x-y step length/ counting frame area) × number of series. Where N is equal to the total number of neurons, ΣQ is the number of neurons counted per brain. For any of the stains assessed, there was no significant difference in the average number of slides per case.
Statistical analysesAnalyses were conducted using IBM SPSS statistics (version 24.0) and p < 0.05 regarded as significant. Kolmogorov-Smirnov tests were run to determine suitability of variables for parametric analyses. Mann-Whitney U tests and Fisher exact tests were used to evaluate group differences in demographic and clinical variables, and hypothalamic volumes and pathologies. A principal component factor analysis was performed to determine relationships between continuous clinical and pathological variables. The number of factors in the covariance/correlation matrix was selected by the criterion of an eigenvalue >1, and variables were considered relevant if they had factor loadings stronger than ±0.65.27
Data sharing statementThe authors are happy to make all data and statistical plans available upon reasonable request until 2025.
RESULTS Demographic dataSamples from nine ALS patients were examined and compared to eight control subjects (demographics in Table 1). There was no significant difference in gender (p = 0.201) or age (p = 0.089) between these groups. Cognitive and behavioural results for the ALS group are presented in Table 1 and are representative of changes noted in ALS.3 The average post-mortem time was 23 ± 18 h (mean ± SD) for the ALS cases compared to 16 ± 11 h for control cases (Table S1).
TABLE 1. Clinical and demographic variables (average±standard deviation) Variable ALS Control Group comparison Male: Female 4:5 6:2 Fisher exact test = 1.2, p = 0.861 Age at death (y)a 71 ± 9 61 ± 14 U = 18, p = 0.108 Disease duration at death (y)a 3.0 ± 2.1 NA NA Time from testing to death (y) 1.8 ± 1.1 NA NA Limb:Bulbar 7:3 NA NA BMI (m2)a 25 ± 2.5 NA NA ALSFRS (/40)a 31 ± 12 NA NA ACE-R (/100)a 92 ± 10 NA NA CBI totala 32 ± 23 NA NA CBI eatinga 2.0 ± 1.4 NA NA CBI stereotypical behaviour 2.2 ± 2.3 NA NA CBI sleepa 3.3 ± 2.0 NA NA CBI motivation 3.7 ± 2.0 NA NA CBI abnormal behaviour 1.3 ± 1.9 NA NA Abbreviations: ACE-R, revised Addenbrooke's cognitive examination; ALS, amyotrophic lateral sclerosis; ALSFRS, ALS functional rating scale; BMI, body mass index; CBI, Cambridge behavioural inventory. Confirming hypothalamic atrophy in ALSHypothalamic atrophy (at onset and even pre-symptomatically) has been reported in ALS using volumetric analyses of MR images and correlates with BMI.12 We confirmed a reduction in hypothalamic volume in ALS (average 21% atrophy compared to controls) using stereological analyses of post-mortem brain tissue (Figure 1A-C, Table 2). The PVN is one area within the hypothalamus that regulates metabolism, and our data showed atrophy of the PVN in ALS (average 30% atrophy compared to controls) (Figure 1D-F, Table 2). Multiple regression analyses with hypothalamic volume or PVN volume as dependent variables, and group, age and sex as independent variables showed significant differences between ALS and control cases, but no significant effects of age or sex (Supplementary statistical analyses 1). We found no significant correlation between the volumes of the hypothalamus and the PVN with post-mortem delay time rs = 0.086; p = 0.761 and rs = 0.088, p = 0.754 respectively. There was variability but no consistent reduction in the volume of the fornix (Table 2).
 Reduction in the volume of the hypothalamus and PVN in ALS. The total hypothalamic and PVN volumes were estimated in CV/LFB stained sections using the principles of delineation and stereology as described previously.20 Representative photograph of a coronal section of the hypothalamus in a control case (A) and an ALS case (B). The dashed lines illustrate how the hypothalamic region and the PVN were delineated. The total hypothalamic volume was significantly reduced in the ALS group (C). * = p p
TABLE 2.
Hypothalamic volumes and neuronal numbers (average ± standard deviation)
Measures
ALS
Control
U test
p value
Volumes
Brain (ml)
1329 ± 194
1429 ± 133
19
0.114
Hypothalamus (mm3)a
321 ± 59
406 ± 46
4.5
0.004
PVN (mm3)a
11 ± 2
15 ± 5
9.0
0.015
Fornix (mm3)a
47 ± 6
54 ± 11
18.5
0.167
Neuronal number
Oxytocina
13,526 ± 6304
26,753 ± 6194
2.0
0.024
Vasopressina
31,809 ± 10,928
34,813 ± 9420
13.5
0.711
CARTa
27,675 ± 11,470
29,550 ± 16,286
15.0
0.933
Orexin
22,371 ± 7887
35,550 ± 6491
2.0
0.024
Abbreviations: CART, cocaine- and amphetamine-regulating transcript; PVN, paraventricular nucleus.
Confirming TDP-43 inclusions in the hypothalamus in ALS
Reduction in the volume of the hypothalamus and PVN in ALS. The total hypothalamic and PVN volumes were estimated in CV/LFB stained sections using the principles of delineation and stereology as described previously.20 Representative photograph of a coronal section of the hypothalamus in a control case (A) and an ALS case (B). The dashed lines illustrate how the hypothalamic region and the PVN were delineated. The total hypothalamic volume was significantly reduced in the ALS group (C). * = p p
TABLE 2.
Hypothalamic volumes and neuronal numbers (average ± standard deviation)
Measures
ALS
Control
U test
p value
Volumes
Brain (ml)
1329 ± 194
1429 ± 133
19
0.114
Hypothalamus (mm3)a
321 ± 59
406 ± 46
4.5
0.004
PVN (mm3)a
11 ± 2
15 ± 5
9.0
0.015
Fornix (mm3)a
47 ± 6
54 ± 11
18.5
0.167
Neuronal number
Oxytocina
13,526 ± 6304
26,753 ± 6194
2.0
0.024
Vasopressina
31,809 ± 10,928
34,813 ± 9420
13.5
0.711
CARTa
27,675 ± 11,470
29,550 ± 16,286
15.0
0.933
Orexin
22,371 ± 7887
35,550 ± 6491
2.0
0.024
Abbreviations: CART, cocaine- and amphetamine-regulating transcript; PVN, paraventricular nucleus.
Confirming TDP-43 inclusions in the hypothalamus in ALS
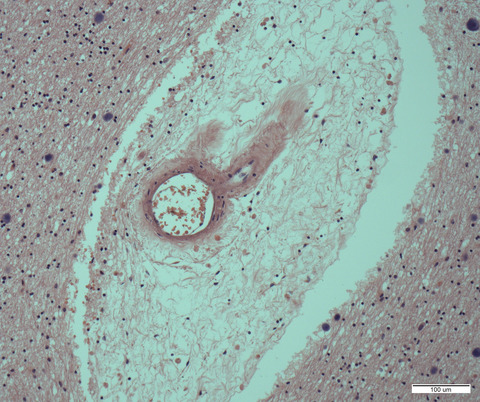
The formation of intracellular inclusions of TDP-43 is a hallmark of pathology in ALS and TDP-43 inclusions have been found in the lateral hypothalamus in ALS patients.17 We assessed the presence of TDP-43 inclusions (Figure 2) in the PVN, lateral hypothalamus and fornix in ALS. We found that TDP-43 immunopositive intracellular inclusions were present in all these regions in all ALS cases. The frequency of the inclusions was <1% of cells.

TDP-43 immunopositive inclusions in the hypothalamus in ALS. TDP-43 immunopositive intracellular inclusions in the PVN (A), lateral hypothalamus (B) and the fornix (C) in ALS cases counterstained with CV. Arrows point to TDP-43 immunopositive inclusions. Scale bar in C: 25 µm
Selective loss of oxytocin- and orexin-containing neurons in ALSWe then investigated if there was a reduction in the number of the peptidergic containing neurons (oxytocin-, vasopressin-, CART- and orexin) in the hypothalamus as these peptides also play a role in eating behaviour and metabolism.14-16 Oxytocin and vasopressin are produced in the PVN and supraoptic nucleus, with vasopressin also produced in the suprachiasmatic nucleus.28 CART is produced in the PVN, arcuate nucleus, dorsomedial and lateral hypothalamus29 and orexin found in the lateral hypothalamus.30
Quantitation of PVN neurons found no loss of vasopressin- (Figure 3D-F) or CART- immunopositive neurons (Figure 3G-H), but there was a reduction of 49% in the number of oxytocin-immunopositive neurons in ALS cases compared to controls (Figure 3A-C, Table 2). Quantitation of the lateral hypothalamus showed a reduction of 37% of orexin neurons in ALS cases compared to controls (Figure 4A-C, Table 2). As the orexin- and oxytocin-expressing neuronal populations were affected in ALS cases, we investigated whether the frequency of the TDP-43 inclusions would be higher in these neurons. In fact, 24 ± 6% of the orexin-expressing neurons and 33 ± 6% of the oxytocin-expressing neurons had TDP-43 inclusions as assessed in the confocal microscope (Figure 5).

Neuropeptidergic neurons in the PVN in ALS. The total number of neurons expressing the neuropeptides oxytocin (A-C), vasopressin (D-F), CART (G-I) was assessed in the PVN using stereology in immunohistochemically processed sections (one every 15 sections cut through the whole hypothalamus). The representative photomicrographs are from controls (A,D,G) and cases of ALS (B,E,H) and graphs (C,F,I) show the individual and group data. The data is expressed as mean ± SD (n = 4–8/group). * = p < 0.05, Mann-Whitney U-test. Scale bar in H: 400 µm

Orexin-immunopositive neurons in ALS. The total number of neurons expressing the neuropeptide orexin (hypocretin, A-C) was assessed using stereology in immunohistochemically processed sections in one series of 15 cut through the whole hypothalamus. The data are expressed as mean ± SD (n = 4–7/group). * = p < 0.05, Mann-Whitney U-test. Scale bar in B: 400 µm.

Presence of TDP-43 inclusions in the orexin and oxytocin neuronal populations in ALS. Representative high-power immunofluorescence images taken from human post-mortem hypothalamic tissue from ALS cases immunohistochemically processed for TDP-43 (red) and oxytocin (green, A-C) and orexin (green, D-F) respectively. Orthogonal images show TDP-43 co-localising with oxytocin and orexin neurons respectively. The images were taken by using a Nikon confocal microscope with 60X apochromat oil-immersion objective. Scale bar = 10 μm
Factor analysisA factor analysis was performed to determine the interrelationships between continuous clinical and pathological variables in the ALS group (Factors included in analyses are marked in Tables 1 and 2, Supplementary statistical analyses 2, also contains correlation matrix). Two main factors containing significant loadings of clinical and pathological variables were identified accounting for 33% and 32% of the variance respectively. Factor 1 (Table 3) showed significant interrelationships between the different CBI items identifying abnormal eating behaviours, hypothalamic atrophy and the number of orexin neurons. Hypothalamic atrophy and reduced orexin neuronal numbers were related to increasing evidence of abnormal eating behaviours (Table 3). Factor 2 (Table 3) showed significant interrelationships between disease progression (measured by decreasing ALSFRS), cognitive dysfunction (reduced ACE-R), increased frequency of abnormal behaviours (CBI total frequency), including sleep behaviours (CBI sleep score) and eating the same foods (CBI same foods score), and a reduction in the volume of the fornix and the number of PVN CART neurons (even though these were not reduced overall). These abnormalities occur in concert with disease progression (Table 3).
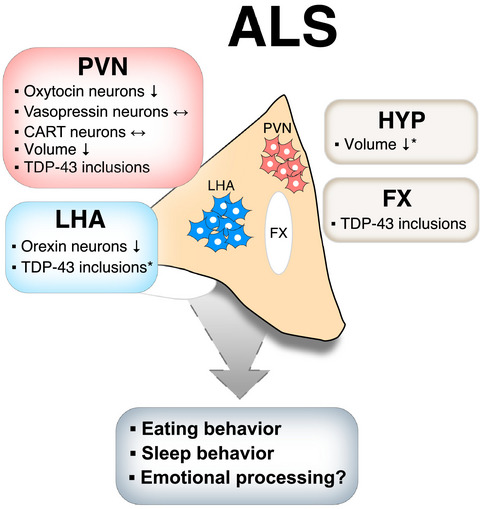
TABLE 3. Interrelationship between clinical and pathological variables Factor (% variance explained) Variables Loadings Factor 1 (33%) CBI Total eating score 0.67 CBI Item31 sweet food preference 0.87 CBI Item33 increased appetite 0.90 CBI Item34 reduced table manner 0.96 Hypothalamic volume −0.72 Number of orexin-producing neurons −0.83 Factor 2 (32%) ALSFRS 0.79 ACE 0.80 CBI total frequency −0.85 CBI Item 32 same foods −0.75 CBI sleep −0.82 Fornix volume 0.69 Number of PVN CART-producing neurons 0.66 Abbreviations: ACE-R, revised Addenbrooke's cognitive examination; ALSFRS, ALS functional rating scale; CART, cocaine- and amphetamine-regulating transcript; CBI, Cambridge behavioural inventory; PVN, paraventricular nucleus. See Supplementary statistical analyses 2 for statistical output and correlation matrix. DISCUSSIONIn this comprehensive evaluation of pathological changes of the neuropeptidergic neurons of the hypothalamus in ALS, we have identified hypothalamic atrophy and a selective loss of oxytocin-producing neurons in the PVN and orexin-producing neurons in the lateral hypothalamus in ALS, with no overall change to vasopressin- and CART-producing neurons. Abnormal TDP-43 inclusions were also identified in the hypothalamus of all ALS cases, where around 23% of orexin neurons and 33% of oxytocin neurons were estimated to contain TDP-43 inclusions. The consistent and dramatic loss of oxytocin-producing neurons in ALS patients was not related to demographic or clinical indices. Loss of orexin-producing neurons was related to eating abnormalities, as was overall hypothalamic atrophy. This is a highly selective reduction in neuropeptidergic secreting hypothalamic neurons that would impact on the regulation of eating behaviour and metabolism in ALS (Figure 6). In addition, the milder but progressive atrophy of the fornix and the number of CART-producing neurons both correlated with abnormal sleep behaviours and cognition with clinical progression of ALS (as measured by ALSFRS). These data suggest that degeneration of select groups of peptidergic neurons in the hypothalamus significantly may impact the pathogenesis and clinical behavioural changes seen in ALS.
 Overview of the pathology in the hypothalamus in ALS and its potential implication for clinical features. A summary of the findings from hypothalamic analyses of clinical ALS in the present study and two previous studies (marked with * for hypothalamic atrophy12 and TDP-43 inclusions in the LHA.17). CART: Cocaine and amphetamine regulated transcript; FX: Fornix; HYP: Hypothalamus; PVN: Paraventricular nucleus; LHA: Lateral hypothalamic area
The specificity of these deficits in hypothalamic neuropeptide populations to function and not pathology is highlighted by the preservation of these neuronal groups in frontotemporal dementia with TDP-43 inclusions,10 while there are similar overall peptidergic cell changes in Huntington's disease (see review31). There is no loss of PVN oxytocin neurons with age or Alzheimer's disease,32 suggesting only certain neurodegenerative diseases impact on these hypothalamic oxytocin neurons. Both ALS and Huntington's disease have pre-symptomatic weight loss in association with systemic metabolic dysfunction and significant muscle wasting.1, 33, 34 Of direct interest is the observation that oxytocin is a myokine that activates a complex array of signalling pathways that regulate muscle homeostasis,35 with muscle regeneration significantly impaired in oxytocin knock-out mice.36 Physical exercise increases hypothalamic (and plasma) oxytocin that impacts directly on muscle health,35 and is currently recommended for patients with Huntington's disease37 where upper and lower motor neurons are not impacted (in contrast to ALS).1 Enhancement of peripheral oxytocin38 may assist muscle wasting and energy metabolism in both these neurodegenerative disorders, although without motor neuron saving therapies, it is likely to be of less benefit to patients with ALS.
Near complete loss of hypothalamic orexin neurons occurs in narcolepsy,39 while only a mild loss of orexin neurons occurs in Alzheimer's disease, Huntington's disease (see review12) and Parkinson's disease.40 In Alzheimer's disease, the loss of these neurons is associated with reduced BMI (see reviews12, 31), while in Parkins
留言 (0)