
記住我
Medullary thyroid cancer (MTC) is a rare malignancy, which originates from the parafollicular C cells of the thyroid gland, accounting for nearly 3%–5% of all thyroid cancers.1, 2 Most MTC cases are sporadic, and 20%–30% of cases are multiple endocrine neoplasia type 2 (including MEN2A and MEN2B) or familial.3, 4 Despite low incidence, the 10-year overall survival rate of regional MTC was estimated at approximately 75% and decreased to 40% in patients with metastasis.5 Early diagnosis and surgery are effective methods to improve both cure and survival rates. Moreover, novel approaches include targeted agents that are proven means of antitumor therapeutics's for clarity. Vandetanib and cabozantinib are used as the evidence-based treatment of advanced MTC.6, 7 However, a common limitation of targeted drug therapy is to develop drug resistance and this phenomenon is independent of the type of tumor.8
Previous studies have intensively predicted the prognosis of MTC, mainly limiting to the clinicopathological characteristics and therapeutic strategies.9-11 However, with the growing understanding of human health and disease, more attention is being paid to socio-psychological factors. A previous clinical trial found that psychosocial factors were linked with low back pain and may affect the prognosis.12 Marital status is recognized as one type of socio-psychological factor that influences the cancer survival.13 Extensive studies focused on marital status and cancers showed that married patients have significantly better survival compared to unmarried ones.14-16 Nonetheless, in analyses to present, few studies on marital status among MTC patients have been conducted.
The Surveillance, Epidemiology, and End Results (SEER) program collects the data of 18 registries on cancer diagnosis, treatment, and survival for nearly 30% of the US population.17 It creates a shared research field, thus we can easily analyze the effect of marital status among different cancers. In this study, we analyzed the data from MTC patients using the SEER database. Our work aims to explore the effects of marital status in MTC, especially for older patients.
2 MATERIALS AND METHODS 2.1 Study populationThe data of MTC patients were downloaded from the SEER*Stat Database, version 8.3.6. Patients were chosen for this study if they met the following criteria: (1) Primary sites defined by the International Classification of Diseases for Oncology (ICD-O-3), code C73.9. (2) Patients diagnosed with primary cancer from 2004 to 2015. (3) Histological codes were limited to MTC (8345, 8510). Exclusion criteria included: (1) Patients aged less than 18. (2) Patients with incomplete clinical characteristics and treatment. (3) Patients with incomplete demographic and follow-up information. Finally, 1344 eligible patients were selected for analysis according to inclusion and exclusion criteria.
2.2 Study variablesStudy variables included sex, age at diagnosis, race, marital status, tumor stage, nodal stage, metastasis, surgery, survival months, and vital status. Age was considered as a continuous variable, measured by means and standard deviations. X-tile software (version 3.6.1) was used to analyze the best cut-off point (52 year old) for the age.18 After that, two age groups were defined as more than 52 years versus those aged 52 years and lower. The race was divided into three groups: White, Black, and Others (Asian or Pacific Islander, American Indian/Alaska Native). Marital status was categorized into married and unmarried (divorced, separated, widowed, never married, or domestic partner). Thyroid surgery was classed into three groups: none, lobectomy/isthmectomy, and total thyroidectomy. For tumor (T), nodal (N), and metastasis (M) status, the TNM status was assessed according to the sixth edition of TNM classification for medullary thyroid cancer. Overall survival (OS) and cancer-specific survival (CSS) were also analyzed for all eligible patients. The former was calculated from the date of diagnosis to the date of any death, while the latter was estimated from diagnosis to cancer-specific caused death.
2.3 Statistical analysisBaseline data were expressed as frequency or mean ± standard deviation according to the data type. Categorical variables were assessed by the Pearson chi-squared test, while the continuous variables were examined by the t-test or the Mann–Whitney U test. The survival of marital status and age subgroups was analyzed by the Kaplan–Meier curves, and their differences were evaluated by the log-rank test. Univariate and multivariate Cox proportional hazards models were used to distinguish the independent prognostic factors in MTC, and their effects were presented as hazard ratio (HR) with 95% confidence intervals (CIs). Similarly, we evaluated the effects of marital status stratified by age, using the multivariate Cox proportional hazards models to analyze the survival difference between married and unmarried in pathological subgroups. All statistical analyses in this study were performed using SPSS (version 26.0) and R software (version 4.1.0). A two-tailed p value of less than 0.05 was considered statistically significant.
3 RESULTS 3.1 Patients baseline characteristicsWe selected 1344 eligible MTC patients diagnosed between 2004 and 2015 in the SEER database. It included 532 (39.3%) male and 816 (60.7%) female patients, with a mean age of 52.9 ± 15.5 years at the diagnosis of MTC. Among them, 883 (65.8%) were married and 461 (34.2%) were unmarried. Between married and unmarried groups, we observed significant differences in sex, age, race, and surgery (all p < 0.001). Besides, married patients were male (45.2% vs. 28.0%), older (age ≥ 52) (55.9% vs. 44.6%), White (86.7% vs. 78.7%), more likely to undergo surgery (97.7% vs. 93.3%), and less to be in M1 status (7.2% vs. 10.2%) compared to unmarried patients. The summary of baseline patient characteristics grouped by marital status is described in detail in Table 1.
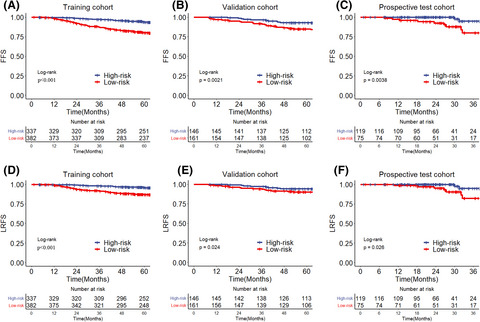
TABLE 1. Baseline characteristics of patients with MTC in SEER database Characteristics Total (%) Married (%) Unmarried (%) p valueb Number N = 1344 (100) N = 883 (65.7) N = 461 (34.3) Sex Female 816 (60.7) 484 (54.8) 332 (72.0) <0.001 Male 528 (39.3) 399 (45.2) 129 (28.0) Agea Mean ± SD 52.9 ± 15.5 54.0 ± 14.1 50.7 ± 17.9 <0.001 <52 637 (47.4) 389 (44.1) 248 (53.4) ≥52 707 (52.6) 494 (55.9) 213 (46.6) Race White 1129 (84.0) 766 (86.7) 363 (78.7) <0.001 Black 127 (9.4) 53 (6.0) 74 (16.1) Others 88 (6.5) 64 (7.3) 24 (5.2) Tumor stage T1 581 (43.2) 365 (41.3) 216 (46.9) 0.281 T2 347 (25.8) 234 (26.5) 113 (24.5) T3 282 (21.0) 193 (21.9) 89 (19.3) T4 134 (10.0) 91 (10.3) 43 (9.3) Nodal stage No 783 (58.3) 513 (58.1) 270 (58.6) 0.877 N1a 166 (12.4) 107 (12.1) 59 (12.8) N1b 395 (29.4) 263 (29.8) 132 (28.6) Metastasis M0 1233 (91.7) 819 (92.8) 414 (89.8) 0.062 M1 111 (8.3) 64 (7.2) 47 (10.2) Surgery No 51 (3.8) 20 (2.3) 31 (6.7) <0.001 IT/LT 94 (7.0) 63 (7.1) 31 (6.7) TT 1199 (89.2) 800 (90.6) 399 (86.6) Variables with statistical significance were shown in bold. Abbreviations: IT/LT, isthmectomy/lobectomy; MTC, medullary thyroid cancer; SEER, The Surveillance, Epidemiology, and End Result; TT: total thyroidectomy or near total thyroidectomy. 3.2 Effects of marital status on OS and CSSThe effects of marital status on OS were examined by K-M curves, which showed married patients had a significantly superior OS compared to unmarried ones (Figure 1A). Similarly, the significant differences of CSS were also observed among different marital groups (Figure 1B) with a better CSS in married populations than in unmarried ones. To evaluate the prognosis-related factors of MTC, we first performed the univariate cox analysis. The results showed that marital status, sex, age, tumor stage, nodal stage, metastasis, and surgery were regarded as significant prognostic factors for both OS (all p < 0.05) (Table 2) and CSS (all p < 0.05) (Table 3). Race was a prognostic factor for CSS (p < 0.05), but not OS (p > 0.05) in univariate analysis. Subsequently, those above-mentioned significant factors were analyzed in a multivariate cox model. After multivariate adjustment, marital status remained a significant prognostic factor in OS (p < 0.001) and CSS (p = 0.006), with worse OS (HR: 2.15, 95% CI: 1.59–2.92) rate and CSS (HR: 1.70, 95% CI: 1.17–2.47) rate in unmarried patients compared to married ones. However, there was no significant survival difference observed in sex (OS: p = 0.858, CSS: p = 0.826).

The Kaplan–Meier survival curves: (A) The overall survival and (B) the cancer-specific survival according to marital status
TABLE 2. Univariate and multivariate analyses for OS in MTC patients Variables Univariate analysis Multivariate analysis HR (95% CI) p value HR (95% CI) p value Sex Female Reference Reference Male 1.61 (1.21–2.14) 0.001 0.97 (0.71–1.33) 0.858 Agea <52 Reference Reference ≥52 3.58 (2.55–5.02) <0.001 4.33 (3.06–6.13) <0.001 Race White Reference Black 1.22 (0.78–1.91) 0.373 Others 0.50 (0.22–1.12) 0.093 Marital status Married Reference Reference Unmarried 1.63 (1.23–2.17) 0.001 2.15 (1.59–2.92) <0.001 Tumor stage T1 Reference Reference T2 1.86 (1.18–2.93) 0.007 1.86 (1.18–2.94) 0.008 T3 3.54 (2.33–5.38) <0.001 2.26 (1.42–3.59) 0.001 T4 9.65 (6.39–14.58) <0.001 3.96 (2.43–6.44) <0.001 Nodal stage N0 Reference Reference N1a 2.26 (1.44–3.54) <0.001 1.77 (1.10–2.86) 0.019 N1b 4.11 (2.99–5.65) <0.001 1.84 (1.22–2.76) 0.004 Metastasis M0 Reference Reference M1 11.50 (8.51–15.54) <0.001 3.86 (2.65–5.61) <0.001 Surgery No Reference Reference IT/LT 0.06 (0.03–0.13) <0.001 0.31 (0.14–0.67) 0.003 TT 0.08 (0.06–0.12) <0.001 0.30 (0.20–0.46) <0.001 Variables with statistical significance were shown in bold. Abbreviations: IT/LT, isthmectomy/lobectomy; MTC, medullary thyroid cancer; OS, overall survival; TT: total thyroidectomy or near total thyroidectomy. TABLE 3. Univariate and multivariate analyses for CSS in MTC patients Variables Univariate analysis Multivariate analysis HR (95% CI) p value HR (95% CI) p value Sex Female Reference Reference Male 2.05 (1.46–2.88) <0.001 0.96 (0.66–1.39) 0.826 Agea <52 Reference Reference ≥52 2.48 (1.71–3.59) <0.001 2.96 (2.01–4.38) <0.001 Race White Reference Reference Black 1.32 (0.79–2.19) 0.291 1.90 (1.11–3.23) 0.019 Others 0.11 (0.02–0.81) 0.030 0.10 (0.01–0.70) 0.021 Marital status Married Reference Reference Unmarried 1.53 (1.09–2.16) 0.014 1.70 (1.17–2.47) 0.006 Tumor stage T1 Reference Reference T2 2.36 (1.24–4.49) 0.009 2.23 (1.16–4.28) 0.016 T3 6.03 (3.40–10.72) <0.001 2.86 (1.53–5.33) 0.001 T4 19.17 (10.98–33.48) <0.001 5.24 (2.78–9.86) <0.001 Nodal stage N0 Reference Reference N1a 3.93 (2.21–6.99) <0.001 2.81 (1.52–5.20) 0.001 N1b 7.98 (5.15–12.36) <0.001 2.77 (1.62–4.73) <0.001 Metastasis M0 Reference Reference M1 19.56 (13.89–27.54) <0.001 6.05 (3.95–9.25) <0.001 Surgery No Reference Reference IT/LT 0.04 (0.02–0.10) <0.001 0.34 (0.13–0.93) 0.036 TT 0.06 (0.04–0.10) <0.001 0.32 (0.20–0.50) <0.001 Variables with statistical significance were shown in bold. Abbreviations: CSS, cancer-specific survival; IT/LT, isthmectomy/lobectomy; MTC, medullary thyroid cancer; TT: total thyroidectomy or near total thyroidectomy. 3.3 Effects of marital status on OS and CSS according to age stratificationWe first assessed the association between age and survival by the Kaplan–Meier curves, which indicated that older patients were more likely to present worse survival compared to youngers (OS: p < 0.001; CSS: p < 0.001) (Figure 2A,B). Furthermore, to determine the effects of marital status on the survival of different pathological stages varies with age. We compared the OS and CSS of unmarried versus married based on age stratification by multivariate cox models, which were adjusted for the sex, race, marital status, TNM stage, and surgery. As shown in Table 4, marital status had no effect on survival in MTC patients younger than 52 years of age. In older patients, however, marital status had a significant effect on survival at all pathological subgroups except M1 stage, with unmarried groups presented a higher risk of OS and CSS (all p < 0.05) compared to married ones. These results showed that marriage had a significant protective effect in older patients among different pathological stages and its effect declined when the tumor progressed.

The Kaplan–Meier survival curves: (A) The overall survival and (B) the cancer-specific survival according to age
TABLE 4. The OS and CSS associated with being unmarried (vs. married) among MTC patients stratified by age, sex, and pathological stages Agea OS CSS HR (95% CI)b p value HR (95% CI)b p value <52 Sex Female 0.90 (0.35–2.31) 0.834 1.07 (0.42–2.68) 0.892 Male 1.29 (0.19–3.39) 0.613 1.29 (0.19–3.39) 0.613 Tumor stage T1/T2 1.86 (0.55–6.28) 0.317 3.27 (1.03–10.42) 0.045 T3/T4 1.03 (0.49–2.18) 0.932 0.95 (0.44–2.06) 0.895 Nodal stage N0 0.78 (0.08–7.17) 0.829 1.52 (0.15–15.38) 0.720 N1 1.13 (0.55–2.33) 0.732 1.14 (0.54–2.41) 0.740 Metastasis M0 0.94 (0.41–2.16) 0.883 1.03 (0.42–2.54) 0.944 M1 2.67 (0.60–11.78) 0.196 2.67 (0.60–11.78) 0.196 ≥52 Sex Female 1.96 (1.21–3.18) 0.007 1.17 (0.60–2.28) 0.649 Male 2.99 (1.75–5.10) <0.001 3.39 (1.83–6.30) <0.001 Tumor stage T1/T2 2.80 (1.62–4.85) <0.001 2.90 (1.33–6.34) 0.007 T3/T4 2.32 (1.40–3.82) 0.001 2.16 (1.23–3.79) 0.007 Nodal stage N0 3.32 (1.84–5.99)
留言 (0)