
記住我


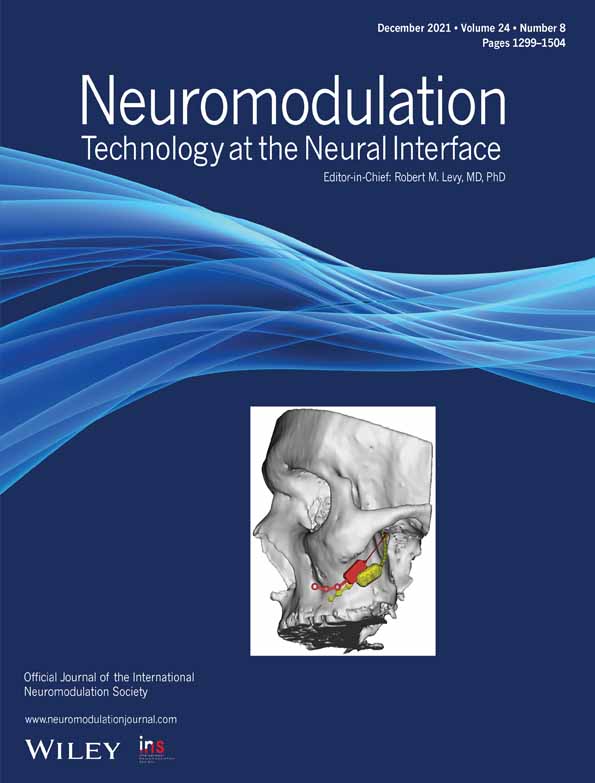


Data were collected from a sample of four chronic pain patients who had received cervical or thoracic epidural spinal cord stimulation for treatment of neuropathic pain due to peripheral and spinal cord injuries (see Table 1 for detailed patient and device information, Fig. 1a). Patients had various etiologies including complex regional pain syndrome (CRPS) and central cord pain due to spinal cavernoma bleeding (for comorbidities, see Table 1). We recorded three of the four patients few days after final implantation of the stimulus generator subsequent to a trial period that proved efficacy of SCS. One of the four patients was recorded two times, in a first session, two days after test implantation with the stimulus generator still being external, and in a second session, one day after final implantation of the stimulus generator, 14 days later. Experiments conformed to the declaration of Helsinki, and were approved by the ethics committee of the Otto-von-Guericke University Magdeburg (135/19).
Table 1. Patient Information. Subject Number of sessions Gender Age Diagnosis Cause of illness Duration Location Spinal level Therapeutic mode NRS presurgery NRS stim. on 1 1 Female 40 Neuropathic pain syndrome with allodynia Compartment syndrome ca. 1 year Left lower arm C4-6 Burst 5–7 0 2 1 female 36 Deafferentation pain syndrome with allodynia Cavernoma with hemorrhage (T3-7) ca. 5 years Thorax (L >> R)leg (L + R) T1-2 Tonic 10 5–7 3 1 Female 48 CRPS Status post rotator cuff surgery ca. 7 months Right lower armright shoulder C4-6 Burst 5 3 4 2 Female 47 CRPS Ulnar nerve compression ca. 4 years Left upper arm and shoulder blade C6-7 Burst 6 3–4 CRPS, complex regional pain syndrome; NRS, numeric rating scale.
Analysis of neuromodulatory effects of SCS on brain oscillations. a. X-ray image of a patient implanted with a SCS electrode. b. Montage of 61 EEG electrodes for a combined recording with SCS. c. Two-step spatial filtering procedure: 1) spatial filter for SCS artifact attenuation (SFA) (we designed it from reconstructed SCS artifact signals for each SCS mode separately); 2) SCS response filter (SFR) enhancing EEG activity modulated by SCS (we designed it from SCS-evoked brain responses at longer latencies in the postartifact response interval).
SCS and EEG RecordingThe electroencephalogram (EEG) was recorded from 61 scalp standard positions (Fig. 1b) with ground at electrode AFz and reference at FCz using a Brainamp recording system (Brain Products GmbH, Germany). Additional skin electrodes were placed on face, neck, and arm, in order to measure eye movement, the electrocardiogram, and SCS-related artifacts. SCS patients sat comfortably in a soundproof, electrically shielded recording chamber, always in contact with the experimenter. We recorded resting state EEG with eyes open in blocks of three to five minutes for each SCS mode, and for the condition with SCS switched off. Between blocks, the experimenter selected the stimulation mode for the next recording block using the SCS remote control. A block of tonic stimulation (TONIC mode) was recorded in all five sessions. In four sessions the tonic pulse rate was 40 Hz (patients 1, 3, and 4), and in one 80 Hz (patient 2, Table 1). Notably, our analysis was not aiming on detailed differences between specific mode parameters, but on general differences between modes. Blocks of active recharge burst stimulation (BURST mode) with a pulse rate of 200 Hz and a burst rate of 40 Hz, and high-frequency stimulation set to a pulse rate of 1200 Hz (HF mode) were recorded in four sessions in patients 1, 3, and 4. In three sessions (patients 3 and 4) a block of low-frequency stimulation at 2 Hz (LF mode) was recorded to characterize responses to single SCS pulses. Stimulation intensity was always kept 20% below the threshold level inducing paresthesia for BURST, and 30% below threshold level for HF mode. For the TONIC mode, stimulation intensity was set to a level comfortable for the patient at paresthesia threshold. In all sessions, we finally recorded a block of rest with SCS switched off (OFF condition). We compared resting EEGs during SCS in different modes to the corresponding OFF condition in each session. We did not inform subjects about the selected SCS modes; although they could not be completely blinded from switching modes. We used maximum possible sampling rates of 5000 Hz for EEG recording to reduce distortions by SCS artifacts.
Data AnalysisUsing Matlab (The MathWorks, Natick, MA, USA) and the Matlab-based EEGLAB toolbox (12), we set up a robust analysis pipeline for filtering the EEG from SCS artifacts (11) and from confounding unspecific EEG changes, for example, related to vigilance changes during the recording, and for enhancing brain activity modulated by SCS (Fig. 1c). For general artifact rejection, consecutive, nonoverlapping epochs of raw EEG with one second duration were inspected by eye. Epochs containing eye blink artifacts, muscle artifacts, or abnormal signal steps and clippings were excluded from further analysis. We interpolated bad channels after rejection upon visual inspection. Before further analysis, we re-referenced each EEG channel to a common average reference, and removed signal trends.
Each SCS cycle produced an artifact signal, which allows us to identify the onset of each cycle in each mode. We determined this onset by analyzing the artifact signal either from the EEG channel with the largest pulse artifact or from a bipolar recording with two electrodes placed on the skin of the neck, lateral to the cervical spine. We segmented the artifact signal into consecutive, nonoverlapping epochs of the duration of the SCS interpulse/interburst interval (i.e., 25 ms for TONIC and BURST blocks, and 500 ms for LF blocks). For HF blocks, we spectrally determined the stimulation frequency to be 1204.8 Hz, and used an epoch length of 24.9 ms which exactly includes 30 stimulation cycles. Stimulus-locked pulse artifact waveforms were then reconstructed by averaging artifact signals in a moving window of 24 epochs. This smoothing compensates for slow changes of pulse and burst timing that can arise from sampling errors and clock jitters of the stimulation and recording devices. Reconstructed waveforms consisted of biphasic pulses. The pulse's onset was determined by marking the time point when the averaged artifact signal crossed a threshold of one standard deviation. We used the time stamp of the positive or negative peak preceded by the longest interpeak interval as marker for SCS cycle onset.
In a second step, we used the SCS cycle onset marker to determine averaged EEG responses during the SCS cycle from −5 to 20 ms relative to cycle onset in TONIC, and BURST, and from −100 to 300 ms in LF mode. In these modes, biphasic pulses of the SCS artifact affected the response up to maximally 7 ms after cycle onset in TONIC and LF modes, and up to 17 ms in the BURST mode (Fig. 2a, artifact intervals marked in light red). In the HF mode, the artifact lasted the entire 24.9 ms interval of the epoch (Fig. 2a, third panel). In turn, we defined a postartifact response interval from 7 to 20 ms in TONIC mode, and from 7 to 300 ms in LF mode (Fig. 2a, response interval marked in light green). In the other modes, the time interval with only a small SCS artifact was too short, to reliably estimate a brain response.

Examples of EEG artifacts and brain responses evoked by SCS. a. Channel by channel EEG responses to different modes of SCS averaged across stimulation cycles relative to cycle onset from a single recording session. Responses for each channel are displayed in a different color. Time intervals affected by the artifact are marked in light red, postartifact response intervals in light green. b. Averaged SCS-evoked EEG response for each channel to single pulses in the TONIC or LF mode after spatial artifact filtering (+SFA). The two examples stem from single recording sessions. c. Averaged SCS-evoked EEG response to single pulses in the TONIC and LF modes after two-step spatial filtering for artifact attenuation (+SFA), and response enhancement (+SFR). Example for a single recording session.
In a next step, we used the averaged EEG responses in the artifact and the postartifact interval as target signals to design spatial SCS artifact filters for artifact attenuation, and SCS response filters for enhancing neuromodulatory signals, respectively. Generally, spatial filters consist of weight vectors or matrices, which are multiplied (dot product) with the original multichannel time series, in order to yield a new signal from a weighted sum of all EEG channels. To construct the filter, we used a recently established multivariate technique called joint decorrelation, an extension of principle component analysis (12). It is based on covariance matrices calculated from target and noise signals, and yields a weight matrix for the linear combination of channels that optimizes the defined target signal to noise ratio. The spatial artifact filters (SFA) optimized the signal to noise ratio (SNR) of the averaged EEG response of the artifact interval in each mode, while the spatial response filters (SFR) optimized the SNR of the SCS-evoked single pulse response in the postartifact interval of the TONIC or LF mode (Fig. 2b, that is, the two modes for which SCS artifact was long enough to estimate brain signals, see above). Spatial filters were statistically evaluated by repeating filter construction 500 times with surrogate data randomly resampled from the EEG (12).
Spectral analysis was carried out on artifact free, 1s epochs of transformed EEG signals by applying a 1024 point 5-taper FFT using the chronux Matllab toolbox (14). In order to avoid biasing and double dipping, the spatial artifact filters constructed for each mode were applied all in the same sequence to every signal of a recording session, so that data for all SCS modes were preprocessed identically.
From the SCS response filter components, we selected the one with the highest SNR that showed the smallest artifact residuum and the largest response at latencies longer than seven milliseconds, that is, after the end of the SCS artifact in the TONIC and LF modes used for response filter construction. Spectral analysis was then carried out on the projection of the 61 channel resting state EEG signal on the selected spatial SCS response filter component, or, alternatively, on the EEG channel mean.
As changes in band power might reflect noise-related background changes, we removed aperiodic background activity by fitting a spectral model (15). For statistical analysis, EEG power was averaged in standard frequency bands (2–6, 6–8, 8–12, 12–20, 20–36, 44–76, and 84–130 Hz), and subjected to nonparametric, maximum t value permutation tests, both within, and across subjects, which are applicable to small sample sizes and compensate for multiple testing across frequencies (16).
留言 (0)