
記住我
 Lee, Jung, Ha, Oh, Kim, Park, Yoo, and Won: Nationwide Population-Based Incidence and Survival Rates of Malignant Central Nervous System Germ Cell Tumors in Korea, 2005-2012
Nationwide Population-Based Incidence and Survival Rates of Malignant Central Nervous System Germ Cell Tumors in Korea, 2005-2012
Abstract
Purpose
Lee, Jung, Ha, Oh, Kim, Park, Yoo, and Won: Nationwide Population-Based Incidence and Survival Rates of Malignant Central Nervous System Germ Cell Tumors in Korea, 2005-2012
Nationwide Population-Based Incidence and Survival Rates of Malignant Central Nervous System Germ Cell Tumors in Korea, 2005-2012
Abstract
Purpose
Malignant central nervous system (CNS) germ cell tumors (GCTs), although rare, are thought to occur more frequently among Asians. However, a recent population-based study revealed no differences in GCT incidence between Asians and Caucasians. Therefore, this study was conducted to determine the incidence and survival rates of CNS GCTs using the national cancer incidence database, and to compare these rates to those in the United States and Japan.
Materials and MethodsWe extracted CNS GCT patients diagnosed between 2005 and 2012 from the Korea Central Cancer Registry database. Age-standardized rates (ASRs), annual percentage change, and the male-female incidence rate ratios (IRRs) were calculated. To estimate the survival rate, we used data for patients diagnosed between 2005 and 2010 and followed their cases until December 31, 2013.
ResultsThe ASR for CNS GCT between 2005 and 2012 was 0.179 per 100,000 (95% confidence interval, 0.166 to 0.193), with an overall male-to-female (M:F) IRR of 2.95:1. However, when stratified by site, the M:F IRR was 13.62:1 for tumors of the pineal region and 1.87:1 for those located in nonpineal regions. The most frequent histologic type was germinoma (76.0%), and the most frequent location was the suprasellar region (48.5%). The 5-year survival rate of germinoma patients was 95.3%.
ConclusionThe incidence rate of CNS GCTs in Korea during 2005-2012 was 0.179 per 100,000, which was similar to that of the Asian/Pacific Islander subpopulation in the United States. Moreover, the CNS GCT survival rate in Korea was similar to rates in Japan and the United States.
Introduction Malignant central nervous system (CNS) germ cell tumors (GCTs) are uncommon, accounting for less than 1% of primary brain tumors, and occur predominantly during childhood. The incidence of CNS GCTs has been reported to exhibit a marked association with race, appearing to be more common in Asian countries than in the West [1-13]. However, the majority of previous reports were based on single institution experiences rather than the general population. Recently, a population-based comparison study between Japan and the United States found no significant difference in the incidence of malignant CNS GCTs between these two countries [14]. In contrast, the Central Brian Tumor Registry of the United States (CBTRUS) report published in 2014 stated that Asians/Pacific Islanders (age-standardized rate [ASR], 0.19) were associated with a higher incidence rate of CNS GCTs than Caucasian (ASR, 0.10) and African-American (ASR, 0.07) individuals in the United States [15]. Thus, the existence of racial differences in the incidence of CNS GCT remains unclear.The aim of this study was to determine the Korean nationwide incidence and survival rate for primary malignant CNS GCTs. Using the Korea Central Cancer Registry (KCCR) database, we reported the precise CNS GCT incidence by age, sex, histological type, and topography in Korea, as well as the survival rate during 2005-2012.
Materials and Methods 1. Data sources In 1999, the KCCR expanded cancer registration to cover the entire population under the Population-Based Regional Cancer Registry Program [16]. National cancer incidence reports for diseases diagnosed since 1999 began to be published in 2005, and the incidence data for 2012 was 97.7% complete [17]. Data for this study were obtained from the KCCR database.As GCTs are often malignant, we included only malignant GCTs diagnosed between 2005 and 2012 in this study. We were able to collect more reliable and accurate data describing CNS tumors because, from 2005 onward, information regarding malignant whole-brain and CNS tumors was registered separately from that of benign and borderline tumors. For survival analysis, we included GCTs registered between 2005 and 2010, and followed these cases until December 31, 2013.
GCTs were identified using the International Classification of Diseases for Oncology (third edition), and were selected using the primary sites C70.0-C72.9 and C75.1-C75.3. Tumors were classified into two groups: pineal (C75.3) and nonpineal (C70.0-C72.9 and C75.1-C75.2). Tumors were grouped by histology codes into germinoma (9060, 9061, 9064, and 9065), nongerminomatous GCT (9070, 9071, 9081, 9085, and 9100), and teratoma (9080, 9082, and 9084).
The National Cancer Center Institutional Review Board approved this study (NCC2015-0223). All data were obtained and analyzed after patients were anonymized.
2. Statistical analysisA total of 654 GCT patients were included in this study. Crude rates were calculated by dividing the total number of cases in a given time period by the entire population, and were expressed per 100,000 persons. ASRs were age-adjusted to the United States population in 2000. Annual percent changes in incidence rates were calculated. The male-to-female (M:F) incidence rate ratios (IRRs) were calculated by dividing the age-adjusted incidence rates of male participants by those of female participants.
For survival analysis, we used only data for patients with tumors that were diagnosed between 2005 and 2010, and excluded cases that could not be followed because of mismatched personal identification numbers and cases in which GCTs were not the primary tumors. Ultimately, 446 newly diagnosed GCT cases were included in survival analysis. The overall 1- to 5-year survival rates of GCT patients, as well as survival by sex, age group, primary site, and histological type were calculated using the life-table method. Survival differences were analyzed by the log-rank test. A p-value < 0.05 indicated statistical significance.
All analyses were conducted using SAS ver. 9.2 (SAS Institute Inc., Cary, NC) and STATA 11.0 (StataCorp LP, College Station, TX).
Results 1. Incidence of GCTs The KCCR database included 654 cases of primary malignant GCTs of the brain and CNS diagnosed between 2005 and 2012. The annual average number of registered cases was 81.8, and the overall ASR for CNS GCT was 0.179 per 100,000 people (annual percent change, 0.71%; p=0.732) (Table 1). The incidence of all malignant GCTs was significantly higher in male participants (0.263 per 100,000 people; 95% confidence interval [CI], 0.240 to 0.286) than female participants (0.089 per 100,000 people; 95% CI, 0.075 to 0.104). When ranked according to age, the majority of malignant tumors were reported in the young adult (15-29 years, 47.1%) and pediatric (0-14 years, 45.3%) age groups. The pediatric group had the highest incidence rate (0.434 per 100,000 people), followed by the young adult group (0.365) and the adults aged 30 years and over group (0.021). Approximately 65.4% of GCTs were located outside the pineal region, while the rest were located in the pineal region. The majority (76.0%) of tumors were categorized as germinomas (Table 2). The overall M:F IRR was 2.95:1. However, when stratified by site, the M:F IRR for pineal region tumors was 13.62:1 compared to an IRR of 1.87:1 for tumors located in a nonpineal region (Table 3). 2. Survival of patients with GCTs Among the patients with GCT, 46 patients eventually died during the follow-up period. The 5-year observed survival rate was high for all GCTs, at 91.2% (Table 4). These rates showed no statistically significant differences between male and female participants (male participants, 90.9%; female participants, 92.3%; p=0.658) (Fig. 1A), age groups (0-14 years, 90.7%; 15-29 years, 91.8%; 30 years and over, 90.6%; p=0.912) (Fig. 1B), or primary sites (pineal, 91.5%; nonpineal, 91.1%; p=0.843) (Fig. 1C). However, there was a significant difference according to histological type (germinoma, 95.3%; nongerminomatous GCT, 77.6%; teratoma, 76.5%; p Fig. 1D). Discussion The incidence of CNS GCTs is known to be higher in Asia, Japan, and Korea than in other areas of the world. In particular, CNS GCTs account for relatively high proportions of pediatric brain tumors in East Asia, 7.8% in Japan [18], 14.0% in Taiwan [9], 7.9% in China [8], and 9.5% in Korea [19], whereas their frequencies in North America [6,15] and Europe [7,20] are less than 3%. According to the CBTRUS report, the overall incidence of malignant CNS GCTs between 2007 and 2011 was 0.07 per 100,000 in the United States, with the Asian/Pacific Islander group associated with a higher CNS GCT incidence rate (0.19 per 100,000) than Caucasian and African-American participants [15]. In children, the incidences of CNS GCT, including benign tumors, were 0.21 per 100,000 in total and 0.21, 0.14, and 0.51 per 100,000 in Caucasian, African-American, and Asian/ Pacific Islander populations, respectively [15]. Goodwin et al. [21] also described differences in the incidence of pediatric GCTs according to race (Caucasian, 1.29 per 100,000; African-American, 0.33 per 100,000; and Asian, 2.6 per 100,000). Moreover, the childhood incidence of primary CNS GCTs in a regional survey in Kumamoto Prefecture in southern Japan was found to be 0.45 per 100,000 [4]. These data suggest that an Asian genetic background is strongly associated with the development of CNS GCT. However, a recent study demonstrated that the incidence of CNS GCT in Japan was not significantly higher than that in the United States. McCarthy et al. [14] estimated the incidence of malignant CNS GCTs diagnosed during 2004-2006 in 14 population-based registries representing 31.8% of the total population of Japan and analyzed the Surveillance Epidemiology and End Results program database for 17 population-based cancer registries covering 26% of the population of the United States. Unexpectedly, they found the incidence of malignant CNS GCTs in Japan (0.096 per 100,000) to be similar to that in the United States (0.075 per 100,000), and showed the same sex-based patterns by location [14]. The incidence of CNS GCTs in Japan was low compared to those reported in previous studies. These results prompted us to investigate the actual nationwide population-based incidence of CNS GCTs in Korea.Between 2005 and 2012, 654 cases of newly diagnosed primary malignant CNS GCTs were registered in the KCCR. More than 90% of these tumors were diagnosed with histological confirmation through surgical procedures. The incidence of CNS GCTs in Korea was more than two times higher than that in Japan and the United States. Furthermore, the incidence of pediatric CNS GCTs in Korea (0.434 per 100,000) was similar to the incidence of CNS GCTs in Kumamoto prefecture (0.45 per 100,000). These findings suggest possible geographical variations in CNS GCT incidences in Japan. Kumamoto and Korea may also share a similar genetic background because of their geographical proximity. An international collaborative study would be required to investigate these findings further.
The survival rate of pure germinoma is known to be very high, with the 10-year overall survival rate attaining 90%. For nongerminomatous GCT, the 10-year overall survival rates were reported to be 30%-80% [22]; however, CNS GCTs showed better prognosis among pediatric patients. Matsutani et al. [23] reported that the 10-year survival rates for pure germinoma and mature teratoma were both over 90%. Even though we did not report 10-year survival rates because of our short follow-up period, the survival outcomes observed in this study suggest that CNS GCTs are curable. The 5-year observed survival rate for all patients with CNS GCTs was 91.2%, with no differences observed according to sex, age group, or primary tumor site. However, patients with germinoma showed a greater 5-year survival rate (95.3%) than those with nongerminomatous GCTs (77.6%) and malignant teratomas (76.5%). It should be noted that our study had some limitations. Specifically, the KCCR does not record cancer risk factors or specific treatment-related factors, making it difficult to determine specific prognostic factors for CNS GCT. Nevertheless, the KCCR data encompasses over 97% of the population of Korea [17], and includes up-to-date information with longer follow-up periods than the data sources used in previous studies. This allows incidence rates to be analyzed with excellent internal validity and generalizability. ConclusionIn conclusion, our nationwide population-based study revealed that the incidence of CNS GCTs in Korea is significantly higher than the reported incidence for the overall population of the United States, but is comparable to the rate reported for Americans of Asian/Pacific Islander backgrounds.
Conflicts of InterestConflict of interest relevant to this article was not reported.
AcknowledgmentsThis work was supported by a research grant from the National Cancer Center (No. 1310220).
Fig. 1.Cumulative survival curve of germ cell tumors, 2005-2010. (A) Sex. (B) Age group (yr). (C) Primary site. (D) Histological type.
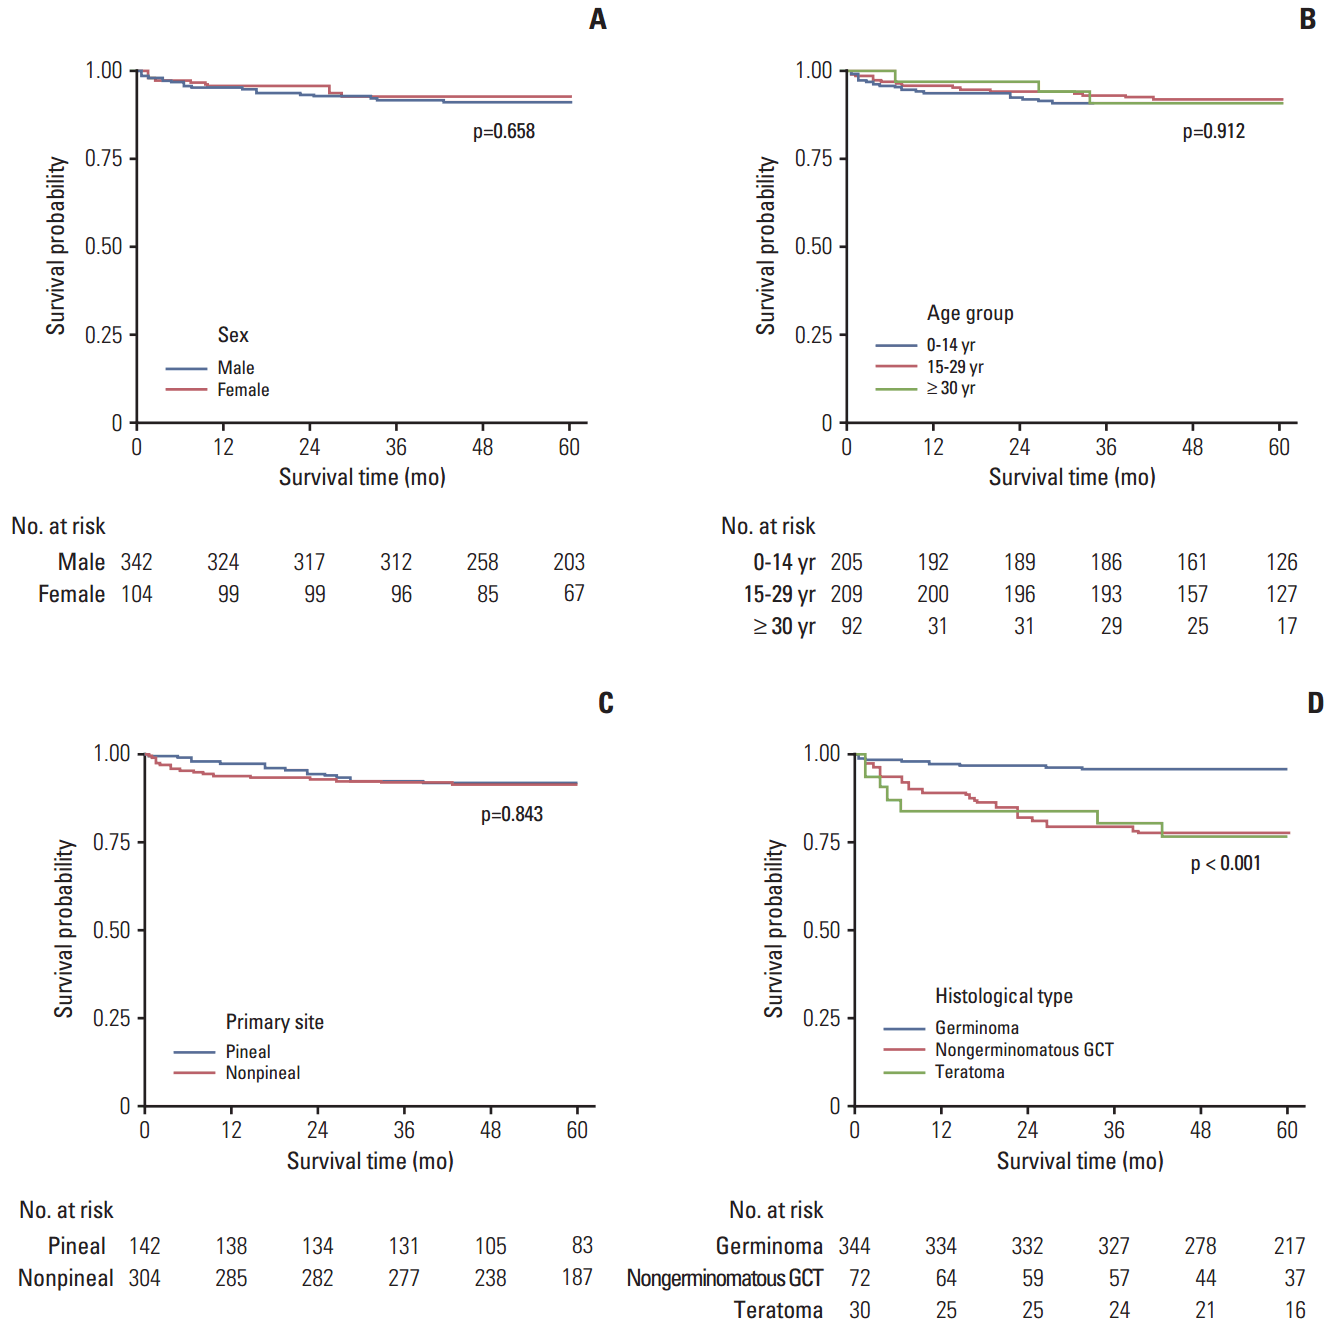 Table 1.
Trends in incidence rate of CNS germ cell tumors, 2005-2012
Year Case Incidence rate (per 100,000) CR ASRa) 2005 80 0.164 0.165 2006 86 0.176 0.183 2007 96 0.195 0.209 2008 71 0.144 0.151 2009 85 0.171 0.189 2010 75 0.150 0.166 2011 72 0.144 0.164 2012 89 0.177 0.209 2005-2012 654 0.165 0.179 Annual percent change 0.71% (p=0.732) Table 2.Germ cell tumor incidence rates, 2005-2012
Group Total Male Female Case, n (%) CR ASRa) 95% CI Case, n (%) CR ASRa) 95% CI Case, n (%) CR ASRa) 95% CI Total 654 (100.0) 0.165 0.179 0.166-0.193 504 (100.0) 0.254 0.263 0.240-0.286 150 (100.0) 0.076 0.089 0.075-0.104 Age (yr) 0-14 296 (45.3) 0.434 0.093 0.385-0.484 205 (40.7) 0.576 0.124 0.497-0.654 91 (40.7) 0.280 0.060 0.222-0.337 15-29 308 (47.1) 0.365 0.074 0.324-0.406 261 (51.8) 0.594 0.121 0.522-0.667 47 (51.8) 0.116 0.024 0.083-0.149 ≥ 30 50 (7.6) 0.021 0.012 0.015-0.026 38 (7.5) 0.032 0.019 0.022-0.042 12 (7.5) 0.010 0.006 0.004-0.015 Primary site Pineal (C753) 226 (34.6) 0.057 0.062 0.053-0.070 211 (41.9) 0.106 0.111 0.096-0.126 15 (41.9) 0.008 0.008 0.004-0.012 Nonpineal (C700-729, 751-752) 428 (65.4) 0.108 0.118 0.107-0.129 293 (58.1) 0.148 0.152 0.134-0.170 135 (58.1) 0.068 0.081 0.067-0.095 Suprasellar region (C715, 719, 729, 751) 317 (48.5) 0.080 0.087 0.078-0.097 204 (40.5) 0.103 0.105 0.091-0.120 113 (40.5) 0.057 0.068 0.055-0.081 Ventricle (C715) 43 (6.6) 0.011 0.012 0.008-0.015 35 (6.9) 0.018 0.018 0.012-0.024 8 (6.9) 0.004 0.005 0.002-0.009 Brain, NOS (C719) 229 (35.0) 0.058 0.064 0.056-0.072 145 (28.8) 0.073 0.075 0.063-0.088 84 (28.8) 0.042 0.052 0.040-0.063 Nervous system, NOS (C729) 1 (0.2) 0.000 0.000 0.000-0.001 1 (0.2) 0.001 0.001 –0.001-0.002 0 (0.2) - - - Pituitary gland (C751) 44 (6.7) 0.011 0.011 0.008-0.015 23 (4.6) 0.012 0.011 0.007-0.016 21 (4.6) 0.011 0.011 0.006-0.016 Cerebrum (C710) 62 (9.5) 0.016 0.017 0.013-0.022 53 (10.5) 0.027 0.029 0.021-0.037 9 (10.5) 0.005 0.005 0.002-0.009 All other sites 49 (7.5) 0.012 0.013 0.009-0.017 36 (7.1) 0.018 0.018 0.012-0.024 13 (7.1) 0.007 0.008 0.004-0.012 Histology Germinoma 497 (76.0) 0.125 0.134 0.122-0.146 385 (76.4) 0.194 0.197 0.177-0.217 112 (76.4) 0.057 0.066 0.053-0.078 Nongerminomatous GCT 116 (17.7) 0.029 0.034 0.027-0.040 85 (16.9) 0.043 0.047 0.037-0.057 31 (16.9) 0.016 0.019 0.012-0.026 Nongerminomatous excluding mixed germ cell 26 (4.0) 0.007 0.008 0.005-0.010 20 (4.0) 0.010 0.011 0.006-0.016 6 (4.0) 0.003 0.004 0.001-0.006 Mixed germ cell 90 (13.8) 0.023 0.026 0.021-0.031 65 (12.9) 0.033 0.036 0.027-0.044 25 (12.9) 0.013 0.016 0.010-0.022 Teratoma 41 (6.3) 0.010 0.012 0.008-0.016 34 (6.7) 0.017 0.019 0.013-0.026 7 (6.7) 0.004 0.004 0.001-0.007 Table 3.Germ cell tumor male-female incidence rate ratio, 2005-2012
Primary site Total Male Female Male to female rate ratio (95% CI) Count, n (%) ASRa) Count, n (%) ASRa) Count, n (%) ASRa) Pineal (C753) 226 (34.6) 0.06 211 (42.0) 0.11 15 (10.0) 0.01 13.62 (9.15-20.28) Nonpineal (C700-729, 751-752) 428 (65.4) 0.12 293 (58.1) 0.15 135 (90.0) 0.08 1.87 (1.54-2.28) Suprasellar region (C715, 719, 729, 751) 317 (48.5) 0.09 204 (40.5) 0.11 113 (75.3) 0.07 1.55 (1.23-1.94) Ventricle (C715) 43 (6.6) 0.01 35 (6.9) 0.02 8 (5.3) 0.01 3.52 (1.78-6.97) Brain, NOS (C719) 229 (35.0) 0.06 145 (28.8) 0.08 84 (56.0) 0.05 1.46 (1.12-1.91) Nervous system, NOS (C729) 1 (0.2) 0.00 1 (0.2) 0.00 0 0.00 0.00 (0.00-0.00) Pituitary gland (C751) 44 (6.7) 0.01 23 (4.6)
留言 (0)