
記住我


The prevalence of diabetes mellitus (DM) is increasing worldwide, and it has been reported to be 12.8% in Chinese adults.1 Diabetic retinopathy (DR), which is a common but serious complication of diabetes, is the leading cause of blindness worldwide.2, 3 The prevalence of DR among DM patients has been estimated at 34.6%,2 and the number of DR patients is growing.4 Sight-threatening DR can be avoided when detected early through screening strategies by regular clinical examination or grading of retinal photographs and treated in a timely fashion.5, 6
There are different methods of DR screening in the world, including direct and indirect ophthalmoscopy, digital fundus photography, fundus fluorescein angiography, and other examinations.7, 8 Recently, deep learning algorithms (DLA), a branch of artificial intelligence (AI), has been widely applied in image recognition, speech recognition, and natural language processing.9, 10 For DR detection, DLA have demonstrated excellent sensitivity and specificity, and have been shown to produce expert-level diagnoses for grading fundus photographs.4, 11-16 However, a majority of DLA systems have been validated using online curated or publicly available datasets (EyePACS, Messidor-2, e-ophtha),11, 12, 15 which contained high-quality photographs from individuals.
DR was strongly associated with chronic hyperglycemia, diabetic duration, hypertension, and nephropathy.17 It was reported that the incidence of DR was higher in patients with type 1 diabetes than in those with type 2 diabetes.18 Retinopathy caused by hypertension may interfere with the diagnosis of DR. However, few studies have been conducted on the performance of DLA in different settings. To our knowledge, only Ting et al have reported that their DLA showed comparable performance in different subgroups of patients stratified by age, sex, and glycosylated hemoglobin (HbA1c).13
Therefore, in this study, we conducted a prospective clinic-based DR screening in the real world, using automated DR grading software (an AI-based DLA) to grade more than 2000 retinal photographs of patients with diabetes collected by Shanghai General Hospital. The diagnostic accuracy of the DLA was validated, and the performance of the DLA across different subgroups stratified by types of diabetes, blood pressure (BP), sex, BMI, age, HbA1c, diabetes duration, urine albumin-to-creatinine ratio (UACR), and estimated glomerular filtration rate (eGFR) was evaluated. We also analyzed the reasons for ungradable images and the inconsistency between the DLA and the retinal specialist.
2 METHODS 2.1 Study design, population, and imagingThis study recruited patients with diabetes from the Department of Endocrinology of Shanghai General Hospital between October 2018 and August 2019. Patients who were pregnant at the time or had any history of intraocular surgery other than cataract surgery in the past year were excluded from the study. Ultimately, a total of 1147 patients (2286 eyes) were enrolled.
Clinical data including age, sex, weight, height, BMI, BP, diabetes duration, total cholesterol (TC), high-density lipoprotein (HDL), low-density lipoprotein (LDL), triglycerides (TG), HbA1c, serum creatinine, urine albumin, and urine creatinine were recorded. UACR was calculated using the following formula: UACR = urine albumin/urine creatinine. The eGFR was calculated using the Chronic Kidney Disease Epidemiology Collaboration (CKD-EPI) equation.19
For each patient, macula-centered 45° color fundus photographs of each eye were taken using a retinal fundus camera (KOWA nonmyd WX, Tokyo, Japan). No mydriatic agents were applied. This study was approved by the hospital ethics committee, and all participants signed written informed consent.
2.2 Automated DR grading softwareThe automated DR grading software used in this study (VoxelCloud, China) was developed using deep learning techniques. Two different networks were included in the software: DR classification network and quality control network. The DR classification network, which was the crucial component of the automated DR grading software, was trained on two datasets. The first dataset (Eyepacs dataset) came from an extensive private retinal image database obtained between 2005 and 2015, containing 140 000 fundus photographs of approximately 37 000 patients, which was used to train the initial DR grading model. The images were assigned retinopathy severity levels based on the International Clinical Diabetic Retinopathy Severity (ICDRS) scale,20 which was developed by the International Council of Ophthalmology and adopted by the American Academy of Ophthalmology.21 The second dataset (domestic fundus dataset), obtained from a public hospital in China (not from Shanghai General Hospital, different from the dataset obtained between October 2018 and August 2019), contained approximately 1200 color fundus images, and the DR severity grade was assigned based on the consensus among three retinal specialists. These data were selected to improve the performance of our model in complex situations.
The quality control network was trained on 6400 fundus photographs with different image quality, which was a subset of the first dataset used for training the DR classification network. Architecture and training details of both networks are shown in Supplementary Methods.
All color fundus images were resized to a standard resolution of 800 by 800 pixels and normalized to pixel intensity values between 0 and 1 before being processed by the software.
2.3 Reference standard gradingThe reference standard for DR was generated by one certified retinal specialist with more than 12 years of experience; this specialist assigned the grades based on the ICDRS scale,20 which uses a 5-point grading system: no DR, mild nonproliferative DR (NPDR), moderate NPDR, severe NPDR, and proliferative DR (PDR). The retinal specialist was blinded to the results of the automated DR grading software. Referable DR was defined as moderate NPDR or worse.
All images were graded by both the automated DR grading software and the retinal specialist. Then, the performance of the DLA-based DR grading software was compared to the reference standards. To compare the diagnostic performance of the DLA in different subgroups, we categorized the patients into different subgroups according to type of diabetes (type 1 diabetes, type 2 diabetes), history of hypertension (presence or absence of high blood pressure [HBP]), sex (female, male), BMI (<24 kg/m2, ≥24 kg/m2), age (≤40 years, >40 years and ≤60 years, >60 years), HbA1c (<7% [53 mmol/mol], ≥7% [53 mmol/mol] and <9% [75 mmol/mol], ≥9% [75 mmol/mol]), diabetes duration (<1 year, ≥1 year, ≥5 years, ≥10 years), UACR (<30 mg/g, ≥30 mg/g), and eGFR (≥90 mL/min/1.73m2, <90 mL/min/1.73m2).
2.4 Statistical analysisVariables were expressed as the mean and SD or as the median and interquartile range (25%-75%) as appropriate. One-way analysis of variance or the Kruskal-Wallis test was used to compare differences in continuous variables among DR stages (no DR, mild NPDR, moderate NPDR, severe NPDR, and PDR). The Mann-Kendall test was employed to investigate the trends between DR stages and patients' demographic and clinical characteristics. The sensitivity, specificity, and area under the receiver operating curve (AUC) with 95% CI of the DLA in detecting referable DR were calculated and compared to the reference standard at the level of individual eyes. Analyses were performed in R V.3.6.0 (R Foundation for Statistical Computing, Vienna, Austria).
3 RESULTSThe overall demographics and clinical characteristics of the patients are listed in Table 1. In total, 1147 patients with diabetes were enrolled in this study, including 36 with type 1 diabetes and 1111 with type 2 diabetes. The mean age of the patients was 50 ± 12 years, and 68.4% of the patients were male. The duration of diabetes in the study population was 2.08 (0.08-9.12) years, HbA1c was 8.26 ± 2.07% (66.8 ± 22.6 mmol/mol), BMI was 25.67 ± 3.58 kg/m2, systolic blood pressure (SBP) was 128 ± 16 mm Hg, and diastolic blood pressure (DBP) was 78 ± 10 mm Hg. Of the 1147 patients, 772 (67.3%) had no DR, 143 (12.5%) had mild NPDR, 93 (8.1%) had moderate NPDR, 43 (3.7%) had severe NPDR, 20 (1.7%) had PDR, and 76 (6.6%) were considered ungradable because both eyes had insufficient fundus image quality graded by the retinal specialist per the ICDR grading system. Among the gradable patients, the prevalence of any DR and referable DR were 27.9% and 14.6%, respectively. Age (P < .001), duration of diabetes (P < .001), SBP (P < .001), HbA1c (P = .03), LDL (P = .03), UACR (P < .001), and eGFR (P < .001) were significantly different among the DR stages, while there were no significant differences in BMI, DBP, TC, HDL, or TG among the DR stages (P > .05) (Table 1). The correlations of DR stages with age (Kendall's tau-b = 0.07, P < .001), duration of diabetes (Kendall's tau-b = 0.19, P < .001), SBP (Kendall's tau-b = 0.08, P < .001), DBP (Kendall's tau-b = 0.05, P = .04), HbA1c (Kendall's tau-b = 0.09, P < .001) and UACR (Kendall's tau-b = 0.15, P < .001) were significantly positive, while the correlations of DR stages with TC (Kendall's tau-b = −0.07, P < .001), LDL (Kendall's tau-b = −0.08, P < .001), and eGFR (Kendall's tau-b = −0.09, P < .001) were negative (Table 1).
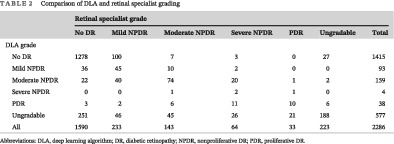
TABLE 1. Demographic and clinical characteristics of patients with diabetes stratified by different DR stages assigned by the retinal specialist Non-referable DR Referable DR No DR Mild NPDR Moderate NPDR Severe NPDR PDR Ungradable ANOVA/Kruskal-Wallis (P value) Kendall's tau-b No. of patients (%) 1147 (100%) 772 (67.3%) 143 (12.5%) 93 (8.1%) 43 (3.7%) 20 (1.7%) 76 (6.6%) - - No. of type 1 diabetes (%) 36 20 (55.5%) 4 (11.1%) 1 (2.8%) 1 (2.8%) 5 (13.9%) 5 (13.9%) - - No. of type 2 diabetes (%) 1111 752 (67.6%) 139 (12.5%) 92 (8.3%) 42 (3.8%) 15 (1.4%) 71 (6.4%) - - Age, mean (SD), y 50 ± 12 49 ± 12 50 ± 11 52 ± 12 56 ± 10 49 ± 9 59 ± 12 <0.001 0.07, P < .001 Men, n (%) 784 (68.4%) 523 103 70 25 14 49 - - BMI (kg/m2) 25.67 ± 3.58 25.69 ± 3.60 25.87 ± 3.50 25.20 ± 3.84 25.33 ± 3.14 24.80 ± 3.05 26.00 ± 3.62 0.46 −0.02, P = .38 Diabetes duration, median (IQR), y 2.08 (0.08-9.12) 1.17 (0.00-6.10) 3.00 (0.25-10.17) 8.17 (1.00-13.42) 10.17 (2.21-15.75) 9.79 (0.42-14.42) 7.17 (1.35-15.17) <0.001 0.19, P < .001 SBP (mm Hg) 128 ± 16 127 ± 15 130 ± 18 131 ± 17 134 ± 19 133 ± 20 133 ± 18 <0.001 0.08, P < .001 DBP (mm Hg) 78 ± 10 77 ± 10 80 ± 11 78 ± 10 79 ± 12 78 ± 12 75 ± 10 0.11 0.05, P = .04 HbA1c (%) 8.26 ± 2.07 8.18 ± 2.12 8.48 ± 2.08 8.46 ± 1.80 9.09 ± 2.03 8.46 ± 1.93 7.91 ± 1.75 0.03 0.09, P < .001 HbA1c (mmol/mol) 66.8 ± 22.6 65.9 ± 23.2 69.2 ± 22.7 69.0 ± 19.7 75.8 ± 22.2 69.0 ± 21.1 62.9 ± 19.1 0.03 0.09, P < .001 TC (mmol/L) 4.83 ± 1.29 4.91 ± 1.26 4.70 ± 1.10 4.67 ± 1.22 4.65 ± 1.23 4.47 ± 1.40 4.67 ± 1.89 0.08 −0.07, P < .001 HDL (mmol/L) 1.01 ± 0.28 1.01 ± 0.26 1.00 ± 0.29 1.04 ± 0.35 1.03 ± 0.32 1.03 ± 0.39 1.04 ± 0.32 0.87 −0.02, P = .36 LDL (mmol/L) 2.68 ± 0.92 2.75 ± 0.91 2.66 ± 0.93 2.53 ± 1.00 2.47 ± 0.75 2.40 ± 1.16 2.38 ± 0.86 0.03 −0.08, P < .001 TG (mmol/L) 2.15 ± 2.82 2.18 ± 2.71 2.08 ± 2.77 2.02 ± 1.76 1.88 ± 1.73 1.51 ± 0.88 2.41 ± 5.15 0.73 −0.04, P = .07 UACR (mg/g) 71.4 ± 327.6 44.8 ± 167.5 54.5 ± 161.1 75.0 ± 207.6 216.9 ± 484.6 439.1 ± 1455.6 186.1 ± 702.4 <0.001 0.15, P < .001 eGFR (mL/min/1.73m2) 113.0 ± 19.2 115.3 ± 17.0 114.2 ± 19.3 108.7 ± 21.9 99.0 ± 23.8 108.8 ± 26.3 100.5 ± 23.4 <0.001 −0.09, P < .001 Note: Data are presented as the mean ± SD or median (IQR) as appropriate. Ungradable: insufficient image quality. Abbreviations: ANOVA, analysis of variance; DBP, diastolic blood pressure; DR, diabetic retinopathy; eGFR, estimated glomerular filtration rate; HbA1c, glycosylated hemoglobin; HDL, high-density lipoprotein; IQR, interquartile range; LDL, low-density lipoprotein; NPDR, nonproliferative DR; PDR, proliferative DR; SBP, systolic blood pressure; TC, total cholesterol; TG, triglycerides; UACR, urine albumin-to-creatinine ratio.The final analysis included 2286 images from 1147 patients. Eight patients had only one eye. The distributions of the grades assigned by the retinal specialist and the DLA were compared, and the weighted kappa score was 0.771 (95% CI, 0.7288-0.8131). Of the 2286 images, 223 (9.8%) could not be graded by the retinal specialist because of insufficient image quality. Of the 2063 images with sufficient quality, 1823 (88.4%) showed no or mild DR, and 240 (11.6%) showed referable DR, as graded by the retinal specialist. The DLA classified 577 (25.2%) images as ungradable due to insufficient quality. Of the 1674 images with sufficient quality for both the reference standard and the DLA, 1481 (88.5%) showed no or mild DR, and 193 (11.5%) showed referable DR, as graded by the DLA (Table 2).
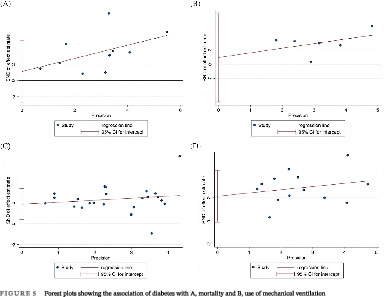
TABLE 2. Comparison of DLA and retinal specialist grading Retinal specialist grade No DR Mild NPDR Moderate NPDR Severe NPDR PDR Ungradable Total DLA grade No DR 1278 100 7 3 0 27 1415 Mild NPDR 36 45 10 2 0 0 93 Moderate NPDR 22 40 74 20 1 2 159 Severe NPDR 0 0 1 2 1 0 4 PDR 3 2 6 11 10 6 38 Ungradable 251 46 45 26 21 188 577 All 1590 233 143 64 33 223 2286 Abbreviations: DLA, deep learning algorithm; DR, diabetic retinopathy; NPDR, nonproliferative DR; PDR, proliferative DR.The performance of the DLA in detecting referable DR is shown in Table 3. For all gradable images, the DLA achieved an AUC of 0.942 (95% CI, 0.920-0.964), a sensitivity of 85.1% (95% CI, 83.4%-86.8%), and a specificity of 95.6% (95% CI, 94.6%-96.6%). The DLA showed consistent performance across different subgroups of patients stratified by history of HBP, sex, BMI, age, HbA1c, and diabetes duration. However, it showed superior performance in the subgroups with type 1 diabetes (AUC 0.996 and 95% CI, 0.988-1.000 for type 1 diabetes vs 0.938, 95% CI, 0.915-0.962 for type 2 diabetes), UACR ≥ 30 mg/g (AUC 0.945, 95% CI, 0.944-0.946 for UACR ≥ 30 mg/g vs 0.931, 95% CI, 0.930-0.932 for UACR < 30 mg/g), or eGFR < 90 mL/min/1.73m2 (AUC 0.971, 95% CI, 0.970-0.972 for eGFR < 90 mL/min/1.73m2 vs 0.941, 95% CI, 0.940-0.942 for eGFR ≥ 90 mL/min/1.73m2) (Table 3, Figure S1).
TABLE 3. Area under the receiver operating curve (AUC), sensitivity, and specificity of the DLA in detecting referable DR with reference to a retinal specialist's grading Referable diabetic retinopathy No. of eyes AUC Sensitivity, % (95% CI) Specificity, % (95% CI) ALL 1674 0.942 (0.920-0.964) 85.1 (83.4-86.8) 95.6 (94.6-96.6) Type of diabetes Type 1 diabetes 53 0.996 (0.988-1.000) 100.0 (100.0-100.0) 97.7 (93.7-100.0) Type 2 diabetes 1621 0.938 (0.915-0.962) 84.2 (82.4-85.9) 95.0 (94.5-96.6) HBP history No history of HBP 1114 0.940 (0.910-0.970) 84.4 (82.3-86.6) 96.5 (95.4-97.6) HBP 560 0.943 (0.911-0.975) 86.2 (83.4-89.1) 93.8 (91.8-95.8) Sex Female 503 0.924 (0.897-0.977) 84.2 (81.0-87.4) 96.1 (94.4-97.8) Male 1171 0.948 (0.924-0.971) 85.5 (83.4-87.5) 95.4 (94.2-96.6) BMI (kg/m2) BMI <24 515 0.937 (0.901-0.973) 81.0 (77.6-84.4) 94.7 (92.8-96.7) BMI ≥24 1159 0.944 (0.916-0.972) 87.8 (85.9-89.7) 96.0 (94.8-97.1) Age (y) Age ≤ 40 515 0.949 (0.907-0.992) 80.0 (76.5-83.5) 96.9 (95.4-98.4) 40<Age ≤ 60 896 0.943 (0.914-0.972) 90.1 (88.2-92.1) 94.7 (93.3-96.2) Age>60 263 0.930 (0.876-0.984) 78.1 (73.1-83.1) 96.1 (93.8-98.4) HbA1c, % (mmol/mol) HbA1c<7 (53) 526 0.967 (0.931-1.000) 82.9 (79.5-86.0) 97.8 (96.5-99.0) 7 (53) ≤ HbA1c<9 (75) 574 0.939 (0.902-0.975) 87.3 (84.6-90.0) 95.3 (93.6-97.0) HbA1c ≥9 (75) 539 0.934 (0.898-0.969) 85.2 (82.2-88.2) 93.4 (91.3-95.5) Diabetes duration (y) Diabetes duration<1 705 0.960 (0.923-0.997) 87.2 (84.7-89.6) 97.0 (95.7-98.3) Diabetes duration ≥1 969 0.931 (0.904-0.959) 84.4 (82.1-86.7) 94.5 (93.1-96.0) Diabetes duration ≥5 558 0.918 (0.885-0.952) 84.9 (81.9-87.9) 92.6 (90.4-94.8) Diabetes duration ≥10 299 0.910 (0.867-0.953) 85.7 (81.7-89.7) 91.9 (88.9-95.0) UACR (mg/g) UACR<30 1129 0.931 (0.930-0.932) 82.5 (80.3-84.7) 95.8 (94.6-97.0) UACR≥30 356 0.945 (0.944-0.946) 85.7 (82.1-89.3) 94.7 (92.3-97.0) eGFR (mL/min/1.73m2) eGFR ≥90 1553 0.941 (0.940-0.942) 85.5 (83.7-87.2) 95.6 (94.5-96.6) eGFR<90 86 0.971 (0.970-0.972) 84.6 (77.0-92.2) 94.5 (89.7-99.3) Abbreviations: AUC, area under the receiver operating curve; DLA, deep learning algorithm; DR, diabetic retinopathy; eGFR, estimated glomerular filtration rate; HbA1c, glycosylated hemoglobin; HBP, high blood pressure; UACR, urine albumin-to-creatinine ratio.Of the 2286 images, 389 images could not be graded by the DLA because of their insufficient quality but could be graded by the retinal specialist. A review of those 389 images indicated that most of them (n = 364 [93.6%]) had grayish-green gradual translucent ring artifacts, which may be caused by light leakage due to improper distance between the eyes and the camera. Some images (n = 66 [17.0%]) had glare artifacts, which could also be seen in some images with ring artifacts. A few images had the defect of improper exposure (n = 3 [0.8%]) or poor focus/optical path occlusion (eyelashes, eyelids, etc.) (n = 19 [4.9%]). There were 35 images that could be graded by the DLA but not by the retinal specialist. The most common features of these images were ring artifacts (n = 11 [31.4%]) and improper exposure (n = 23 [65.7%]). Of the 2286 images, 188 images (8.4%) could not be graded by the DLA or the retinal specialist. More than 80% (n = 156 [83.0%]) of those 188 images had ring artifacts (Table 4). Examples of typical images with insufficient quality can be found in Figure S2.
TABLE 4. Features of ungradable images Features Gradable by retinal specialist/ungradable by DLA (n = 389) Gradable by DLA/ungradable by retinal specialist (n = 35) Ungradable by retinal specialist and DLA (n = 188) Ring artifact (improper distance between the eyes and the camera) 364 11 156 Glare artifact (reflection of optical lens 66 4 83 Improper exposure) 3 23 21 Poor focus or occlusion of optical path 19 0 35 Abbreviations: DLA, deep learning algorithm.The DLA gave 67 false positives and 22 false negatives for referable DR. We then analyzed the reasons for inconsistency between the DLA and the retinal specialist, which are presented in Table 5. The most common reasons for false-positive classification were the misdiagnosis of retinal microaneurysm as intraretinal hemorrhage (n = 25 [37.3%]) and the misidentification of arteriovenous crossing (n = 19 [28.4%]) as venous beading. The other reasons included retinal vessel occlusion (n = 2 [3.0%]), age-related macular degeneration (n = 4 [6.0%]), macular holes (n = 1 [1.5%]), congenital vascular malformation (n = 1 [1.5%]), and congenital optic papillary malformation (n = 1 [1.5%]), all of which were misclassified as referable DR. However, approximately 20.9% of false-positive images had no abnormal ocular findings, including some images in which normal retinal microvessels were misidentified as intraretinal microvascular abnormalities (IRMA) (n = 2 [3.0%]) and some images in which a glare and/or stains on a normal fundus were misidentified as exudates (n = 12 [17.9%]). An analysis of false-negative cases (n = 22) revealed that more than half of the images displayed linear intraretinal hemorrhage mistaken for blood vessels (n = 13 [59.1%]), and seven images (31.8%) had been misclassified for unknown reasons. The remaining reasons included omission of IRMA (n = 1 [4.5%]) and venous beading (n = 1 [4.5%]). Examples of typical false-negative and false-positive images can be found in Figures S3 and S4.
TABLE 5. Features of false positives and false negatives in the identification of referable diabetic retinopathy by the DLA Reason No. Proportion (%) False positives 67 100 Retinal microaneurysm misdiagnosed as intraretinal hemorrhage 25 37.3 Arteriovenous
留言 (0)