
記住我

Methanol is mainly used as a solvent in industry. It is not a toxic substance, per se. In fact, detrimental effects of methanol are exerted through its conversion into formaldehyde and formic acid.1 Signs and symptoms of methanol poisoning include headache, vertigo, altered visual acuity, nausea, vomiting, loss of consciousness, coma, and death. It can also cause necrosis of the ophthalmic nerve, leading to permanent visual sequelae as well as neurological damage.1, 2 The most common route of methanol poisoning is drinking adulterated alcoholic beverages supplied by illegal producers. However, there are also reports of methanol poisoning due to accidental or occupational exposure.3, 4
Alcohol consumption is prohibited in Iran due to religious restrictions. Methanol poisoning outbreaks happen occasionally in this country, but they tend to occur more frequently and on a larger scale when different crises make access to alcohol even more difficult.5 In Iran, an outbreak of methanol poisoning was triggered by the coronavirus disease (COVID-19) pandemic in early March 2020 (Fig. 1).5 People believed that drinking alcohol would prevent this infection.6 The outbreak was found to be so huge when it was announced that the death toll due to methanol poisoning surpassed the deaths due to COVID-19 in Khuzestan (a province of Iran).7

New weekly COVID-19 cases (per million inhabitants) in Iran (population 83,076,000), March–June 2020.
In the current study, we aimed to determine the course and outcome of methanol-poisoned patients who were also infected with severe acute respiratory syndrome corona virus 2
(SARS-CoV-2). As a second aim, we compared alcohol-intoxicated patients with and without COVID-19 to determine the possible risk factors that could help considering this diagnosis in our patients. Brain and chest computed tomography (CT) scan findings of the patients were also evaluated and reported accordingly.
METHODS Study design and settingThis study was retrospectively undertaken between March and June 2020. The data were gathered from patients admitted to two toxicology referral centers in Iran, Loghman Hakim Hospital in Tehran and Alzahra Hospital in Isfahan.
Patient selectionAll patients who had been diagnosed with methanol poisoning and had undergone brain or chest CT scanning due to loss of consciousness or respiratory manifestations were enrolled. Diagnosis of methanol poisoning was made by patients’ history, detection of acidosis in venous blood gas analysis, and high methanol level (where available). Due to the COVID-19 pandemic, all admitted patients were initially screened to rule in/out COVID-19 based on: (i) history of significant and high-risk exposure to a patient with confirmed or suspected COVID-19 during the 3 weeks prior to admission, and/or (ii) at least one of the following manifestations: radiation contactless body temperature of 37.8°C or higher, respiratory rate of 24 breaths/min or more, cough, shortness of breath, nasal congestion/ discharge, myalgia/arthralgia, diarrhea/vomiting, headache, or fatigue on admission.
Inclusion criteriaThe patients with one or both of the above-mentioned findings were further evaluated to confirm COVID-19 disease using reverse transcription–polymerase chain reaction (PCR) (W-RR-0479-02; Liferiver Bio-Tech, Shanghai, China) for E, N, and Rdrp genes on nasopharyngeal specimen and/or chest CT scan looking for the typical findings of COVID-19 pneumonitis. An infectious disease specialist made the diagnosis of concomitant COVID-19 in the methanol-poisoned patients.
According to the Radiological Society of North America consensus statement, the typical chest CT scan findings for diagnosis of COVID-19 disease were: (i) peripheral bilateral ground glass opacities and/or consolidation or crazy paving, (ii) multifocal ground glass opacities of rounded morphology and/or consolidation or crazy paving pattern, (iii) reverse halo sign or other findings of organizing pneumonia.8
The radiologist reported COVID-19 pneumonitis to be positive or negative based on the previous reports on typical CT findings.
Data collectionData was collected using a questionnaire and by evaluation of the patients’ electronic records, laboratory data, and radiologic work-up. The data collected included demographic characteristics (age, sex, intention for alcohol consumption, history of regular alcohol consumption, and history of comorbidities), time and amount of alcohol consumption, time elapsed between alcohol ingestion and hospital presentation/admission, Glasgow Coma Scale (GCS) on admission, signs and symptoms and selected laboratory test results on presentation, need for and time of initiation of ethanol, time and number of sessions of hemodialysis, chest and brain CT scan findings, concurrent COVID-19 and method of its diagnosis (PCR or chest CT scan), duration of hospital stay, and final outcome (death vs. recovery).
Statistical analysisThe data were then analyzed using SPSS software (IBM Corp. Released 2016. IBM SPSS Statistics for Windows, Version 24.0. Armonk, NY) by application of the Kolmogorov–Smirnov test, χ2-test, Mann–Whitney U-test, and t-test. Kolmogorov–Smirnov was used to evaluate the distribution pattern of the variables. Data with normal distribution are shown using mean ± standard deviation, and nonparametric variables are shown as median and interquartile range. The χ2-test was used to find significant differences among qualitative variables. To find significant differences among quantitative and nonparametric variables with normal distribution, the t-test and Mann–Whitney U-test were used, respectively. Significant findings were defined by p-values of 0.05 and less.
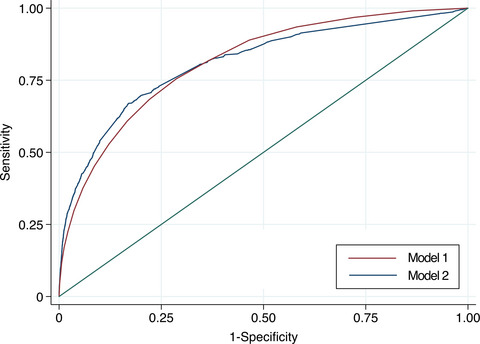
For the quantitative variables with significant differences, the receiver operating characteristic curve test was applied to find the best simultaneous sensitivity and specificity.
Ethical approval and consent to participateNeed for informed consent was waived by our local ethics committee due to the retrospective nature of the study. This study was approved by our local ethics committee in Shahid Beheshti University of Medical Sciences (reference code: IR.SBMU.RETECH.REC.1398.872). All study procedures were carried out in accordance with relevant guidelines and regulations. The study was undertaken in accordance with the Basic and Clinical Pharmacology and Toxicology policy for experimental and clinical studies.9
RESULTSA total of 62 patients with confirmed methanol poisoning were enrolled into the study (Fig. 2), of whom 49 (79%) were men. The median (interquartile range) age was 35 (28, 45) years (range, 17–70 years). Thirty-nine (62.9%) patients survived and 23 (37.1%) died. The median duration of hospitalization was 3 (2, 7) days.

Selection algorithm of 62 cases of methanol poisoning at two toxicology centers in Iran. CT, computed tomography.
Sixty patients (96.8%) had ingested alcoholic liquids and two (3.2%) had consumed alcoholic sanitizers. Three (4.8%) mentioned that they had consumed alcohol to disinfect themselves, of whom one survived. The intent of drinking was not clarified in 33 cases (53.2%). The other 26 cases (41.9%) had drunk alcohol for recreational purposes. Of the patients, 27 (65.9%) had a positive history of regular alcohol consumption and 14 (34.1%) had no history; the remainder had not provided data in this regard. Of the patients who survived, 18 (69.6%) had a history of regular alcohol consumption and seven (30.4%) had no history (p = 0.571); data were insufficient in 21 cases. Of three patients who had ingested alcohol to disinfect against COVID-19, one had history of regular alcohol use (p = 0.209).
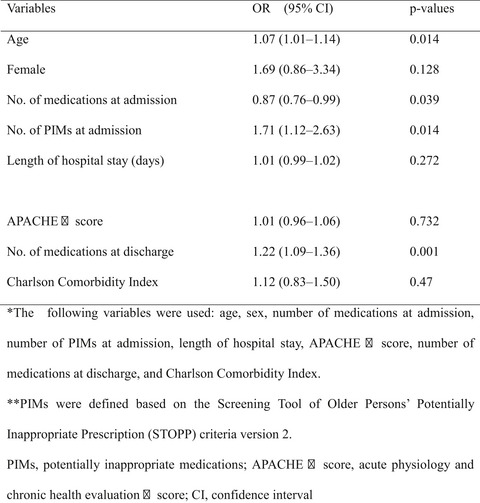
In our series, nine (14.5%) patients were diagnosed with SARS-CoV-2 infection. Diagnosis of infection were made by spiral chest CT scan in seven (77.8%) patients and by PCR in two (22.2%). Among infected patients, four survived and five died; however, there was no significant difference in mortality rates between SARS-CoV-2-infected and noninfected patients (p = 0.272). Seven of nine (77.8%) SARS-CoV-2-infected patients had positive history of regular alcohol consumption. This history was positive in 20 of 53 (37.7%) noninfected cases. There was a significant correlation between COVID-19 and history of alcohol consumption (p = 0.036; odds ratio 1.7; 95% confidence interval, 1.28-2.25). Univariate analysis showed significant differences between infected and noninfected patients regarding their urea level and time for first and second hemodialysis sessions, as well as the duration of ethanol administration as an antidote (Table 1).
Table 1. Variables with significant group difference in methanol-poisoned patients (COVID-19-infected vs. noninfected cases) p-valuea Odds ratio 95% confidence interval Comorbidities 0.024 8.500 1.500 50.000 History of alcohol consumption 0.036 0.741 0.593 0.926 Abnormal chest CT scan <0.001 4.300 2.500 7.200 Urea (<40 mg/dL) 0.004 0.050 0.010 0.480 Delay in first dialysis (<13.5 h) <0.001 0.013 0.001 0.179 Delay in second dialysis (>20.5 h) 0.001 6.300 2.200 17.900 Duration of taking maintenance ethanol (>17 h) 0.007 3.500 1.800 6.900 Abbreviation: CT, computed tomography. a Fisher’s exact test.Chest CT scan was carried out in 56 patients with 36 (69.2%) having normal chest CT findings and 20 (30.8%) with abnormal findings. In nine cases (16.1%), changes were due to COVID-19 infection. Of those with COVID-19 chest CT findings, four survived (P = 0.256). Prevalence of each of the radiologic findings of chest CT scan is provided in Table 2.
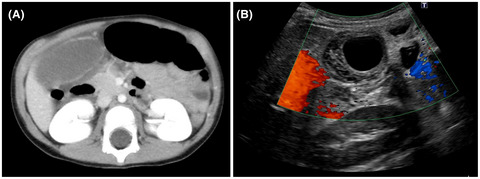
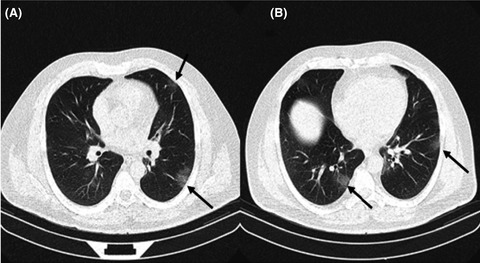
Table 2. Chest computed tomography results in methanol-poisoned patients in Iran with and without COVID-19 infection Radiologic pattern/frequency COVID-19 patients (n = 9) Non-COVID-19 patients (n = 47) p-value OR (95% CI) Ground glass opacity 9 (100.0) 2 (4.1) <0.001 23.50 (6.10, 91.20) Crazy paving 0 (0.0) 0 (0.0) – – Consolidation 4 (44.4) 7 (14.9) 0.063 – Reticulation 0 (0.0) 0 (0.0) – – Nodular infiltration 1 (11.1) 1 (2.0) 0.298 – Reverse halo 0 (0.0) 0 (0.0) – – Lymphadenopathy 0 (0.0) 0 (0.0) – – Pleural effusion 0 (0.0) 1 (2.0) 0.999 – Peripheral/subpleural 6 (66.7) 1 (2.0) <0.001 0.01 (0.01, 0.12) Central/peribronchovascular 2 (22.2) 0 (0.0) 0.023 0.78 (0.55, 1.10) Unilateral left 0 (0.0) 0 (0.0) – – Unilateral right 1 (11.1) 1 (2.0) 0.289 – Bilateral 6 (66.7) 9 (19.1) 0.008 0.12 (0.02, 0.57) Note Data are shown as n (%). Abbreviations: –, not applicable; CI, confidence interval; OR, odds ratio.Figure 3 depicts chest CT scans of a patient with bilateral peripheral ground glass infiltrations.

Chest computed tomography scan of a patient with COVID-19 infection and methanol poisoning. Two axial sections (A, B) depict bilateral peripheral ground glass opacities (black arrows).
Brain CT scan was undertaken in 38 (61.2%) patients, of whom 30 (78.9%) had abnormal findings.
Prevalence of each radiologic finding of brain CT scan is shown in Table 3. Five of nine infected patients had undergone brain CT scan and only one had normal CT.
Table 3. Brain computed tomography results in methanol-poisoned patients in Iran Involvement Unilateral Bilateral None Putaminal hypodensity 1 (2.6) 23 (60.5) 14 (36.8) Putaminal hemorrhage 2 (5.3) 10 (26.3) 26 (68.4) Subcortical WM hypodensity 0 (0.0) 15 (39.5) 23 (60.5) ICH 2 (5.3) 2 (5.3) 34 (89.4) IVH 4 (10.5); 1 (2.6) lateral ventricle; 1 (2.6) 4th ventricle; 2 (5.3) with hemorrhage in all brain ventricles 34 (89.5) Diffuse cerebral edema 12 (31.6) 26 (68.4) Cerebellar hypodensity 0 (0.0) 1 (2.6) 37 (97.4) Note Data are shown as n (%). Abbreviations: ICH, intracranial hemorrhage; IVH, intraventricular hemorrhage; WM, white matter.There were no significant differences between patients with or without COVID-19 regarding the presence of abnormal brain CT findings (p = 0.999). Patients’ selected laboratory data is shown in Table 4.
Table 4. Laboratory test results in methanol-poisoned patients in Iran with and without COVID-19 infection COVID 19-infected patients (n = 9) Noninfected patients (n = 53) p-value Survivors (n = 39)Nonsurvivors
(n = 23)
p-valueTotal
(n = 62)
(SD of mean)
(min–max)
10.4
4.2–16.7
6.0–14.9
21.1
11.8–31.2
8.0–54.7
0.13919.3
12.4–26.2
10.9–33.9
22.3
8.8–35.9
6–54.7
0.40220.4
10.6–30.2
6.0–54.7
IQR
(min–max)
1.5
1.3–1.9
1.2–28
1.4
1.2–1.7
1-2.5
0.2511.3
1.1–1.5
1–28
1.6
1.4–1.9
1.1–2.5
0.0041.4
1.2–1.7
1–28
IQR
(min–max)
45.5
37.2–89.2
23–108
27
22–36
4.4–77
0.01328
21–38
4–108
31.5
22.2–46.2
16–77
0.42329
22–42
4.4-108
pH
IQR
(min–max)
7.08
7.05–7.12
6.72–7.33
7.10
6.83–7.19
6.56–7.60
0.9567.14
7.04–7.29
6.61–7.60
6.9
6.72–7.09
6.56–7.13
0.0007.09
6.8–7.19
6.56–7.60
pCo2a (mmHg)
IQR
(min–max)
26
17.4–33.0
14.1–58.4
26.4
18.2–36.1
6.3–112.2
0.86826.2
18.2–34.3
6.3–51
29
16.7–45
11.8–112.2
0.60026.4
18–34.9
6.3–112.2
HCO3a (mEq/L)
IQR
(min–max)
9.3
8–13.25
6.5–14
8.8
5.8–13.4
3.5–29
0.60310.4
7.9–14.2
4.5–-29
6.5
4.9–8.8
3.5–25.5
0.0018.8
6–13.4
3.5–29
Base D/Ea (mEq/L)
IQR
(min–max)
−20.550
−25.1–9.2
−20.6–17
−22
−28.8–9.6
−35.7–32.7
0.873−18
−23.6–4.5
−33.7–32.7
−27
−30.5−22.2
−35.7–17
0.012−22
−28.3–13.0
−35.7–32.7
Nab (mEq/L)
(SD of mean)
(min–max)
138.6
133.0–143.1
134–147
139.4
135.5–143.3
130–150
0.623138.3
134.5–142.0
130–147
140.5
136.6–144.4
134–150
0.044139.3
135.3–143.2
130–150
Kb (mEq/L)
(SD of mean)
(min–max)
4.6
3.5–5.7
2.6–5.7
4.6
3.8−5.5
3.2–6.9
0.9954.6
3.7–5.4
3.3–6.9
4.8
3.9–5.7
2.6–6.9
0.2444.6
3.8–5.5
2.6–6.9
Glucoseb (mg/dL)
(SD of mean)
(min–max)
184.6
142.0–227.2
118–243
185.4
87.8−283.1
66−464
0.982177.4
79.5–275.4
66-416
199.6
116.1–283.2
95–464
0.415185.3
93.8–279.1
66–464
Abbreviations: IQR, interquartile range; min, minimum; max, maximum; SD, standard deviation. a Subject to missing data. b Mean. c Median.Variables with significant difference between survivors and nonsurvivors in univariate analysis are shown in Table 5.
Table 5. Variables with significant group difference (survivors vs. nonsurvivors) among methanol-poisoned patients in Iran p-value Odds ratio 95% confidence interval Lower Upper Need for second dialysis 0.030 3.611 1.109 11.763 Receiving loading ethanol 0.007 0.488 0.360 0.663 Receiving maintenance ethanol 0.007 0.488 0.360 0.663 GCS (<12/15) 0.000 10.900 2.600 45.600 Blood pressure (<120 mmHg) 0.019 4.000 1.200 13.400 Creatinine (>1.45 mg/dL) 0.004 5.600 1.700 18.600 pH (<7.08) 0.001 7.400 2.200 24.000 HCO3 (<8.9 mEq/L) <0.001 10.800 3.000 39.200 Base deficit/excess (<−22.150) 0.002 11.300 2.300 54.500 Duration of hospitalization (>3 days) 0.003 8.700 2.000 37.800 Diffuse cerebral edema on brain CT 0.003 16.000 1.797 142.438 CT, computed tomography; GCS, Glasgow Coma Scale. DISCUSSIONLack of education on ethanol consumption was highlighted in Iran when a rumor spread in the public and hit our health system. Some people believed that alcohol consumption could disinfect them against COVID-19. In a market providing the goods only illegally, producing adulterated or in the best scenario, low-quality beverages, is quite possible. This caused a huge outbreak of methanol poisoning in the country along with the COVID-19 epidemic.6 There were people who drank sanitizers and even pure methanol to disinfect themselves. Three patients in our series had consumed alcohol for this purpose. Additionally, the mortality rate among patients who had a history of alcohol consumption was approximately 41% versus 50% in patients without a background of alcohol consumption. It can be imagined that this difference is due to the use of alcohol from a market inundated with low-quality and adulterated alcoholic beverages because of the increase in the demand for alcohol-based disinfectants. Also, it can be assumed that these patients had drunk even more detrimental beverages, including sanitizers, to reach the abovementioned goal.
Seven patients in the SARS-CoV-2-infected group had positive history of alcohol consumption. For a person who regularly drinks alcohol in a society where alcohol use is prohibited, the alcoholic drinks are usually supplied by someone who is supposed to be a constant reliable seller.
However, adverse changes in the market due to the COVID-19 pandemic had resulted in difficulties accessing alcohol even among these drinkers with reliable sources of alcohol provision. Unfortunately, not only had alcohol consumption failed to achieve the desired effect of disinfecting these patients against COVID-19 infection, but also it likely increased their vulnerability for COVID-19 pneumonitis. This group of patients had experienced a vicious cycle of outcomes, acquiring the severe form of the infection leading to hospitalization, with five out of nine deaths.
In our cases, drinking history, elevated urea level, presence of comorbidities (see Table 1), delay in both first and second dialysis sessions, and increased time of need for maintenance ethanol therapy was more prevalent in SARS-CoV-2-infected patients.
Urea has been recognized as a prognostic factor for mortality due to pneumonia.10,
留言 (0)