
記住我


Although survival rates have improved, oesophageal cancer is still an important cause of cancer-related deaths worldwide1. Oesophageal adenocarcinoma is an aggressive disease and most patients have locally advanced or metastatic disease at presentation2. Despite advances in staging and oncological therapies, long-term outcomes after surgical treatment for oesophageal cancer remain relatively poor3.
Over the past decade, UK practice has been influenced by a number of large clinical trials4-8 that have demonstrated a significant survival benefit for patients treated with neoadjuvant therapy compared with surgery alone. The MAGIC4 and FLOT (5-fluorouracil (5-FU), leucovorin, oxaliplatin and docetaxel)8 trials both demonstrated a benefit for perioperative chemotherapy, but the specific gains afforded by adjuvant treatment remain unknown. In addition, only 50 per cent of patients scheduled for postoperative treatment completed chemotherapy, largely owing to the accumulation of acquired therapeutic toxicities4.
According to the National Oesophago-Gastric Cancer Audit, most patients in the UK are offered neoadjuvant chemotherapy, rather than neoadjuvant chemoradiotherapy, although trials9, 10 comparing the two strategies are in progress. In patients with a microscopically positive resection margin (R1 resection), which occurs in 28–40 per cent of patients11, 12 when the Royal College of Pathologists (RCP) definition is used, survival is worse13, 14. Adjuvant chemoradiotherapy is generally recommended in this group, provided that the patient is fit enough to withstand treatment15. However, prospective clinical trials are required to establish the benefit of adjuvant treatments in the context of neoadjuvant chemotherapy and for their role in current treatment protocols to be confirmed.
The aim of this study was to assess the survival benefit of current adjuvant treatments in patients who had margin-positive resection treated in two high-volume tertiary referral centres in the UK.
MethodsThis was a retrospective cohort study of patients with oesophageal and gastro-oesophageal junctional adenocarcinoma using an ethically approved, collaborative database, from two UK-based institutions: St Thomas' Hospital and the Royal Marsden Hospital in London. Both are high-volume tertiary referral centres which provide specialist surgical and oncological care. The database combined two prospectively maintained, hospital-based operative registries of all patients undergoing oesophagogastrectomy for cancer.
Study cohortAll patients who underwent surgical resection for oesophageal adenocarcinoma between January 2006 and December 2016 were identified from the collaborative database. All included patients had at least 12 months of complete follow-up data. Patients who died in hospital or within 30 days of surgery were excluded. All patients were discussed in a specialist oesophagogastric cancer multidisciplinary team (MDT) meeting. Standard staging investigations included endoscopy, CT, endoscopic ultrasound imaging, PET–CT and staging laparoscopy in selected patients. Transthoracic and transhiatal oesophageal resections were performed, dictated by tumour location, at the discretion of the individual surgeon. All resection specimens were examined by specialist gastrointestinal pathologists and the status of the resection margin was classified according to RCP criteria16; an R0 resection was defined by no involvement of any margin, and an R1 resection by tumour within 1 mm of the cut margin. All patients with positive margins (R1 resection) were included in the present analysis. Some patients were also assessed using the College of American Pathologists (CAP) R1 definition of tumour at the cut resection margin17. All patients were allocated a tumour regression grade (TRG) according to the Mandard classification18. Patients with a TRG of 1–3 were considered to have had a response to neoadjuvant chemotherapy (responders) and those with a TRG of 4 and 5 were considered not to have responded (non-responders).
TreatmentThe neoadjuvant chemotherapy regimens included CF (cisplatin and 5-FU), ECF (epirubicin, cisplatin, 5-FU), ECX (epirubicin, cisplatin and capecitabine) and EOX (epirubicin, oxaliplatin and capecitabine), and most patients completed the standard two to four cycles, in accordance with randomized trial evidence available at the time of treatment. Patients with positive margins (R1 resection) were subcategorized by adjuvant treatment group: adjuvant chemoradiotherapy, adjuvant chemotherapy alone or no adjuvant treatment. Tumour stage, response to neoadjuvant treatment, tolerance of chemotherapy and patient fitness were taken into account by the MDT. The adjuvant chemotherapy regimens included CF, ECF, ECX and EOX, and most patients completed three or fewer cycles. Radiotherapy in combination with chemotherapy was given as 45 Gy in 25 fractions or 50 Gy in 28 fractions.
Outcome measuresOverall survival time was the interval from the date of surgical resection until the date of death. Time to recurrence was calculated from the date of surgical resection until disease recurrence, defined as either histopathological or definitive radiological evidence of local recurrence, systemic recurrence or both. Recurrence patterns were assessed as a secondary outcome. In the absence of recurrence, survival was calculated to the last confirmed attendance at a hospital or general practitioner clinic.
Statistical analysisBasic demographic, surgical and oncological data were evaluated using descriptive statistics. The Kaplan–Meier method with log rank test was used to calculate and compare survival. Cox proportional hazards regression analysis (crude and adjusted) was used to calculate hazard ratios (HRs) with 95 per cent confidence intervals to model the association between the study outcomes (risk of all-cause mortality and risk of recurrence) according to the study exposure (adjuvant treatment). Co-variables included in the multivariable models were: age (continuous), sex, tumour location (oesophageal, Siewert 1, Siewert 2), pathological T category (pT0–2, pT3–4), pathological N category (pN0, pN1, pN2, pN3), lymphovascular invasion, postoperative differentiation (well/moderate, poor), operative approach (Ivor Lewis oesophagectomy, transhiatal oesophagectomy, left thoracoabdominal oesophagectomy) and response to neoadjuvant chemotherapy (TRG 1–3, TRG 4 and 5). To explore whether the effects of adjuvant therapy differed according to response to neoadjuvant chemotherapy, separate analyses were undertaken for responders and non-responders. Cox regression analyses comparing overall survival and recurrence-free survival, according to different adjuvant therapies, were also conducted using data from propensity score-matched cohorts. Propensity scores for receipt of adjuvant therapies were derived using logit models based on the same variables as the Cox regression models (Table S1, supporting information). Matching was done using the psmatch2 module in Stata, with a caliper of 0·1 and non-replacement. P < 0·050 was used to define statistical significance for all outcomes. All statistical analysis was performed using Stata version 15 (StataCorp, College Station, Texas, USA).
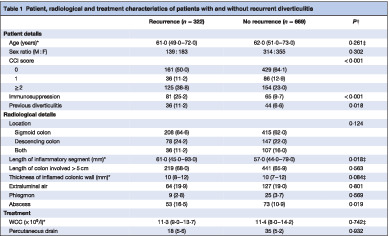
ResultsPatient demographics, clinical characteristics and neoadjuvant treatment details are summarized in Table 1. The database included 616 consecutive patients with oesophageal adenocarcinoma, of whom 242 (39·3 per cent) with positive margins (R1 resection), by RCP criteria, were included in the present study. This was equivalent to a 14·9 per cent R1 resection rate according to the CAP classification. Among the 242 patients who had R1 resections, 204 (84·3 per cent) had a positive circumferential resection margin, seven (2·9 per cent) had a positive longitudinal margin, and 29 (12·0 per cent) had both. Median follow-up was 25 months among patients who survived compared with 11 months for those who died.
Table 1. Patient demographics, clinical characteristics and neoadjuvant treatment details for all patients who underwent margin-positive resection No adjuvant treatment (n = 84) Adjuvant chemoradiotherapy (n = 112) Adjuvant chemotherapy (n = 46) P‡ Age (years)* 65 (58–70) 62 (54–68) 63 (56–69) 0·027§ Sex ratio (M : F) 64 : 20 93 : 19 39 : 7 0·235 Tumour location Oesophageal – mid–low 13 (15) 38 (33·9) 12 (26) 0·001 GOJ – Siewert 1 26 (31) 34 (30·4) 16 (35) GOJ – Siewert 2 45 (54) 34 (30·4) 17 (37) Not recorded 0 (0) 6 (5·4) 1 (2) Operative approach THO 23 (27) 43 (38·4) 16 (35) 0·068 LTA 23 (27) 36 (32·1) 8 (17) ILO 37 (44) 29 (25·9) 21 (46) McKeown/3-stage 1 (1) 4 (3·6) 1 (2) Clinical T category† cT0–2 15 (18) 13 (11·6) 4 (9) 0·578 cT3–4 69 (82) 99 (88·4) 42 (91) Clinical N category† cN0 16 (19) 23 (20·5) 4 (9) 0·108 cN1 55 (65) 63 (56·3) 30 (65) cN2 12 (14) 21 (18·8) 10 (22) cN3 1 (1) 5 (4·5) 2 (4) NAC given Yes 71 (85) 103 (92·0) 46 (100) 0·102 No 13 (15) 9 (8·0) 0 (0) NAC agent CF 6 (8) 4 (3·9) 3 (7) 0·268 ECF 15 (21) 14 (13·6) 8 (17) ECX 33 (46) 62 (60·2) 25 (54) EOX 3 (4) 7 (6·8) 4 (9) Other 8 (11) 12 (11·7) 4 (9) Not recorded 6 (8) 4 (3·9) 2 (4) Pathological T category† pT0–2 19 (23) 9 (8·0) 6 (13) 0·032 pT3–4 65 (77) 103 (92·0) 40 (87) Pathological N category† pN0 18 (21) 24 (21·4) 8 (17) 0·406 pN1 12 (14) 25 (22·3) 17 (37) pN2 30 (36) 30 (26·8) 13 (28) pN3 24 (29) 33 (29·5) 8 (17) Postoperative differentiation Well/moderate 33 (39) 52 (46·4) 17 (37) 0·318 Poor 51 (61) 60 (53·6) 29 (63) Mandard grade TRG 1–3 12 (17) 18 (17·5) 16 (35) 0·923 TRG 4–5 57 (80) 81 (78·6) 30 (65) Not recorded 2 (3) 4 (3·9) 0 (0) Lymph node yield* 21 (16–26) 21 (15–27) 26 (20–32) 0·970§ No. of positive lymph nodes* 4 (1–9) 3 (1–7) 2 (1–4) 0·146§ Margin type Radial only 73 (87) 92 (82·1) 39 (85) 0·989 Longitudinal only 1 (1) 3 (2·7) 3 (7) Both 9 (11) 16 (14·3) 4 (9) Positive (position unknown) 1 (1) 1 (0·9) 0 (0) Lymphovascular invasion Yes 63 (75) 80 (71·4) 28 (61) 0·577 No 21 (25) 32 (28·6) 18 (39) Recurrence pattern Local 8 (18) 15 (25) 5 (21) 0·486 Systemic 24 (55) 33 (56) 14 (58) Mixed 12 (27) 11 (19) 5 (21) Values in parentheses are percentages unless indicated otherwise; *values are median (i.q.r.). †TNM classification, 7th edition. GOJ, gastro-oesophageal junction; THO, transhiatal oesophagectomy; LTA, left thoracoabdominal oesophagectomy; ILO, Ivor Lewis oesophagectomy; NAC, neoadjuvant chemotherapy; CF, cisplatin and 5-fluorouracil; ECF, epirubicin, cisplatin and 5-fluorouracil; ECX, epirubicin, cisplatin and capecitabine; EOX, epirubicin, oxaliplatin and capecitabine; TRG, tumour regression grade. ‡Comparison of adjuvant chemoradiotherapy versus no adjuvant treatment; χ2 test, except §Kruskal–Wallis test.In total, 220 patients (90·9 per cent) received neoadjuvant chemotherapy, all of whom were scheduled for adjuvant treatment based on intention to treat; 46 patients (20·9 per cent) were deemed to be responders (TRG 1–3) and 168 (76·4 per cent) were non-responders (TRG 4 and 5). The patients were categorized into three adjuvant treatment groups; 112 patients (46·3 per cent) received adjuvant chemoradiotherapy, 46 (19·0 per cent) had adjuvant chemotherapy alone and 84 (34·7 per cent) did not have adjuvant treatment. Among those who received adjuvant chemotherapy alone, most were scheduled for chemoradiotherapy by MDT consensus, but patient fitness or inability to tolerate radiotherapy meant that they only received chemotherapy.
DeathsThe 30-day mortality rate for the whole cohort was less than 1 per cent (6 deaths among 616 patients). The in-hospital mortality rate after surgical resection was 1·6 per cent (10 deaths) and these patients were excluded from the analyses.
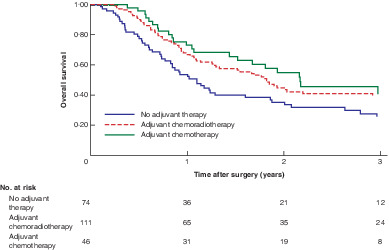
Overall survivalKaplan–Meier curves for overall survival, according to adjuvant therapy type, are shown in Fig. 1. Survival at 3 years was improved after adjuvant treatment (39·0, 40 and 25 per cent in adjuvant chemoradiotherapy, adjuvant chemotherapy and no adjuvant treatment groups).
 Comparison of overall survival in patients with margin-positive (R1) resection between treatment groups (responders and non-responders)
P = 0·154 (log rank test).
Results of crude and adjusted Cox regression analyses are shown in Table 2 and Table S2 (supporting information). Pathological N3 status (HR 3·03, 95 per cent c.i. 1·51 to 4·58; P < 0·001) and poor differentiation (HR 1·56, 1·06 to 2·28; P = 0·024) were independently associated with overall survival. For all patients who had a margin-positive resection, although the HRs favoured adjuvant treatment, these did not reach statistical significance (adjuvant chemoradiotherapy: HR 0·71, 0·47 to 1·06, P = 0·097; adjuvant chemotherapy: HR 0·64, 0·39 to 1·04, P = 0·072). In analyses stratified by tumour response to neoadjuvant treatment, a survival benefit was observed in non-responders (TRG 4 and 5) treated with adjuvant chemoradiotherapy versus no adjuvant treatment (HR 0·61, 0·38 to 0·97; P = 0·037); a survival benefit was also seen with adjuvant chemotherapy (HR 0·44, 0·24 to 0·80; P = 0·008).
Table 2. Crude and adjusted Cox regression analyses for overall survival in patients who underwent margin-positive resection stratified by response to neoadjuvant treatment Crude analysis Adjusted analysis Hazard ratio P Hazard ratio P All patients No adjuvant therapy 1·00 (reference) 1·00 (reference) Adjuvant chemoradiotherapy 0·76 (0·53, 1·08) 0·122 0·71 (0·47, 1·06) 0·097 Adjuvant chemotherapy 0·67 (0·42, 1·06) 0·086 0·64 (0·39, 1·04) 0·072 Mandard TRG 1–3, responder No adjuvant therapy 1·00 (reference) 1·00 (reference) Adjuvant chemoradiotherapy 0·83 (0·29, 2·43) 0·739 0·64 (0·15, 2·71) 0·541 Adjuvant chemotherapy 1·66 (0·60, 4·53) 0·327 Mandard TRG 4–5, non-responder No adjuvant therapy 1·00 (reference) 1·00 (reference) Adjuvant chemoradiotherapy 0·68 (0·45, 1·01) 0·060 0·61 (0·38, 0·97) 0·037 Adjuvant chemotherapy 0·46 (0·26, 0·80) 0·007 0·44 (0·24, 0·80) 0·008 Values in parentheses are 95 per cent confidence intervals. Stratified models were adjusted for age (continuous), sex, tumour location (oesophageal, Siewert 1, Siewert 2), pathological T category (pT0–2, pT3–4), pathological N category (pN0, pN1, pN2, pN3), lymphovascular invasion, postoperative differentiation (well/moderate, poor), and operative approach (Ivor Lewis oesophagectomy, transhiatal oesophagectomy, left thoracoabdominal oesophagectomy). TRG, tumour regression grade. Recurrence-free survivalFig. 2 shows Kaplan–Meier curves for recurrence-free survival by adjuvant therapy type. Results of Cox regression analyses of recurrence-free survival are presented in Table 3 and Table S2 (supporting information). Pathological N3 status (HR 5·63, 95 per cent c.i. 2·82 to 11·20; P < 0·001) was also independently associated with poor recurrence-free survival. Adjuvant treatment was associated with improved recurrence-free survival in adjusted analyses (adjuvant chemoradiotherapy: HR 0·59, 0·38 to 0·94, P = 0·026; adjuvant chemotherapy: HR 0·57, 0·33 to 0·98, P = 0·044). In analyses stratified by tumour response to neoadjuvant chemotherapy, the survival benefit from adjuvant chemoradiotherapy was observed specifically in non-responders (HR 0·53, 0·31 to 0·90; P = 0·014), but not in responders (HR 0·72, 0·15 to 3·43; P = 0·687).
 Comparison of recurrence-free survival in patients with margin-positive (R1) resection between treatment groups (responders and non-responders)
P = 0·168 (log rank test).
Table 3. Crude and adjusted Cox regression analyses for recurrence-free survival in patients who underwent margin-positive resection stratified by response to neoadjuvant treatment Crude analysis Adjusted analysis Hazard ratio P Hazard ratio P All patients No adjuvant therapy 1·00 (reference) 1·00 (reference) Adjuvant chemoradiotherapy 0·72 (0·49, 1·06) 0·099 0·59 (0·38, 0·94) 0·026 Adjuvant chemotherapy 0·67 (0·41, 1·11) 0·123 0·57 (0·33, 0·98) 0·044 Mandard TRG 1–3, responder No adjuvant therapy 1·00 (reference) 1·00 (reference) Adjuvant chemoradiotherapy 0·79 (0·27, 2·27) 0·655 0·72 (0·15, 3·43) 0·687 Adjuvant chemotherapy 0·71 (0·23, 2·20) 0·552 0·84 (0·12, 10·8) 0·903 Mandard TRG 4–5, non-responder No adjuvant therapy 1·00 (reference) 1·00 (reference) Adjuvant chemoradiotherapy 0·64 (0·41, 1·00) 0·051 0·53 (0·31, 0·90) 0·014 Adjuvant chemotherapy 0·63 (0·34, 1·05) 0·111 0·56 (0·30, 1·05) 0·071 Values in parentheses are 95 per cent confidence intervals. Stratified models were adjusted for age (continuous), sex, tumour location (oesophageal, Siewert 1, Siewert 2), pathological T category (pT0–2, pT3–4), pathological N category (pN0, pN1, pN2, pN3), lymphovascular invasion, postoperative differentiation (well/moderate, poor), and operative approach (Ivor Lewis oesophagectomy, transhiatal oesophagectomy, left thoracoabdominal oesophagectomy). TRG, tumour regression grade. Recurrence patternsThe association between adjuvant therapy and risk of different recurrence patterns is shown in Table 4. A survival benefit from adjuvant chemoradiotherapy was noted in all patients (responders and non-responders) for local (HR 0·48, 95 per cent c.i. 0·24 to 0·99; P = 0·047) and systemic (HR 0·56, 0·33 to 0·94; P = 0·027) recurrence.
Table 4. Crude and adjusted Cox regression analyses by recurrence pattern in patients who underwent margin-positive resection stratified by response to neoadjuvant treatment Local recurrence Systemic recurrence Hazard ratio P Hazard ratio P All patients No adjuvant therapy 1·00 (reference) 1·00 (reference) Adjuvant chemoradiotherapy
留言 (0)