
記住我


For CE (see Figure 3a), a 2 (target visibility: visible vs. occluded) × 3 (global–local consistency: blank, inconsistent, consistent) repeated measures ANOVA were conducted. Results showed a significant main effect of target visibility, F (1, 21) = 49.35, 95% CI 238.50–439.07, p < .001, ηp2 = .70, with CE larger in memory guided tracking (M = 455 ms, SD = 50.2) than in visually guided tracking trials (M = 116 ms, SD = 15.8). The main effect of consistency was also significant, F (2, 42) = 26.35, p < .001, ηp2 = .56. Observers were more accurate tracking the target in consistent backgrounds (M = 191 ms, SD = 34.9) than in inconsistent backgrounds (M = 333 ms, SD = 30.9) (95% CI 77.95–206.17, p < .001) or blank backgrounds (M = 332 ms, SD = 27.5) (95% CI 73.10–210.81, p < .001). Importantly, the interaction of target visibility and consistency was also significant, F (2, 42) = 4.03, p < .05, ηp2 = .16, suggesting that target visibility affected the magnitude of the consistency effect.

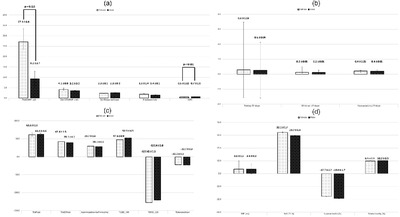
Constant error and variable error for each condition. Constant error (CE) corresponds to the signed difference between the actual arrival time and the time estimated by the subject. Variable error (VE) was defined by the standard deviation of errors in different conditions
To examine these interactions, we analyzed the target-visible and -occluded CE in separate ANOVAs. When the targets were visible, the main effect of consistency was significant, F (2, 42) = 7.04, p < .005, ηp2 = .25. Pairwise comparisons using the Bonferroni correction further showed that CE were significantly smaller for the target in a consistent background (M = 59 ms, SD = 33.3) than for the target in an inconsistent background (M = 142 ms, SD = 13.4) (95% CI 1.61–164.87, p < .05) and for the target in a blank background (M = 147 ms, SD = 12.7) (95% CI 2.81–174.15, p < .05). However, the latter two conditions did not differ from each other, p > .1. Similarly, when the targets were occluded, a significant difference also occurred among three backgrounds in CE, F (2, 42) = 19.13, p < .001, ηp2 = .48. That is, CE was also smaller for the target in a consistent background (M = 323 ms, SD = 57.3) than for the target in an inconsistent background (M = 524 ms, SD = 56.8) (95% CI 89.95–311.78, p < .001) and for the target in a blank background (M = 518 ms, SD = 49.2) (95% CI 96.68–294.18, p < .001). CE did not differ between the inconsistent background and blank background trials, p > .1. Thus, the consistency effect was found not only in visually guided tracking, but also in memory-guided tracking.
Analysis of VE (see Figure 3b) indicated a main effect of target visibility, F (1, 21) = 116.22, 95% CI 229.59–339.35, p < .001, ηp2 = .85, with a significant difference between the memory guided tracking (M = 375 ms, SD = 26.5) and the visually guided tracking trials (M = 91 ms, SD = 6.3). There was no main effect of consistency, F (2, 42) = 0.55, p = .52, ηp2 = .03 and interaction between target visibility and consistency was not significant, F (2, 42) = 0.51, p = .56, ηp2 = .02.
3.2.2 Eye movementsEye velocity signals were derived from position signals using a central difference algorithm on a ±10 ms interval. The previous research findings about smooth pursuit system have shown that smooth pursuit is more efficient in the horizontal than in the vertical dimension from newborns, infants, children, adolescent to adults (Engel et al., 1999; González et al., 2019; Grönqvist et al., 2006; Robert et al., 2014; Rottach et al., 1996; Vinuela-Navarro et al., 2019). The horizontal–vertical tracking asymmetry is especially evident when subjects pursued a target moving on a circular trajectory (Collewijn & Tamminga, 1984; Grönqvist et al., 2006; Robert et al., 2014; Rottach et al., 1996). Based on all these studies, we only analyzed the horizontal component of eye velocity.
During visual tracking of a moving target, smooth pursuit response is usually separated into an open-loop phase (the first 100 ms after initiation), and a closed-loop or steady-state phase (Lisberger et al., 1987; Tychsen & Lisberger, 1986). Pursuit in the open-loop phase is primarily driven by the target's retinal image velocity, because an internal signal about the eye velocity is not yet available to the system. As eye velocity is gradually adjusted to target velocity, pursuit tends to be steady-state and is mainly maintained by extraretinal inputs, such as efference copy (“eye velocity memory”), remembered target motion (“target velocity memory”) and object-background consistency (Bennett & Barnes, 2004). In order to explore how extraretinal signals work to maintain a stable response with high gain, the eye velocity of horizontal smooth pursuit was plotted as a function of time.
The method of data analysis in studies of event-related brain potentials (ERPs) as the reference, the horizontal smooth pursuit trace was segmented into 24 time intervals, with each interval lasting for 250 ms (Blair & Karniski, 1993). Twenty-four mean velocity values were calculated on 22 subjects under each of three conditions. For each time interval, the statistical differences among the three consistency conditions were investigated by means of univariate analysis. Results of univariate analysis are exhibited in Table 5 and revealed that differences mainly occur at three time intervals: 100–250 ms, 2750–3000 ms, and 5750–6000 ms, consistent with the trend observed in the smooth eye velocity trace (Figure 4, 4). To determine whether there was any effect of each combination of independent variables on pursuit, we computed the velocity gain, which was defined as the ratio of the average eye speed to the target speed in a given time interval.
TABLE 5. Results of univariate analysis for each time interval Df1 Df2 F p 1–250 ms 2 63 75.98 .000 215–500 ms 2 63 0.98 .412 501–750 ms 2 63 0.12 .988 751–1000 ms 2 63 0.14 .869 1001–1250 ms 2 63 0.07 .932 1251–1500 ms 2 63 0.53 .604 1501–1750 ms 2 63 4.20 .051 1751–2000 ms 2 63 1.37 .304 2001–2250 ms 2 63 0.00 1.00 2251–2500 ms 2 63 1.96 .196 2501–2750 ms 2 63 3.93 .059 2751–3000 ms 2 63 28.43 .000 3001–3250 ms 2 63 1.60 .255 3251–3500 ms 2 63 1.12 .369 3501–3750 ms 2 63 0.01 .993 3751–4000 ms 2 63 0.01 1.000 4001–4250 ms 2 63 0.45 .654 4251–4500 ms 2 63 0.15 .867 4501–4750 ms 2 63 1.84 .213 4751–5000 ms 2 63 4.08 .055 5001–5250 ms 2 63 0.55 .595 5251–5500 ms 2 63 0.14 .868 5501–5750 ms 2 63 0.23 .801 5751–6000 ms 2 63 17.53 .000
(a) Average velocity trace from all participants in prediction motion tasks. Saccades have been removed from the smooth eye velocity trace. (b) Velocity gain at three time intervals: 100–250, 2750–3000, and 5750–6000 ms. Eye movement velocity gain was defined as the ratio of the average velocity of the recorded eye movement to the target speed in a given time interval. (c) Representative example of eye velocity trace across trials from subject 10

Continued
ANOVA was performed on the horizontal velocity gain, with the time interval (100–250 ms vs. 2750–3000 ms vs. 5750–6000 ms) and the scene consistency (blank vs. inconsistent vs. consistent) as two within-participant factors. The results demonstrated a significant main effect of time interval, F (2, 42) = 3914.68, p < .001, ηp2 = .99, suggesting that the mean gains varied as a function of the time interval. The main effect of the scene consistency was significant, F (2, 42) = 90.88, p < .001, ηp2 = .81, and the time interval × scene consistency interaction was also significant, F (4, 84) = 8.44, p < .001, ηp2 = .29.
Separate ANOVAs were performed for the three time intervals: 100–250, 2750–3000, and 5750–6000 ms. As can be seen in Figure 4b, during 100–250 ms, the main effect of scene consistency was significant, F (2, 42) = 92.34, p < .001, ηp2 = .82, with gains higher in the trials with consistent backgrounds (M = 0.78, SD = 0.004) and inconsistent backgrounds (M = 0.77, SD = 0.007) than in the trials with blank backgrounds (M = 0.69, SD = 0.006), with 95% CI 0.07–0.11, p < .001 and 95% CI 0.06–0.10, p < .001, respectively. However, the difference in velocity gains between the inconsistent background and the consistent background conditions was not significant, p > .1. Furthermore, during 2750–3000 ms, there was also a significant main effect of scene consistency, F (2, 42) = 26.63, p < .001, ηp2 = .56. Pairwise comparisons using Bonferroni correction revealed that the velocity gains were higher in the trials with consistent backgrounds (M = 0.86, SD = 0.008) than in the trials with inconsistent backgrounds (M = 0.79, SD = 0.006) and blank backgrounds (M = 0.79, SD = 0.008), with 95% CI 0.035–0.097, p < .001 and 95% CI 0.042–0.098, p < .001, respectively, but the means did not differ between the inconsistent background and the blank background trials, p > .1. Similarly, during 5750–6000 ms, there was also a significant main effect of scene consistency, F (2, 42) = 18.06, p < .001, ηp2 = .46. Further comparisons using Bonferroni correction revealed that the velocity gains were higher in the trials with consistent backgrounds (M = 0.41, SD = 0.009) than in the trials with inconsistent backgrounds (M = 0.34, SD = 0.012) and blank backgrounds (M = 0.34, SD = 0.006), with 95% CI 0.032–0.104 and 95% CI 0.036–0.103, ps < .001, but the means did not differ between the inconsistent background and the blank background trials, p > .1. This is not surprising since the consistent background enhanced the tracking performance of the target circle under both visible- and memory-guided tracking conditions.
留言 (0)