
記住我

One of the remaining limitations of detailed hypothalamic segmentation is the confounding effect of surrounding white matter including the fornix and mammillothalamic tract. Due to the low contrast in conventional structural magnetic resonance imaging (MRI), this influence cannot be reliably excluded. To tackle these shortcomings, we propose quantitative MRI (qMRI) to obtain information about underlying tissue microstructure including water, myelin, and iron for hypothalamus and white matter segmentation. These findings are especially relevant to researchers working in fields involving structural studies of the hypothalamus in health and disease, including neuroendocrinology, stress, and psychiatric disorders.
1 INTRODUCTIONDespite its small size of approximately 1.4 cm3, the hypothalamus is involved in different complex functions, including body homeostasis, endocrine regulation, emotional behavior, and higher cognitive abilities (Bao & Swaab, 2019; Petrovich, 2018; Saper & Lowell, 2014; Seong et al., 2019). It is located lateral to the third ventricle in close proximity to the pituitary gland and ventral to the thalamus. The approximately 15 distinct hypothalamic nuclei (Baroncini et al., 2012) have widespread connections to the prefrontal cortex, hippocampus, thalamus, brainstem, and pituitary (Lemaire et al., 2011). Hence, it has become increasingly important to distinguish different hypothalamic subregions in neuroimaging research to disentangle their functional roles in health and disease. Anatomical delineation of the hypothalamus or its subregions (segmentation) is mostly based on T1- and T2*-weighted magnetic resonance images (MRI), using manual or semi-automated techniques and anatomical landmarks identified in histological examinations (e.g., optic tract, anterior commissure, and mammillary bodies) (Lemaire et al., 2013; Makris et al., 2013; Wolff et al., 2018).
However, differences in MRI acquisition strategies and segmentation approaches on T1- and T2*-weighted images result in variability across studies and image contrast in the hypothalamic region lacks morphological detail, leading to inconsistent application of landmarks (i.e., liberal vs. conservative approaches depending on prior experience/training and visibility of landmarks in individual acquisitions). Especially lateral boundaries and crossing white matter are not easily identifiable and often approximated using surrounding anatomical landmarks (Gabery et al., 2015; Goldstein et al., 2007; Lemaire et al., 2011; Wolff et al., 2018). Therefore, and because manual segmentation is very time-consuming, different automated segmentation techniques have been developed, including for example atlases and machine learning applications to define regions of interest (ROI) instead of manual delineation (Lundervold & Lundervold, 2019; Mazziotta et al., 1995) to enhance comparability and applicability to large data sets.
Specifically for hypothalamus segmentation and parcellation, Billot et al. (2020) employed a convolutional neural network (CNN) to form five subunits comprised of multiple hypothalamic nuclei trained on manually parcellated T1w images following a previously published protocol for manual segmentation (Bocchetta et al., 2015; Makris et al., 2013). Such approaches enable fast segmentation of large data sets with high accuracy and applicability. Still, subunits are largely influenced by the training data set and spatially constrained to follow the orientations and ratios learned on the training data. As a result, the method successfully identifies overall size differences in hypothalamic volume, but individual size or shape differences of subunits, which may be relevant especially in psychiatric patient samples, could be overlooked. The same applies to atlas-based segmentation, where ROIs are based on an atlas template that is built from multiple data sets/observations, such that the ROI shape and size depends on the data used to create it, imposing strong priors on new/unseen data. Recently, Neudorfer et al. (2020) developed a high-resolution atlas for individual hypothalamic nuclei and surrounding structures based on 990 subjects from the Human Connectome Project (Glasser et al., 2016), thereby enabling detailed hypothalamus parcellation on nucleus level. However, due to the small structure of the hypothalamic nuclei, pinpoint registration is another critical aspect that can lead to misrepresentation of the underlying tissue that is one of the major concerns of atlas-based segmentations (Sun et al., 2019; Toga & Thompson, 2001).
To better integrate underlying tissue information into segmentation, data-driven methods have been developed, which were based on individual diffusion-weighted (Schönknecht et al., 2013), or functional imaging data (Osada et al., 2017), thus being independent of the remaining sample or previous training sets. Nonetheless, one remaining drawback of available procedures for hypothalamic segmentation and volumetry is the reliable exclusion of cerebrospinal fluid (CSF), the fornix, and other white matter tracts. The fornix is a large white matter bundle passing from the hippocampus through the hypothalamus to the mammillary bodies (Christiansen et al., 2016). In more posterior parts of the hypothalamus, the fornix is fully surrounded by hypothalamic tissue, appearing more diffuse and weaker in contrast on T1w images, further complicating its reliable and complete extraction. Therefore, these areas were not excluded in prior hypothalamus segmentations (Schindler et al., 2013; Wolff et al., 2018). The optic and mammillothalamic tracts are additional white matter bundles near the hypothalamus that need to be taken into consideration, the former bordering the inferior to lateral regions of the hypothalamus, and the latter arising from the superior edge of the mammillary bodies. With T1w images, the mammillothalamic tract cannot be excluded due to limited visibility. Overall, these difficulties lead to inconsistencies in the literature of structural studies on the hypothalamus. For example, especially diffusion parameters such as fractional anisotropy or mean diffusivity, which are frequently used to investigate structure-function relationships in the hypothalamus (Gerstenslager et al., 2020), could be largely influenced by partial volume contaminations from white matter and CSF. Hence, we recognize a need for standardized segmentation protocols and exclusion of white matter confounds.
In recent years, standardized MRI protocols sensitive to microstructural properties have been developed, including quantitative MRI (qMRI) (Keenan et al., 2019; Seiler et al., 2021). Based on multiparameter maps including magnetization transfer saturation (MT sat.), proton density (PD), longitudinal relaxation rate (R1: 1/T1), and effective transverse relaxation rate (R2* = 1/T1*), different tissue contents are computed (Callaghan et al., 2014). MT sat. is sensitive to the amount of myelin and macromolecular content, thereby serving as a marker for fiber integrity and myelination (Hagiwara et al., 2018; Lema et al., 2016). Consequently, MT sat. is higher in white compared to gray matter and could be a useful tool to distinguish hypothalamic microstructure from surrounding white matter. In contrast, PD is sensitive to free water content, and can be used to characterize tissue damage (e.g., edema) and CSF. Finally, R1 is sensitive to myelin and water, and together with R2* reflects iron, which is often used as a marker for aging and neurodegenerative diseases (Ulla et al., 2013; Ward et al., 2014). Hence, contrarily to conventional T1w and T2*w images, gray values in qMRI provide meaningful information about the underlying tissue microstructure, while achieving comparable spatial resolution, thus being a promising tool for standardized segmentation. In the past, qMRI has already been used for identification or segmentation of both cortical and subcortical areas including somatomotor cortex (Carey et al., 2017), brainstem (Lambert et al., 2013), pallidum, putamen, and substantia nigra (Helms et al., 2009). To our knowledge, however, no study has investigated hypothalamic and surrounding tissue microstructure using qMRI.
In the present study we first aimed to evaluate whether qMRI sequences can aid in reproducible delineation of the hypothalamus and associated white matter in a representative sample of young to middle-aged healthy adults. Second, the sensitivity of qMRI and diffusion MRI to identify possible microstructural differences in hypothalamic subunits is explored. Third, we determined whether quantitative MRI measures could be used to extract the fornix and other white matter tracts from the hypothalamus using data-driven clustering to improve and standardize available segmentation procedures.
2 METHODS 2.1 ParticipantsTwenty-seven healthy participants aged between 21 and 57 years without history of neurological or psychiatric disorders were included in this study (16 females 11 males). All participants were white and Europeans. Two male and one female were left handed, as assessed by the Edinburgh Handedness Inventory (Oldfield, 1971). The remaining subjects were right handed. See Table 1 for demographic information on the sample. The study was approved by the ethics committee of the University of Oldenburg (Drs. 50/2017), and all participants provided written informed consent prior to participation.
TABLE 1. Participant characteristics (mean and standard deviation) Participant characteristics M ± SD Male (n = 11) Female (n = 16) Age (years) 41.0 ± 13.4 39.9 ± 12.2 Education (years) 12.7 ± 0.6 12.6 ± 0.7 BMI (kg/m²) 26.6 ± 4.01 24.2 ± 5.6 2.2 MRI acquisitionData were collected on a 3T whole-body MRI scanner (Magnetom Prisma, Siemens Medical Systems, Germany) with a 64-channel head coil for signal reception and a body coil for transmission. During scanning, the participants were asked to lay still with their eyes closed and their head was padded to minimize head motion.
T1-weighted images were acquired using a magnetization-prepared rapid gradient-echo sequence (MP-RAGE) with isotropic voxel size of 0.75 mm3. Coronal T2*-weighted images were obtained using a turbo spin echo sequence with voxel size of 0.6 × 0.6 × 2.0 mm and averaged across two acquisitions to increase the signal-to-noise ratio. The field of view (FOV) was placed such that it covered the entire hypothalamic region. Following the protocol of Callaghan et al. (2019) and Tabelow et al. (2019), we used multi-echo 3D FLASH (fast low-angle shot) sequences at 0.8 mm3 resolution with six different echo times for each acquisition for qMRI (T1w, PDw, MT sat.). A SIEMENS product sequence based on spin-echo/stimulated echo (SE/STE) imaging was acquired at the beginning of each session with 4.0 × 4.0 × 5.0 mm resolution. Prior to each T1w, PDw, and MTw measurements, two low-resolution sensitivity maps from the head and body coils were acquired (voxel size: 4.0 × 4.0 × 5.0 mm).
Multi-shell, multi-slice (iPAT factor 3) diffusion-weighted imaging was acquired in anterior-to-posterior phase encoding direction, with 132 diffusion directions (40 directions each for b1000, b2000, and b3000 with 12 interspersed b0 images) and 2.0 mm3 voxel size. An additional single b0 image was obtained in posterior-to-anterior phase encoding direction with otherwise identical parameters.
The phase encoding direction for the remaining protocol was anterior to posterior, except for the T2* sequence, which was acquired from right to left. The total scanning time was approximately 45 minutes, and a detailed description of the imaging parameters is provided in Table 2.
TABLE 2. MRI measurements in the order in which they were acquired Flip angle (°) FOV (mm²) Echo times (ms) TR (ms) No. slices Voxel size (mm) SE/STE [90, 120, 60, 135, 45] 256 × 256 [14, 14] 2,000 18 4.0 × 4.0 × 5.0 T1w 21 256 × 256 [2.57, 5.82, 9.86,13.9,17.94,21.98] 26 279 0.8 × 0.8 × 0.8 PDw 4 256 × 256 [2.57, 5.82, 9.86,13.9,17.94,21.98] 26 279 0.8 × 0.8 × 0.8 MT sat. 6 256 × 256 [2.57, 5.82, 9.86,13.9,17.94,21.98] 44 279 0.8 × 0.8 × 0.8 Sensitivity head 6 256 × 256 1.99 4.1 44 4.0 × 4.0 × 5.0 Sensitivity body 6 256 × 256 1.99 4.1 44 4.0 × 4.0 × 5.0 MP-RAGE 9 240 × 240 2.07 2,000 224 0.75 × 0.75 × 0.75 T 2* 150 224 × 320 79 5,000 40 0.6 × 0.6 × 2.0 b 0 - 232 × 232 75 3,900 81 2.0 × 2.0 × 2.0 Diffusion - 232 × 232 75 3,900 81 2.0 × 2.0 × 2.0 Abbreviations: FOV, field of view; TR, repetition time. 2.3 MRI processingFirst, images were automatically reoriented to AC-PC orientation in mid-sagittal plane (Auto-Reorient module), and multiparameter maps were generated (create hMRI maps module) using the hMRI toolbox (Tabelow et al., 2019) implemented in the Statistical Parametric Mapping toolbox (SPM 12) (Statistical Parametric Mapping, 2007). B1 transmit field correction was performed based on the SE/STE sequence. Data were corrected for RF sensitivity bias using the head and body sensitivity maps.
The T1w image was segmented into GM, WM, and CSF, and bias corrected (light regularization: 0.001) using Segment in SPM. Multiparameter maps were then registered and interpolated to anatomical (T1) space using the FMRIB Software Library's (FSL, v. 5.0.9) flirt with rigid body (6 df) registration (Greve & Fischl, 2009; Smith et al., 2004). Trilinear interpolation was used for reslicing from 0.8 mm3 isotropic to 0.75 mm3 isotropic resolution. For registration, the T1w image was skullstripped in SPM (Image Calculator) using the tissue probability maps for GM, WM, and CSF generated in the segmentation step. Diffusion-weighted data were eddy and movement corrected using FSL's topup and eddy (Andersson & Sotiropoulos, 2016). Epi_reg was used to register the diffusion data to T1 space, and diffusion gradients were rotated according to the transformation matrix. Using qboot, multishell constant solid angle orientation distribution functions (ODFs) were reconstructed with a spherical harmonics basis of 6. Based on mean ODF in each voxel, generalized fractional anisotropy (GFA) was computed as a quantitative descriptor of the diffusion process in each voxel (Tuch, 2004). GFA was chosen instead of tensor FA as a more sensitive measure for crossing fibers and partial volume contaminations.
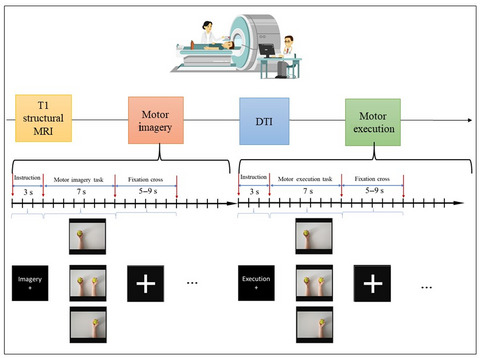
2.4 Experimental proceduresOur analyses aimed to show that the hypothalamus can be reliably segmented with qMRI, including its reliable separation from white matter. It was divided into three parts (Figure 1). At first, a standardized protocol for hypothalamus and white matter segmentation based on qMRI was developed to promote reproducibility of segmentations across scanners and research groups, and segmentation accuracy was compared between raters (inter-rater reliability). Afterwards, microstructural differences between hypothalamic subunits were explored to identify parameters best differentiating between hypothalamic subunits. Lastly, this microstructural variability was used to extract white matter from the hypothalamic region using a spectral clustering approach, enabling fast and individual exclusion of white matter.

Analyses steps of the study. At first, we developed a standardized segmentation protocol for the hypothalamus based on quantitative magnetic resonance imaging. Then we assessed microstructural differences in hypothalamic subunits. Finally, we used these differences for white matter extraction and compared our framework to existing methods
2.4.1 Hypothalamus segmentation protocolHypothalamus masks were manually defined for the left and right hemisphere using established anatomical landmarks (Goldstein et al., 2007; Schindler et al., 2013) based on the T1w and T2*w image in 3D Slicer v. 10.0.2 (https://www.slicer.org/, (Fedorov et al., 2012)). The fornix was included when surrounded by hypothalamic tissue. Using the tissue probability map for CSF, the masks were refined such that voxels with a CSF probability >10% were excluded. To implement a standardized procedure employing qMRI, a segmentation protocol for the hypothalamus and white matter was developed by re-evaluation of the hypothalamus masks based on qMRI (Table 3). Manually segmented hypothalamus masks were overlaid onto the MT saturation, PD, R1, and R2* maps to explore the possibility of using these images as aid in exclusion of white matter by determination of optimal image intensities and subsequent identification of white matter structures (e.g., optic tract, fornix, and mammillothalamic tract). Then, manual segmentation of the hypothalamus as well as of the fornix passing through the hypothalamus mask was performed based on qMRI. Following this procedure, an additional second rater performed the hypothalamus and fornix segmentations in a subset of n = 12 participants to determine inter-rater reliability. To that aim, the voxel overlap (Dice coefficient) between the CSF-corrected hypothalamus and fornix masks of both raters was calculated.
TABLE 3. Segmentation protocol for the hypothalamus and surrounding white matter based on qMRI Modality Segmentation (1) MT sat. coronal (0–5 p.u.) Begin on the first coronal slice where the anterior commissure (AC) appears continuous. Draw superior edge of the hypothalamus below AC, and inferior edge above optic chiasm (OC). When the optic tracts bifurcate, the hypothalamus is segmented above the infundibular stalk and medial to the optic tracts Continue until interventricular foramen and fornix (2) R1 coronal (0.2–1.6 s−1) Start again on the first coronal slice where the AC appears continuous and draw the lateral extent of the hypothalamus on both sides of the third ventricle. Medially, the left and right masks cover the third ventricle up to the midline. Check exclusion of olfactory tubercule Continue until interventricular foramen and fornix (3) MT sat. coronal (0–5 p.u.) Check for exclusion of optic or AC fibers. On the first slice with the fornix visible, draw until below the inferior tip of the fornix When the fornix is laterally surrounded by hypothalamic tissue, trace around it (exclude voxels of approx. > 2.5 p.u.) Continue until mammillary bodies (4) R1 coronal (0.2–1.6 s−1) Draw lateral edges of the hypothalamus until the appearance of the mammillary bodies (MBs). Check for boundaries: hypothalamic sulcus and subthalamic nucleus (superior), substantia innominata (lateral). Inferiorly, draw until infundibular stalk. Medially, the masks touch at the midline (5) MT sat. coronal (0–5 p.u.) At the first slice with MBs visible, the superior, inferior, and lateral boundary of the mask is defined as the extent of the MBs. Exclude the mammillothalamic tract (visible on the superior edge of the MBs). Check for and exclude substantia nigra (lateral). MBs touch at the midline Review in triplanar view Coronal R1: Lateral extent of the hypothalamus MT sat.: Optic tract excluded? Sagittal R1: Correct delineation of the hypothalamic sulcus? Check posterior extent of MBs. Excluded infundibular stalk? MT sat.: mammillothalamic tract and fornix excluded? Axial R1: Check lateral extent of the inferior hypothalamus and the extent of the MBs CSF correction Tissue probability map CSF Exclude voxels >0.10 to correct for fluid-filled spaces, for example, the third ventricle Note For segmentation, all images are shifted to AC-PC orientation in the midsagittal plane. Segmentations were performed in 3D Slicer v. 10.0.2, with the R1 image loaded into the foreground and MT sat. image into the background. Visibility of fore- and background was toggled as specified in “Modality.” 2.4.2 Hypothalamic microstructureTo identify potential microstructural differences of hypothalamic regions based on qMRI measurements, hypothalamic subunits were obtained following the CNN architecture proposed by Billot et al. (2020) using the bias-corrected T1w image resampled to 1 mm3 (anterior–inferior (a-iHyp), anterior–superior (a-sHyp), inferior tuberal (iTub), superior tuberal (sTub), and posterior (Post) hypothalamus). Those subunits were then used to independently evaluate tissue microstructure of the hypothalamus based on quantitative parameters in all n = 27 participants. To test the effect of subunit on microstructure (MT sat., PD, R1, R2*, and GFA), five one-way analyses of variance (ANOVA) were computed. Where appropriate, Tukey's HSD post hoc tests for pairwise comparisons were conducted. To account for multiple comparisons, p < 0.01 (Bonferroni adjustment) was considered significant for each ANOVA.
2.4.3 Data-driven white matter extraction with spectral clusteringIn a last step, microstructural differences were used to delineate white matter using a spectral clustering approach. For white matter extraction in the hypothalamus, voxel values for each qMRI parameter within the manually defined hypothalamus masks were first standardized to a mean of zero and a standard deviation of one. Then, spectral clustering was computed separately for each hemisphere based on quantitative information in each voxel best representing microstructural differences between hypothalamic subunits. As input, the microstructural properties of each subject are used individually, thus being independent of the sample size and characteristics of the other participants. Spectral clustering is a graph-based algorithm that partitions the data into k clusters using the eigenvectors of the normalized Laplacian matrix (Shi & Malik, 2000; von Luxburg, 2007). It was implemented with k-means using spectralcluster in MATLAB 2018a (Mathworks Inc.). An advantage of spectral clustering compared to other methods is that underlying clusters are not restricted to convex regions because the algorithm does not make assumptions on the cluster shape. As distance metric, the Euclidean distance was chosen. First, optimal k (k = ) was determined minimizing the Davies–Bouldin index (DBI) (Davies & Bouldin, 1979) of a randomly selected subset of the participants (n = 7), leaving n = 20 for further analyses. The DBI describes a ratio between within- and between-cluster distances and is a common method to evaluate clustering performance. Resulting clusters were compared to the manual segmentation of the fornix to integrate a priori knowledge about underlying anatomical structure. Then, the number of clusters leading to the best representation of the fornix structure was chosen. Afterwards, clusters were labeled according to their relative position. Using Dice coefficients, the overlap between the manually segmented fornix and the clustering outcome was calculated.
Finally, white matter extraction in all three automated procedures (Billot et al., 2020; Neudorfer et al., 2020, spectral clustering) was evaluated to compare the performance of our clustering to state-of-the-art approaches. To that end, the T1w image was affine and nonlinearly registered to the Montreal Neurological Institute (MNI) template in 0.5 mm3 resolution provided by Neudorfer et al. (2020). Registration was visually checked on easily identifiable landmarks including the mammillary bodies and anterior commissure. The same transforms were then applied to the MT sat. image, fornix clusters, hypothalamic subunits, and atlas labels. As the atlas labels for the mammillothalamic tract and fornix included white matter beyond the hypothalamus, they were reduced to those voxels included in the hypothalamus as determined by our manual segmentation. Overlap was then determined using the Dice coefficient and Hausdorff distance. The Dice coefficient is measured by the area of overlap between labels (in voxels) times 2 divided by the total number of voxels in both labels. The Hausdorff distance is defined as the maximum of the minimum Euclidean distances between each voxel of the label to any voxel in the other label. Here, the 95th percentile is used as it is less influenced by outliers (Bontempi et al., 2020) stemming from white matter voxels in the optic tract and anterior commissure included in our spectral clustering method. Dice values range between 0 and 1, with values closer to 1 indicating more overlapping segmentations. Contrarily, higher Hausdorff values denote larger differences between segmentations. For a detailed explanation of the Dice coefficient and Hausdorff distance, see Taha & Hanbury (2015).
Using two one-way ANOVAs and Tukey's HSD post hoc tests, Dice and 95% Hausdorff metrics were compared between the manual, clustering-, and atlas-based white matter (fornix and mammillothalamic tract) segmentations. Because white matter including the fornix was discarded following Billot et al. (2020), it was not possible to determine the overlap with our results, or the atlas-based segmentation by Neudorfer et al. (2020). Therefore, results obtained with Billot et al. (2020) were only visually evaluated. If not stated otherwise, statistical analysis was performed with R v. 3.6.3 (https://www.R-project.org/). All analyses were conducted with the remaining n = 20 participants not used for determining the optimal number of clusters. Means and standard deviations are provided in brackets (M ± SD).
3 RESULTS 3.1 Hypothalamus segmentation protocolIn all participants, MT sat. and R1 images provided a better visual contrast to laterally surrounding structures as well as white matter structures such as the optic tract, mammillothalamic tract, and fornix, compared to conventional T1w and T2*w images (Figures 2 and 3). Based on these findings, a segmentation protocol was developed employing MT sat. and R1 images (Table 3). Hypothalamus and fornix masks created following this protocol were compared in a subset of 12 participants between two raters using Dice coefficients as a measure of inter-rater reliability. In this subset, mean hypothalamus volume was 789 ± 107.34 mm3 and 782 ± 82 mm3 for rater 1 and rater 2, respectively. Mean hypothalamus volume in all 27 participants was 746 ± 91 mm3 (rater 1). A Spearman's correlation shows a high correlation of volumes obtained from rater 1 and 2 (ρ = 0.86, p < 0.001). Mean Dice coefficients suggest high correspondence between the hypothalamus (0.90 ± 0.01) and the fornix (0.76 ± 0.06) of both raters. For further analyses, segmentation results obtained by the first rater were used.

The left (blue) and right (red) masks of the hypothalamus of one participant overlaid onto the T1- and T2*-weighted images as well as onto the MT sat., PD, R1, and R2* maps. Image intensities for the T1- and T2*-weighted images are displayed in arbitrary units (a.u.), MT sat. and PD in percent units (p.u.), and R1 and R2* in 1/second (s−1)

Visibility and landmarks of the hypothalamus compared between magnetization transfer saturation (MT sat., in percent units (p.u.)), longitudinal relaxation Rate (R1, in 1/second (s−1)), and the conventional T1-weighted image (T1w). The red arrow indicates the shape of the mammillary body that is well identifiable in the R1 image, and the dotted line shows the separation between anterior hypothalamic tissue and the nucleus of the diagonal band and septal nuclei. In the R1 images, yellow arrows indicate the tissue contrast between the anterior hypothalamus and lateral adjacent structures. For comparison, the same slices are displayed using the T1-weighted image below (standard contrast, high contrast). AC: anterior commissure; Fx: fornix; HS: hypothalamic sulcus; IvF: interventricular foramen; MB: mammillary body; MT: mammillothalamic tract; OC: optic chiasm/optic tract; Post: posterior hypothalamic area; Thal: thalamus
3.2 Hypothalamic microstructureIn the second step, we determined whether tissue microstructure differs between subregions of the hypothalamus. We analyzed mean MT sat., PD, R1, R2*, and GFA in the subunits identified with the algorithm of Billot et al. (2020) using five one-way ANOVAs (Bonferroni-corrected p < 0.01 is considered significant). Results suggest significant subunit differences in MT sat. (F(4,130) = 61.77, p < 0.001), R1 (F(4,130) = 18.93, p < 0.001), R2* (F(4,130) = 9.903, p < 0.001), and GFA (F(4,130) = 15.63, p < 0.001), and no differences in PD (F(4,130) = 3.392, p = 0.011). Tukey's HSD post hoc test results are depicted in Figure 4 and suggest that most subunits differ in mean MT sat., followed by R1 and R2*.
 Boxplots showing microstructural properties of five hypothalamic subunits following Billot et al. (2020). Boxes show the first and third quartiles and the median (horizontal line). Whiskers denote the minimum and maximum value without outliers. Tukey's HSD post hoc tests results: ***p p p
3.3 Data-driven white matter extraction with spectral clustering
Boxplots showing microstructural properties of five hypothalamic subunits following Billot et al. (2020). Boxes show the first and third quartiles and the median (horizontal line). Whiskers denote the minimum and maximum value without outliers. Tukey's HSD post hoc tests results: ***p p p
3.3 Data-driven white matter extraction with spectral clustering
Our final analysis aimed to automatically detect white matter within the (manually defined) hypothalamus masks and to draw comparisons with regard to existing automated segmentation protocols. To that end, parameters best differentiating between hypothalamic subregions (MT sat., R1, R2*) were used for spectral clustering of the hypothalamus. First, optimal k was determined using the DBI for a randomly selected subset of participants (n = 7) and each hemisphere, suggesting k = 2 as optimal number of clusters in most cases (2: 85.71, 5: 14.29% of cases). Still, agreement with manual fornix segmentations substantially increased until k = 4, as determined by the mean Dice coefficients (Table 4).
TABLE 4. Dice coefficients showing the level of correspondence of manual segmentation versus spectral clustering of the fornix for n = 7 Number of clusters Dice coefficients manual versus clustering Left fornix (M ± SD) Right fornix (M ± SD) 2 0.43 ± 0.10 0.45 ± 0.13 3 0.65 ± 0.10 0.70 ± 0.10 4 0.76 ± 0.10 0.79 ± 0.10 5 0.75 ± 0.08 0.76 ± 0.12Hence, clustering was implemented with four clusters. In all remaining n = 20 participants, four unique subunits were identified, which were labeled as superior-lateral, inferior-medial, fornix, and posterior/mammillary based on their position (Figure 5). The cluster labeled as fornix also included white matter of the mammillothalamic tract located at the superior base of the mammillary bodies (Figure 5 bottom row, Figure 6 left), and white matter belonging to the anterior commissure (not shown) and optic tract (Figure 5, top row) that was not completely excluded was detected as well.

Spectral clustering result in coronal slices exemplary for one participant from anterior to posterior beginning at the top left from left to right and top to bottom
 Evaluation of autom
留言 (0)