
記住我


The newly recognized World Health Organization (WHO) tumor type, ‘intracranial mesenchymal tumor, FET-CREB fusion-positive’ [1], is a rare neoplasm of the central nervous system (CNS) that has been previously described as either intracranial angiomatoid fibrous histiocytoma or intracranial myxoid mesenchymal tumor (IMMT) [2-5]. This tumor is molecularly defined by in-frame gene fusion of the FET family of RNA-binding proteins (EWSR1 or FUS) to the CREB (cyclic AMP response element binding protein) family of transcription factors, which includes ATF1, CREB1, and CREM. Notably, identical FET-CREB fusions are recurrently found in angiomatoid fibrous histiocytoma (AFH), clear cell sarcoma of soft tissue (CCS), clear cell sarcoma of the gastrointestinal tract, primary pulmonary myxoid sarcoma, hyalinizing clear cell carcinoma of the salivary gland, and a subset of malignant mesotheliomas lacking BAP1 and NF2 alterations [6-16]. However, the exact relationship of these intracranial mesenchymal tumors with FET-CREB fusions to AFH of extracranial soft tissue and other FET-CREB fusion-driven neoplasms has been uncertain.
We previously studied the clinical, radiologic, histologic, and genomic features of a cohort of 20 intracranial mesenchymal tumors with FET-CREB fusions [5]. We identified that these tumors occur with a female predominance (approximately 2:1 female/male ratio) in a wide age range, but most often occur in the second and third decades of life. They are predominantly extra-axial or intraventricular tumors which can arise throughout the neuroaxis, including the falx, tentorium, cerebral convexities, and lateral ventricles. They are typically contrast enhancing masses, well-circumscribed, with solid and cystic growth patterns, and often have pronounced peritumoral edema. Beyond the oncogenic FET-CREB fusions, they typically lack accompanying oncogenic mutations, amplifications, or deletions, and usually harbor near-diploid genomes. These tumors are associated with a propensity for local recurrence over time, but only a small subset have disseminated and resulted in patient mortality.
Here we have performed genome-wide DNA methylation profiling on our previously published cohort of 20 primary intracranial mesenchymal tumors with FET-CREB fusions to further study the ontology of these neoplasms and identify any clinically relevant epigenetic subgroups.
2 MATERIALS AND METHODS 2.1 Study population and tumor specimensThe study cohort consisted of 20 patients who underwent surgical resection of a primary intracranial neoplasm that was identified to harbor a gene fusion of EWSR1 or the related FUS together with a CREB family member (ATF1, CREB1, or CREM). The clinical features of these 20 patients and histopathologic features of the tumor cohort were previously reported [5].
2.2 Genome-wide DNA methylation profilingTumor tissue was selectively scraped from unstained slides or punched from formalin-fixed, paraffin-embedded (FFPE) blocks using 2.0 mm disposable biopsy punches (Integra Miltex Instruments) to enrich for the highest tumor content possible. Genomic DNA was extracted from this macrodissected tumor tissue using the QIAamp DNA FFPE Tissue Kit (Qiagen). Genomic DNA was bisulfite converted using the EZ DNA Methylation kit following the manufacturer's recommended protocol (Zymo Research). Bisulfite converted DNA was then amplified, fragmented, and hybridized to Infinium EPIC 850k Human DNA Methylation BeadChips following the manufacturer's recommended protocol (Illumina).
2.3 Processing and quality assessment of DNA methylation dataMethylation data were preprocessed using the minfi package (v.1.30.0) in R Bioconductor (version 3.5.3) [17]. The detection p-value for each sample was computed, and CpG sites with detection p values above 0.05 were discarded from the analysis. Additional quality control was performed by calculating the median log (base2) intensities for methylated and unmethylated signals for each array. All samples had unmethylated and methylated median intensity values above 10 that were used for analysis. Functional normalization with NOOB background correction and dye-bias normalization was performed [18, 19]. Probe filtering was performed after normalization. Specifically, probes located on sex chromosomes, containing nucleotide polymorphisms (dbSNP132 Common) within five base pairs of and including the targeted CpG site, or mapping to multiple sites on hg19 (allowing for one mismatch), as well as cross reactive probes were removed from analysis.
2.4 Unsupervised hierarchical clustering of DNA methylation dataWe performed unsupervised hierarchical clustering with the hclust function in Rstats (v3.6.0) to assess variation in DNA methylation patterns and determine any relevant epigenetic subgrouping among the 20 tumors. The lmFit function from the Limma package (v.3.40.6) was applied on a log-transformed β-value matrix to identify the 20,000 most differentially methylated CpG probes across the tumor cohort. Then K-means clustering utilizing the Pearson distance matrix with complete linkage was used to determine the optimal number of clusters, through 500 re-sampling interactions of the dataset for K-means of 2, 3, 4, or 5. Visualization was performed using the R package ComplexHeatmap (v.2.0.0) [20].
We also compared the DNA methylation patterns of the 20 intracranial mesenchymal tumors with FET-CREB fusion against the DNA methylation patterns of two extracranial sarcoma entities with identical FET-CREB fusions (clear cell sarcoma of soft tissue and angiomatoid fibrous histiocytoma) that we recently generated as part of our development of the DKFZ Sarcoma Methylation Classifier (www.molecularsarcomapathology.org) [21]. This included 7 reference cases of clear cell sarcoma of soft parts (tumor ID’s: 956, 957, 958, 959, 960, 961, and 962), which were all located in the soft tissue of the upper or lower extremities with median patient age of 56 years (range 18–78 years). Also included were 8 reference cases of angiomatoid fibrous histiocytoma (tumor ID’s: 340, 341, 360, 361, 362, 363, 364, 1066), which were all located in extracranial soft tissue with median patient age of 11 years (range 6–13 years). The lmFit function from the Limma package (v.3.40.6) was applied on a log-transformed β-value matrix to identify the 20,000 most differentially methylated CpG probes across the cohort of 20 intracranial mesenchymal tumors with FET-CREB fusion together with the 7 reference cases of clear cell sarcoma of soft parts and 8 reference cases of angiomatoid fibrous histiocytoma of extracranial soft tissue. K-means clustering utilizing the Pearson distance matrix with complete linkage was then used to determine the optimal number of clusters, through 500 re-sampling interactions of the dataset for K-means of 2, 3, 4, or 5. Unsupervised hierarchical clustering of DNA methylation data was performed using the hclust function in Rstats (v3.6.0). Visualization was performed using the R package ComplexHeatmap (v.2.0.0).
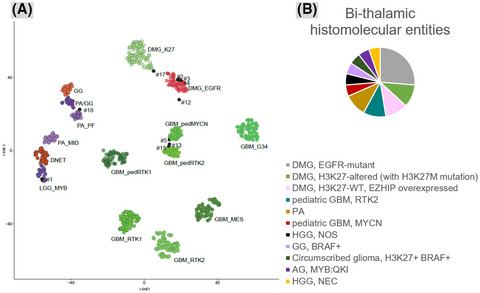
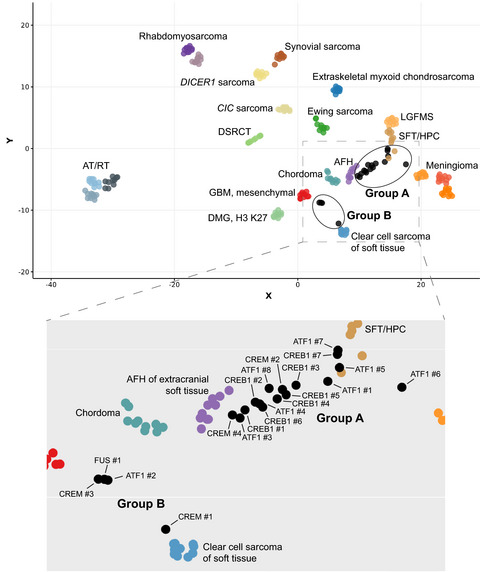
2.5 tSNE dimensionality reduction of DNA methylation dataThe DNA methylation profiles of the 20 intracranial mesenchymal tumors with FET-CREB fusions were assessed together with 210 reference tumors spanning 17 sarcoma and CNS tumor entities previously generated at DKFZ [21, 22], which were selected based on tumor types with a similar meningeal/extra-axial location, tumor types that might enter into the differential diagnosis based on overlapping morphologic appearance, and extracranial sarcomas driven by EWSR1 or FUS gene fusions. These included 10 angiomatoid fibrous histiocytoma of extracranial soft tissue, 30 atypical teratoid/rhabdoid tumor (belonging to the three different epigenetic subgroups: MYC, SHH, and TYR), 10 clear cell sarcoma of soft tissue, 10 chordoma, 10 extraskeletal myxoid chondrosarcoma, 10 H3 K27M-mutant diffuse midline glioma, 10 desmoplastic small round cell tumor, 10 Ewing sarcoma, 10 IDH-wildtype glioblastoma of the mesenchymal epigenetic subclass, 10 low-grade fibromyxoid sarcoma, 30 meningioma (belonging to the various epigenetic subgroups), 10 alveolar rhabdomyosarcoma, 10 embryonal rhabdomyosarcoma, 10 CIC-altered sarcoma, 10 DICER1-mutant sarcoma, 10 solitary fibrous tumor, and 10 synovial sarcoma. Since the reference cohort contained methylation data generated using the Infinium Human Methylation 450k BeadChips, the approximately 450,000 overlapping CpG sites between the EPIC 850k and 450k BeadChips were used in the analysis. A beta value matrix with approximately 390,000 CpG probes was used for all downstream analysis. Row-wise standard deviation was calculated for each probe across all samples, and the 20,000 most differentially methylated probes with standard deviation >0.216 were selected. Dimensionality reduction using t-distributed stochastic neighbor embedding (tSNE) was performed by Rtsne (v.0.15) using the following analysis parameters: dims = 2, max_iter = 3000, theta = 0, perplexity = 20, eta = 200. The tSNE plot was visualized with ggplot2 (v.3.2.0) [https://ggplot2.tidyverse.org/].
2.6 Differentially methylated region and gene ontology analysisDifferentially methylated regions (DMRs) between epigenetic tumor classes were identified using DMRcate (v.1.20.0) [23], which ranks the most differentially methylated genomic regions using gaussian smoothing across adjacent CpG sites. For DMRcate, a model with coefficients using the following parameters and thresholds was created: lambda (genomic window length) = 1000 nucleotides, C (scaling factor) = 2, and probe false discovery rate (FDR) cutoff of less than 0.05. Results were ranked by Fisher's multiple comparison statistic and filtered for those DMRs with both FDR and Stouffer scores less than 0.001. DMRs were then annotated to the nearest gene transcriptional start sites, based on ENSEMBL genome annotations. Gene Ontology (GO) analysis of differentially methylated gene regions was performed using the gometh function in the missMethyl package [24].
2.7 ImmunohistochemistryImmunohistochemistry was performed on whole formalin-fixed, paraffin-embedded tissue sections using the following antibodies: desmin (Cell Marque, clone D33, undiluted, ER1 antigen retrieval), epithelial membrane antigen (EMA, Leica, clone GP1.4, undiluted, ER1 antigen retrieval), CD99 (Signet, clone CD99, 1:400 dilution, ER1 antigen retrieval), S100 (DAKO, polyclonal, 1:2000 dilution, no antigen retrieval), MUC4 (Millipore, clone 8G7, 1:500 dilution, ER1 antigen retrieval), somatostatin receptor 2A (SSTR2A, Abcam, clone UMB1, 1:2000 dilution, ER2 antigen retrieval), OLIG2 (Immuno Bio Labs, polyclonal, 1:200 dilution, ER1 antigen retrieval), glial fibrillary acidic protein (GFAP, DAKO, polyclonal, 1:3000 dilution, no antigen retrieval), synaptophysin (Cell Marque, polyclonal, 1:100 dilution, ER2 antigen retrieval), CD68 (Leica, clone 514H12, undiluted, ER2 antigen retrieval), cytokeratin AE1/AE3 (Dako, clone AE1/AE3, 1:100 dilution, ER1 antigen retrieval), cytokeratin CAM5.2 (Becton Dickinson, clone CAM5.2, 1:100 dilution, ER1 antigen retrieval), HMB45 (Dako, clone HMB45, undiluted, CC1 antigen retrieval), Melan A (Dako, clone A103, 1:10 dilution, ER1 antigen retrieval), MITF (Dako, clone D5, 1:200 dilution, ER1 antigen retrieval), myogenin (Cell Marque, clone F5D, undiluted, CC1 antigen retrieval), and Ki-67 (Dako, clone Mib1, 1:50 dilution, ER2 antigen retrieval). Immunostaining for desmin, EMA, CD99, S100, MUC4, SSTR2A, OLIG2, GFAP, synaptophysin, CD68, cytokeratin AE1/AE3, cytokeratin CAM5.2, Melan A, MITF, and Ki-67 was performed in a Leica BOND-III automated stainer. Immunostaining for HMB45 and myogenin was performed in a Ventana BenchMark Ultra automated stainer. Diaminobenzidine was used as the chromogen, followed by hematoxylin counterstain.
2.8 Kaplan-Meier survival plots and statistical analysesClinical outcomes were studied by Kaplan-Meier analysis using GraphPad Prism. The Kaplan-Meier survival analysis was stratified by epigenetic subgroup, and p value was calculated by Log-rank (Mantel-Cox) test. Statistical comparison of histologic and immunohistochemical features was performed by Mann-Whitney unpaired two-tailed t test using GraphPad Prism.
3 RESULTS 3.1 DNA methylation profiling reveals two epigenetic subgroupsWe performed genome-wide DNA methylation profiling on our previously published cohort of 20 primary intracranial mesenchymal tumors with FET-CREB fusions. The clinical and radiologic features of these 20 patients and the histopathologic and genomic features of the tumor cohort were previously reported in open access format – https://onlinelibrary.wiley.com/doi/10.1111/bpa.12918 [5]. Unsupervised hierarchical clustering of the DNA methylation profiles segregated these tumors into two epigenetically distinct subgroups: Group A consisting of 16 tumors and Group B consisting of 4 tumors (Figure 1A and Table 1).
 ‘Intracranial mesenchymal tumor, FET-CREB fusion-positive’ is composed of two distinct epigenetic subgroups. (A) Unsupervised hierarchical clustering of DNA methylation data from 20 intracranial mesenchymal tumors with FET-CREB fusion showing segregation into two epigenetic subgroups – Group A consisting of 16 tumors and Group B consisting of 4 tumors. Differentially methylated genomic regions between the two subgroups are annotated in Tables S1 and S2. (B) Dot plot of patient age at diagnosis stratified by epigenetic subgroup. (C). Dot plot of tumor anatomic location stratified by epigenetic subgroup. (D) Dot plot of fusion type stratified by epigenetic subgroup. (E). Differential methylation-based gene ontology analysis for the two epigenetic subgroups of intracranial mesenchymal tumors with FET-CREB fusion, represented in a bar plot of −log10 p values for the most differentially methylated gene networks
TABLE 1.
Clinical characteristics, tumor histopathologic features, and epigenetic subgroup for the 20 patients with ‘intracranial mesenchymal tumor, FET-CREB fusion-positive'
Patient ID
Age
Sex
Tumor location
Mucin-rich stroma
Predominant morphology
Fusion type
Epigenetic subgroup
ATF1 #1
12
M
Cerebral convexity (parietal)
No
Epithelioid/rhabdoid
EWSR1-ATF1
Group A
ATF1 #3
24
F
Cerebral convexity (occipital)
Yes
Epithelioid/rhabdoid
EWSR1-ATF1
Group A
ATF1 #4
13
F
Cerebral convexity (frontal)
Yes
Stellate/spindled
EWSR1-ATF1
Group A
ATF1 #5
34
F
Tentorium
No
Epithelioid/rhabdoid
EWSR1-ATF1
Group A
ATF1 #6
17
F
CP angle
No
Epithelioid/rhabdoid
EWSR1-ATF1
Group A
ATF1 #7
70
M
CP angle with spinal dissemination
No
Epithelioid/rhabdoid
EWSR1-ATF1
Group A
ATF1 #8
17
F
CP angle
No
Epithelioid/rhabdoid
EWSR1-ATF1
Group A
CREB1 #1
14
F
Lateral ventricle
Yes
Stellate/spindled
EWSR1-CREB1
Group A
CREB1 #2
39
F
Lateral ventricle
Yes
Stellate/spindled
EWSR1-CREB1
Group A
CREB1 #3
10
M
Falx (parietal)
Yes
Stellate/spindled
EWSR1-CREB1
Group A
CREB1 #4
14
F
Lateral ventricle
Yes
Stellate/spindled
EWSR1-CREB1
Group A
CREB1 #5
25
F
CP angle
Yes
Stellate/spindled
EWSR1-CREB1
Group A
CREB1 #6
14
F
Cerebral convexity (parietal)
Yes
Stellate/spindled
EWSR1-CREB1
Group A
CREB1 #7
12
M
Tentorium
Yes
Stellate/spindled
EWSR1-CREB1
Group A
CREM #2
14
F
Lateral ventricle
Yes
Stellate/spindled
EWSR1-CREM
Group A
CREM #4
30
M
Falx (frontal)
Yes
Stellate/spindled
EWSR1-CREM
Group A
ATF1 #2
9
F
Cerebral convexity (frontal)
Yes
Round cell
EWSR1-ATF1
Group B
CREM #1
15
F
Spinal cord (thoracic)
No
Epithelioid/rhabdoid
EWSR1-CREM
Group B
CREM #3
5
F
Cerebral convexity (frontal)
No
Round cell
EWSR1-CREM
Group B
FUS #1
4
F
Cerebral convexity (occipital)
No
Epithelioid/rhabdoid
FUS-CREM
Group B
3.2 Clinical and molecular characteristics of the two epigenetic subgroups
‘Intracranial mesenchymal tumor, FET-CREB fusion-positive’ is composed of two distinct epigenetic subgroups. (A) Unsupervised hierarchical clustering of DNA methylation data from 20 intracranial mesenchymal tumors with FET-CREB fusion showing segregation into two epigenetic subgroups – Group A consisting of 16 tumors and Group B consisting of 4 tumors. Differentially methylated genomic regions between the two subgroups are annotated in Tables S1 and S2. (B) Dot plot of patient age at diagnosis stratified by epigenetic subgroup. (C). Dot plot of tumor anatomic location stratified by epigenetic subgroup. (D) Dot plot of fusion type stratified by epigenetic subgroup. (E). Differential methylation-based gene ontology analysis for the two epigenetic subgroups of intracranial mesenchymal tumors with FET-CREB fusion, represented in a bar plot of −log10 p values for the most differentially methylated gene networks
TABLE 1.
Clinical characteristics, tumor histopathologic features, and epigenetic subgroup for the 20 patients with ‘intracranial mesenchymal tumor, FET-CREB fusion-positive'
Patient ID
Age
Sex
Tumor location
Mucin-rich stroma
Predominant morphology
Fusion type
Epigenetic subgroup
ATF1 #1
12
M
Cerebral convexity (parietal)
No
Epithelioid/rhabdoid
EWSR1-ATF1
Group A
ATF1 #3
24
F
Cerebral convexity (occipital)
Yes
Epithelioid/rhabdoid
EWSR1-ATF1
Group A
ATF1 #4
13
F
Cerebral convexity (frontal)
Yes
Stellate/spindled
EWSR1-ATF1
Group A
ATF1 #5
34
F
Tentorium
No
Epithelioid/rhabdoid
EWSR1-ATF1
Group A
ATF1 #6
17
F
CP angle
No
Epithelioid/rhabdoid
EWSR1-ATF1
Group A
ATF1 #7
70
M
CP angle with spinal dissemination
No
Epithelioid/rhabdoid
EWSR1-ATF1
Group A
ATF1 #8
17
F
CP angle
No
Epithelioid/rhabdoid
EWSR1-ATF1
Group A
CREB1 #1
14
F
Lateral ventricle
Yes
Stellate/spindled
EWSR1-CREB1
Group A
CREB1 #2
39
F
Lateral ventricle
Yes
Stellate/spindled
EWSR1-CREB1
Group A
CREB1 #3
10
M
Falx (parietal)
Yes
Stellate/spindled
EWSR1-CREB1
Group A
CREB1 #4
14
F
Lateral ventricle
Yes
Stellate/spindled
EWSR1-CREB1
Group A
CREB1 #5
25
F
CP angle
Yes
Stellate/spindled
EWSR1-CREB1
Group A
CREB1 #6
14
F
Cerebral convexity (parietal)
Yes
Stellate/spindled
EWSR1-CREB1
Group A
CREB1 #7
12
M
Tentorium
Yes
Stellate/spindled
EWSR1-CREB1
Group A
CREM #2
14
F
Lateral ventricle
Yes
Stellate/spindled
EWSR1-CREM
Group A
CREM #4
30
M
Falx (frontal)
Yes
Stellate/spindled
EWSR1-CREM
Group A
ATF1 #2
9
F
Cerebral convexity (frontal)
Yes
Round cell
EWSR1-ATF1
Group B
CREM #1
15
F
Spinal cord (thoracic)
No
Epithelioid/rhabdoid
EWSR1-CREM
Group B
CREM #3
5
F
Cerebral convexity (frontal)
No
Round cell
EWSR1-CREM
Group B
FUS #1
4
F
Cerebral convexity (occipital)
No
Epithelioid/rhabdoid
FUS-CREM
Group B
3.2 Clinical and molecular characteristics of the two epigenetic subgroups
Group A tumors were from 11 females and 5 males with a median age at diagnosis of 15 years (range 12–70 years) (Tables 1 and 2, Figure 1B). The tumors were located throughout the neuroaxis, including the cerebral convexities (n = 4), tentorium (n = 2), falx (n = 2), lateral ventricles (n = 4), and cerebellopontine angle (n = 4) (Figure 1C). Fusion partners were EWSR1-ATF1 (n = 7), EWSR1-CREB1 (n = 7), and EWSR1-CREM (n = 2) (Figure 1D). The 4 Group B tumors were exclusively from females with a median age at diagnosis of 7 years (range 4–15 years). The tumors were located along the cerebral convexities (n = 3) or spinal cord (n = 1). Fusion partners were EWSR1-ATF1 (n = 1), EWSR1-CREM (n = 2), and FUS-CREM (n = 1). As previously reported, these tumors all had near-diploid genomes [5], and we did not observe any recurrent chromosomal copy number changes among either epigenetic subgroup.
TABLE 2. Clinical features of the 20 patients with ‘intracranial mesenchymal tumor, FET-CREB fusion-positive’ stratified by epigenetic subgroup Clinical features Group A Group B All tumors Age at diagnosis (years) Median 15 7 14 Range 12–70 4–15 4–70 Sex Male 5 0 5 Female 11 4 15 Tumor location Cerebral convexity 4 3 7 Tentorium 2 0 2 Falx 2 0 2 Lateral ventricle 4 0 4 CP angle 4 0 4 Spinal cord 0 1 1 Fusion type EWSR1-ATF1 7 1 8 EWSR1-CREB1 7 0 7 EWSR1-CREM 2 2 4 FUS-CREM 0 1 1 3.3 Differential gene methylation analysis between two epigenetic subgroupsWe next determined all differentially methylated genomic regions (DMR) with a mean beta value difference of at least 0.3 between the two epigenetic subgroups, which yielded nearly 1100 such DMR (Tables S1 and S2). Gene Ontology analysis of the most differentially methylated genes between the two epigenetic subgroups revealed networks involved in Rho GTPase signaling (Figure 1E, Table S3), a pathway known to control cell growth, motility, and actin cytoskeletal remodeling.
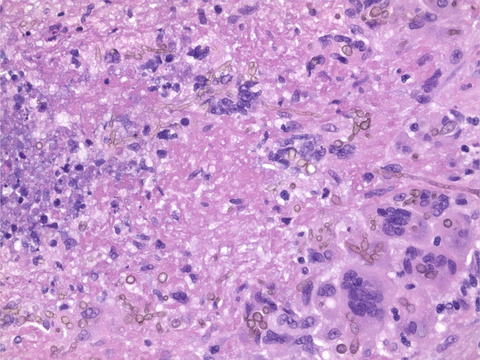
3.4 Histologic and immunophenotypic features of the two epigenetic subgroupsWe have previously described the wide morphologic spectrum of intracranial mesenchymal tumors with FET-CREB fusion, ranging from stellate/spindle cell to epithelioid/rhabdoid cytology along with variable stromal mucin content and hemangioma-like vasculature [5]. When comparing histologic features between the two epigenetic subgroups, no statistically significant differences were apparent (Figure 2, Table 3). The presence of a myxoid stroma did not strictly correlate with the epigenetic subgroups – 11/16 (69%) of the Group A tumors and 1/4 (25%) of the Group B tumors demonstrated a mucin-rich stroma. Hemangioma-like vasculature was only encountered in the Group A tumors (10/16 [63%]). Stellate/spindle cell cytomorphology was also only encountered in Group A tumors (10/16 [63%]).

Histologic features of intracranial mesenchymal tumors with FET-CREB fusion belonging to the two epigenetic subgroups. Hematoxylin and eosin-stained sections from three representative tumors of the two epigenetic subgroups
TABLE 3. Histologic features of ‘intracranial mesenchymal tumor, FET-CREB fusion-positive’ stratified by epigenetic subgroup Histologic feature Group A Group B All tumors Mucin-rich stroma 11/16 (69%) 1/4 (25%) 12/20 (60%) Collagenous stroma – intercellular matrix 16/16 (100%) 4/4 (100%) 20/20 (100%) Collagenous stroma – internodular septae 12/16 (75%) 2/4 (50%) 14/20 (70%) Epithelioid/rhabdoid morphology 8/16 (50%) 2/4 (50%) 10/20 (50%) Stellate/spindle cell morphology 10/16 (63%) 0/4 (0%) 10/20 (50%) Round cell morphology 0/16 (0%) 2/4 (50%) 2/20 (10%) Hemangioma-like vasculature 10/16 (63%) 0/4 (0%) 10/20 (50%) Staghorn/HPC-like vasculature 3/16 (19%) 1/4 (25%) 4/20 (20%) Pseudoangiomatous spaces 0/16 (0%) 0/4 (0%) 0/20 (0%) Dense lymphoplasmacytic cuffing 11/16 (69%) 1/4 (25%) 12/20 (60%) Hemosiderin/hematoidin 10/16 (63%) 3/4 (75%) 13/20 (65%) Meningioma-like whorls 4/16 (25%) 0/4 (0%) 4/20 (20%) Amianthoid fibers 2/16 (13%) 0/4 (0%) 2/20 (10%) Necrosis 1/16 (6%) 1/4 (25%) 2/20 (10%)The Ki-67 labeling index in this tumor cohort was generally low (less than 5%, 8 of the 15 evaluated tumors), but occasionally was elevated up to 15%–25% (7 of the 15 evaluated tumors) [5]. There was no significant difference in Ki-67 labeling index between the two epigenetic subgroups, though three of the four Group B tumors were those with elevated Ki-67 labeling index.
We also examined for any differences in immunophenotype between the two epigenetic subgroups (Table 4). Desmin, EMA, CD99, and CD68 expression was nearly ubiquitous among all tumors belonging to both subgroups, and MUC4 and synaptophysin expression was also frequent in both subgroups. Among the seven Group A tumors evaluated for MUC4 expression, three demonstrated diffuse strong staining, one demonstrated focal positivity, and two were negative. Among the four Group B tumors evaluated for MUC4 expression, three demonstrated focal positivity and one was negative. Among the seven Group A tumors evaluated for synaptophysin expression, three demonstrated patchy variable intensity staining while the other four were negative. Both of the two Group B tumors evaluated for synaptophysin expression demonstrated patchy variable intensity staining. None of the examined tumors belonging to either subgroup was positive for somatostatin receptor 2A (SSTR2A) expression or markers of melanocytic differentiation (MITF, Melan A, and HMB45). None of the investigated proteins had significantly different expression levels between Group A and Group B tumors, and further studies are necessary to identify potential immunohistochemical surrogates for segregating the two epigenetic subgroups.
TABLE 4. Immunohistochemical features of ‘intracranial mesenchymal tumor, FET-CREB fusion-positive’ stratified by epigenetic subgroup Protein marker Group A Group B All tumors Desmin 14/14 (100%) 3/3 (100%) 17/17 (100%) EMA 13/14 (93%) 3/3 (100%) 16/17 (94%) CD99 8/8 (100%) 2/2 (100%) 10/10 (100%) CD68 7/8 (88%) 1/1 (100%) 8/9 (89%) MUC4 4/7 (57%) 3/4 (75%) 7/11 (64%) Synaptophysin 3/7 (43%) 2/2 (100%) 5/9 (56%) S100 6/13 (46%) 1/4 (25%) 7/17 (41%) SOX10 0/6 (0%) 1/4 (25%) 1/10 (10%) MelanA 0/2 (0%) 0/4 (0%) 0/6 (0%) HMB45 0/4 (0%) 0/4 (0%) 0/8 (0%) MITF 0/1 (0%) 0/4 (0%) 0/5 (0%) Myogenin 0/6 (0%) 0/2 (0%) 0/8 (0%) SSTR2a 0/7 (0%)
留言 (0)