nan12776-sup-0001-All Supplementary Fig Info.docxWord 2007 document
, 3 MB
Table S1. List of α-adaptin antibodies used in the study and conditions for immunoblotting and immunohistochemistry experiments.
Table S2. Cases and controls (test cohort) used in this study from the University of Kentucky AD center biobank.
Figure S1. The expression levels of α-adaptin isoforms in different areas of the aging brain. The brain regions analyzed were substantia nigra (Subs. Nigra), sensory cortex (Sensory), motor cortex (Motor), frontal cortex (Frontal) and anterior cingulate cortex (Ant. Cingulate). 25 μg/sample of protein extracts from four subjects (case 14, 15, 17 & 18) were subjected to SDS-PAGE followed by immunoblotting. A-B, cropped images of immunoblots probed with antisera that detects AP2A1L&S (A, top panels; c. BD610501 and B, top panels; c. sc55497). C-D, cropped images of immunoblots probed with AP2A1L antibody (C, top panels; f. A706-727) and AP2A2 antibody (D, top panels; i. LSC156387). In A-D, bottom panels show cropped images of the immunoblots probed with β-actin antibody (internal loading control). In A-D, the colored schematic is the domain organization of the α-adaptin isoforms showing the positions of the sequences used to raise these antibodies (adapted from Fig. 1B).
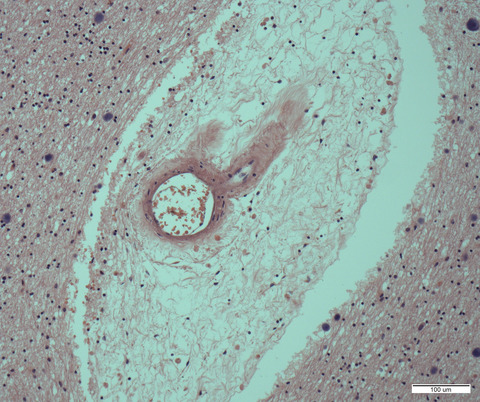
Figure S2. Brightfield immunohistochemical staining of AP2A2 in human brain sections. Photomicrographs show results of (j.C619-656) immunohistochemistry in the frontal cortex (Brodmann Area 9) from human brains. The antibody consistently labeled cells with microglial morphology. Whereas some of the stained structures appeared in clusters as though surrounding amyloid plaques (arrow in A), others appeared less reactive and not plaque-associated (B). Scale bar: A: 80 μm; B: 40 μm.
Figure S3. Immunofluorescence controls showing staining specificity. Shown are representative photomicrographs of immunofluorescence controls that were run lacking one primary antibody (separately for PHF-1, AP2A1L and AP2A2) but with three secondary antibodies (all antibodies at same concentrations, all other steps the same), to ensure that neither auto fluorescence nor antibody cross-reaction were leading to false-positive colocalization. These photomicrographs depict the temporal neocortex (Brodmann areas 21/22) of a Braak VI case (Suppl. Table 2). Panel A shows the same field in a brain section stained with the PHF-1 primary antibody but not the AP2A1L and AP2A2 primary antibodies. Panel B shows the same field stained with the AP2A1L primary antibody but not the PHF-1 and AP2A2 primary antibodies. Panel C shows the same field stained with the AP2A2 primary antibody but not the PHF-1 and AP2A1L primary antibodies. The samples contained secondary antibodies with the far-red, red and green fluorophores. Note that in panel A-C, there is only appreciable signal in the merged image on far right. Scale bars = 20 μm.
Figure S4. Imaris 3D segmentation and surface rendering for colocalization analysis of immunopositive surfaces. Panels A-D represent enlarged images of the same region represented in Fig. 6 of the main text. A) PHF-1 (cyan) was thresholded to exclude pixels detected in the no-PHF1 primary antibody control samples. B) AP2A1L (red) was thresholded to exclude pixels detected in the no- AP2A1L primary antibody control samples. C) AP2A2 (green) was thresholded to exclude pixels detected in the no- AP2A2 primary antibody control samples. A merged image of the channels is shown in (D). A smoothing feature as well as an adaptive thresholding with a local background subtraction was applied to each image. Lastly, a filtering step was applied to remove surfaces less than 65 μm^3 in volume thereby ensuring small neurites would not be included in the count of the number of PHF-1 immunopositive surfaces (A). All settings for the surface reconstruction were held constant for all the images acquired (A-D). White arrows = example of overlap between PHF-1[+] AP2A1L [+] surfaces. Scale bars = 10 μm.
Figure S5. Triple-label immunofluorescence staining & quantification: pTau (PHF-1), AP2A1L, and AP2A2. Representative photomicrographs from another AD case showing the localization of PHF1 (cyan; A); AP2A1L (red; B); and AP2A2 (green; C) proteins. Panel D shows the merged photomicrographs with light pink indicating signal overlap and colocalization. These photomicrographs depict the temporal neocortex (Brodmann areas 21/22) of a Braak VI case (Suppl. Table 2). The experiment was performed using antibodies specific for AP2A1L (f. A706-727), AP2A2 (j. C619-656) and pTau (PHF-1). In (A-D), bottom panels are enlarged images of boxed areas in corresponding top panels. PHF-1 was seen as expected in neurofibrillary tangles (arrows, panel A), neuritic threads, and colocalized substantially with AP2A1L (arrows, panels B & D), but not with AP2A2. Note that overlap between PHF-1 and AP2A1L is only partial - some PHF-1 and some AP2A1L signals are not colocalized (bottom panels A, B & D). Scale bars = 15 μm (Top panels, A-D) and 3 μm (Bottom panels, A-D). E) Box and whiskers plot showing the quantification of overlap volumes between PHF-1 [+] AP2A1L [+] and PHF-1 [+] AP2A2 [+] double immunopositive surfaces from 5 fields per sample. The plot shows the median value (bar) and quartiles (box), the whiskers show the minimum and maximum values of the range. The circles show the mean overlap volume of surfaces from 5 non-overlapping field of views (* indicates p-values <0.04 from an unpaired two-tailed t- test). The mean overlap volume between PHF-1 and AP2A1L was 30.3 ± 21.9 % and between PHF-1 and AP2A2 was 0.8 ± 1.7 %. F) Box and whiskers plot showing the quantification of overlap volumes between AP2A1L [+] PHF-1 [+] and AP2A1L [+] AP2A2 [+] double immunopositive surfaces from 5 fields per sample. The circles show the mean overlap volume of surfaces from 5 non-overlapping fields of view (* indicates p-values <0.02 from an unpaired two-tailed t- test). The mean overlap volume between AP2A1L and AP2A2 is 6.9 ± 9.6 % and between AP2A1L and PHF-1 was 65.9 ± 3.2 %.
Figure S6. The expression levels of α-adaptin isoforms in temporal cortex region of the aging brain. 25 μg/sample of protein extracts from five control cases (case 27,28,29,31 & 34) and five AD cases (case 30,32,33,35 & 36) were subjected to SDS-PAGE followed by immunoblotting. A, top panel shows photomicrograph of immunoblot probed with an antiserum that cross-reacts with all α-adaptin isoforms (g. LSC482433). A, bottom panel shows immunoblot probed with β-actin antibody (internal loading control). Box and whiskers plot showing densitometry analysis (using ImageJ) of AP2A1L signal (B, top panel), and AP2A1S or AP2A2 signal (B, bottom panel), in Braak 0&II (control) and Braak V&VI (AD) cases analyzed in A. The plot shows the median value (bar) and quartiles (box), the whiskers show the minimum and maximum values of the range. The circles/squares show the normalized density values of each of the five control and AD cases (ns indicates p-values <0.3 from an unpaired two-tailed t- test). In this convenience sample we did not see a significant difference in α-adaptin expression levels between control and AD cases.


留言 (0)