
記住我

α-synucleinopathies are a group of progressive neurodegenerative disorders characterized by misfolded α-synuclein that can serve as a scaffold that recruits endogenous α-synuclein to form pathologic inclusions and spread throughout the nervous system [1]. It includes Parkinson's disease (PD), the most common movement disorder in the elderly population [2]. Differential vulnerability in α-synucleinopathies has been shown in several anatomic brain regions, and within each region, only distinct neural populations are functionally and/or structurally affected by the presence of the pathology [3]. In PD, for example, the formation of α-synuclein-positive cytoplasmatic inclusions, called Lewy bodies (LBs), is a widespread feature detectable in dopaminergic (DA) neurons in the midbrain. However, only a subpopulation of DA neurons located in the Substantia Nigra pars compacta (SNpc) suffers from massive neurodegeneration in PD, compared with neighboring DA cells in the ventral tegmental area (VTA).
The inoculation of α-synuclein preformed fibrils (PFFs) into human cell cultures and mouse brains has been used to model the recruitment of endogenous α-synuclein into misfolded and aggregated LBs-like structures [4-7]. Studies of the spatiotemporal development of the α-synuclein pathology show that only specific neuronal phenotypes are involved in the spreading process, whereas others are able to confine the α-synuclein aggregates at the somatic level and restrict the subsequent spreading of the pathology to other connected areas. In particular, catecholaminergic neurons are more prone to uptake and spread exogenous α-synuclein compared with glutamatergic and GABAergic neurons [8].
Among catecholaminergic neurons, DA neurons and their selective vulnerability is a crucial topic in PD research, as the reduced availability of DA in the striatum is responsible for most, if not all, motor symptoms in PD patients [9]. This DA neuron selective vulnerability may be due to augmented sensitivity to intrinsic and extrinsic factors. For example, DA neurons are highly vulnerable due to their peculiar intrinsic cellular properties: a high metabolic demand to sustain their extensive axonal processes and mitochondria along with their widespread unmyelinated axons. Interestingly, LBs are also present in normal-aged brains, and a gradual but moderate loss of DA neurons, and/or reduced level of striatal DA, can be also observed in both healthy animals and humans during their lifetime [10, 11]. Among important extrinsic factors linked to PD vulnerability, microglia reactivity has been considered a key player [12].
To investigate the impact of seeding and the subsequent spread of misfolded α-synuclein along the nigrostriatal pathway, we studied the pathophysiologic effect induced by acute PFFs seeding into the midbrain. To model the progressive vulnerability of the DA neuron life span, we compare two cohorts of mice with different ages: 2-month old (young) and 5-month old (adult) mice.
2 MATERIALS AND METHODS 2.1 AnimalsHeterozygous TH-IRES-Cre transgenic mice were used in this study [13]. Two independent cohorts of mice were investigated: 2-month-old mice (defined as “young” group) and 5-month-old mice (defined as “adult” group). Five mice per group, for a total of four groups (young mice 1-month postinoculation [m.p.i.], young mice 2-m.p.i, adult mice 1-m.p.i., young mice 2-m.p.i.), were used in each set of experiments, if not indicated otherwise (Figure S1A). All animals were housed in groups under pathogen-free conditions, with food and water provided ad libitum (21 ± 2°C, at 12/12 h light/dark cycle). All experiments were approved by the Bavarian government (Az 55.2-1-54-2532-214-2016) and performed according to the animal protection law.
2.2 Preparation of preformed α-synuclein fibrilsThe α-synuclein monomers and PFF materials were prepared as previously described [14-16]. Briefly, the recombinant wild-type mouse α-synuclein was expressed in BL21 (DE3) Escherichia coli using a pRK172 plasmid (kind gift of Kelvin Luk and Virginia Lee, University of Pennsylvania, USA). BL21 (DE3) E. coli (Invitrogen, MA, USA) were transformed with the plasmid, and expression was induced with isopropyl-ß-D-thiogalactopyranose (IPTG, Peqlab, Erlangen, Germany). Cells were lysed by boiling after heat inactivation of proteases. After centrifugation, the supernatant was filtered through Filtropur S 0.2 filters (Sarstedt, Nümbrecht, Germany), loaded on a HiTrap Q HP anion exchange column (5 ml, GE Healthcare, Munich, Germany), and eluted with a linear 25–500 mM NaCl gradient. Synuclein-containing fractions were concentrated using VivaSpin 2-columns (Sartorius, Göttingen, Germany). The α-synuclein fraction was diluted to a concentration of 5 mg/ml in 50 mM Tris–HCl, pH = 7.0. After freezing in liquid nitrogen, the protein was stored at −80°C.
PFFs were assembled from purified α-synuclein monomers (5 mg/ml) by incubation at 37°C and centrifugation at 1400 rpm for 96 h and stored at −80°C [17, 18]. Directly before injection, an aliquot of PFFs was sonicated four times with a handheld probe (SonoPuls Mini 20, MS1.5, Bandelin, Berlin, Germany) according to the following protocol: amplitude 30%, time 15 s (pulse on 3 s, pulse off 6 s).
2.3 Stereotactic injection of preformed α-synuclein fibrilsTwo- and five-month-old TH-IRES-Cre mice were anesthetized with ketamine/xylazine (0.13/0.01 mg/g body weight) (WDT/Bayer Health Care, Garbsen/Leverkusen, Germany). In anesthesia mice were injected with 1 µl (5 µg) of PFFs into the SNpc (coordinates relative to Bregma: −3.0 mm anterior, +1.5 mm lateral, +4.2 mm beneath the dura) [19] of the right hemisphere using a 5 µl Hamilton syringe. Injections were performed at a speed of 100 nL/min with the needle left in place after injection for at least 5 min. The left hemisphere, as internal control, received 1 µl sterile phosphate-buffered saline (PBS). To verify the injection coordinates, TH-IRES-Cre mice were also bilaterally injected with PFFs and sterile PBS mixed with AAV1.CAG.FLEX.tdTomato.WPRE.bGH (AllenInstitute864, titer 1 × 10¹³ vg/ml, dilution 1:10).
2.4 Fast-scan cyclic voltammetryFast-scan cyclic voltammetry (FSCV) was used to investigate electrically evoked DA release in dorsolateral striatum ex vivo. Five TH-IRES-Cre mice from each of the experimental groups were analyzed, with the PBS-injected left hemisphere taken as an internal control for the PFFs-injected right hemisphere. Animals were sacrificed at 1 and 2 m.p.i. by cervical dislocation, and coronal brain slices (250 μm) containing the dorsal striatum were prepared as described previously [20, 21]. Slices were kept in oxygenated modified Kreb's buffer as follows (in mM): NaCl 126, KCl 2.5, NaH2PO4 1.2, CaCl2 2.4, MgCl2 1.2, NaHCO3 25, glucose 11, HEPES 20, L-ascorbic acid 0.4, at room temperature. For recordings, brain slices were kept at 32°C in a chamber perfused at a rate of 1.5 ml/min. Cylindrical carbon-fiber microelectrodes (50–100 μm exposed fiber) were prepared with T650 fibers (7 μm diameter, Goodfellow, Huntingdon, England) and sealed into a glass pipette. The carbon-fiber electrode was held at −0.4 V, and the potential was ramped to +1.2 V and back at 400 V/s every 100 ms. DA release was evoked by a rectangular, electrical pulse stimulation (if not specified otherwise: 400 μA, 1.2 ms, monophasic) generated by a DS3 Constant Current Stimulator (Digitimer, Hertfordshire, UK). Electrical stimulations were applied every 4 min by a bipolar electrode placed in the corpus callosum. The recording electrode was placed at a distance of ~100 μm from the stimulating electrode, within the dorsolateral striatum area. Data were collected using DEMON software [22]. Ten cyclic voltammograms of charging currents were recorded as a baseline before stimulation, and the average was subtracted from data collected during and after stimulation. Seeded/control part ratio of DA peak amplitude responses was obtained from four to eight control-seeded paired recordings across the rostral–caudal extent of the dorsolateral striatum and averaged for each mouse. The slope time constant of the evoked DA response was used as an index of DA uptake. Two to four of the most representative control/seeded area pairs were chosen for studying the kinetics for each mouse.
2.5 ImmunohistochemistryFive mice per group were sacrificed by transcardial perfusion at each time point, first with PBS followed by 4% PFA (w/v) in deep ketamine/xylazine anesthesia. Brains were removed and postfixed in PBS containing 4% PFA overnight before cutting 50-μm-thick coronal sections with a vibratome (VT 1000 S from Leica, Wetzlar, Germany). Floating sections were permeabilized with 2% Triton X-100 in PBS overnight at room temperature and blocked with 5% normal goat serum (Sigma Aldrich) and 4% BSA (bovine serum albumin, VWR) for 6 h on a shaker at room temperature. Primary antibodies (anti-α-synuclein-phospho-S129, rabbit polyclonal, Abcam, Cambridge, UK; anti-Tyrosine Hydroxylase, mouse monoclonal, Merck, Millipore, Darmstadt, Germany; anti-IBA1, Guinea Pig polyclonal, SYSY, Goettingen, Germany) were incubated for 48 h at 4°C. Slices were washed 3 × 10 min with PBS and then incubated with the secondary antibodies (goat anti-rabbit Alexa Fluor 488, goat anti-mouse Alexa Fluor 568, goat anti-guinea pig Alexa Fluor 647 Invitrogen, Life Technologies GmbH) overnight at 4°C. After 3 × 10 min washing in PBS, sections were finally washed for 3 × 10 min with PBS before mounting them on glass coverslips with Dako fluorescence conserving medium (Dako, Hamburg, Germany). The concentration used for all the antibodies was 1:500.
2.6 Confocal microscopyImages were acquired by using an LSM 780 microscope. Laser wavelengths used for excitation and collection range of emitted signals were as follows: Alexa fluor® 48–488 nm/500–550 nm; Alexa fluor® 568–568 nm/578–603 nm; Alexa fluor® 647–633 nm/long pass 670 nm, under a 40X oil objective (Plan-Apochromat 40x/1.4 oil DIC). For imaging of the midbrain, 3-dimensional 16-bit image stacks of 1024 × 1024 × 12 pixels tile (each tile: 212.34 × 212.34 × 12 µm) scans were acquired for the whole SNpc area of each hemisphere. For imaging of the striatum, three consecutively different positions along the dorsolateral striatum were acquired in each hemisphere as 3-dimensional 16-bit image stacks with a resolution of 1024 × 1024 × 12 pixels (each tile: 212.34 × 212.34 × 12 µm).
2.7 StereologyFor the quantification of TH-positive (TH+) neurons in SNpc, 3 brains from adult mice were collected 2 m.p.i., while Cavalieri estimator was used to estimate volume SNpc in both hemispheres. Brain sections outlines were carried out using a Zeiss fluorescent microscope (Imager.M2, ZEISS, Oberkochen, Germany) fully motorized and interfacing with a Dell computer running StereoInvestigator® (MBF Bioscience, Williston, Vermont, USA). SNpc cells labeled with corresponding markers were quantified in 8 serial coronal sections spaced 150 µm apart (section interval = 3), spanning the entire brain hemisphere. Outline and fiduciary marks were drawn at 2.5x magnification (EC-Plan-NEOFLUAR 2.5X/0.075, ZEISS, Oberkochen, Germany) to delineate reference points. Limits for areas of interest were drawn following a mouse brain atlas [23]. Cell counting was done blinded to genotype and treatment, at 63x magnification (Plan/APOCHROMAT 63X/1.4 Oil DIC, ZEISS, Oberkochen, Germany) using a 3D counting frame. See Table 1 for the parameters of stereological counting.
TABLE 1. Parameters for stereologic TH+ cell counting in the SNpc SNpc Counting frame Sampling grid size Coefficient of error (Gundersen), m = 1 Average cell counts/sampling site TH Control 50 × 50 × 12 µm 130 × 130 µm 0.12 1.08 Seeded 50 × 50 × 12 µm 130 × 130 µm 0.11 0.98 2.8 Imaris image processingThe 12-image z-stacks acquired by confocal microscopy were used to create detailed 3D surface reconstructions of TH+ DA somata and striatal terminals, IBA1+ microglia cells, and their processes as well as pS129+ α-synuclein aggregates. The image z-stacks were processed in Imaris software v9.3.1 (Oxford Instruments, Zurich, Switzerland) to display 3-color channel fluorescence in a 3D isometric view.
For processing the midbrain images, multiple tile acquisitions of the entire SNpc were analyzed from 3 different coronal slices (Bregma: −3.5, −3.1, and −2.7 µm) in each animal. The SNpc brain area (control and seeded side) was identified according to the Allen mouse brain atlas [19].
The SNpc region was manually selected based on the location of TH+ somata along with the image stack. For TH and IBA1 signals, the threshold intensity was defined by Imaris default parameters set on the PBS internal control hemisphere and applied to the corresponding PFFs-injected hemisphere. For the pS129 signal (used as a proxy signal for α-synuclein aggregates), the threshold intensity was set just above the detection of the background signal in the PBS internal control hemisphere and applied to the entire slice. Only pS129+ particles with a volume above 2 µm3 were included in this analysis.
For processing the striatal region, 3 different ROIs (212.34 × 212.34 × 12 µm) from 3 coronal slices (Bregma: 0.04, 0.64, and 1.24 µm) were analyzed for each animal, within the dorsolateral quadrant. TH− corticostriatal fiber bundle areas were excluded from the analysis. Similar to the SNpc, threshold levels for the TH and IBA1 signal intensities in striatal images were determined on the internal control side, while the pS129 signal intensity threshold was based on the intensity value just above the background signal in the corresponding internal control side. Only pS129+ particles volume above 0.5 µm3 and IBA1+ particles volume above 5 µm3 were considered in this analysis. The final measurements include (i) the volume covered by the TH+, IBA1+, and pS129+ expressed as a proportion of the corresponding brain area (SNpc and striatum) sampled; (ii) the number of TH+ and pS129+ particles. 3D colocalization between different signals was processed with custom MATLAB scripts.
2.9 Statistical analysisStatistical comparisons were performed using Prism 8.4.2 (GraphPad Software, San Diego, CA, USA). For DA release data from FSCV, two-way ANOVA followed by the Bonferroni post hoc comparisons were used to compare the percentage of DA release in the seeded side normalized by the control side over different seeding times. For the assessment of intergroup differences at single time points when ANOVA interaction was not significant, Student's t-test (two-sided) or LSD Fisher's test was applied. Statistical comparison of data collected from histologic analysis (IMARIS) was performed using MANOVA within the same brain region (SNpc and striatum) with the following independent factors: treatment (between factor: control vs seeded side), age (between factor: young vs old), and, when shown, anteroposteriorly (within factor: 3 levels with different bregma values) or TH colocalization (TH+ vs TH−). The normality of the distribution was tested in each group using D’Agostino–Pearson omnibus test. Values were calculated as the means between mice, each considered as the means of each 3 samples in SNpc and 12 samples in the striatum. For t tests, the variance between groups was tested (F test) and not found to be significantly different. Cumulative frequency distribution (CFD) for each mouse was calculated and averaged per group. Data are expressed as mean ± SEM unless otherwise indicated, with p < 0.05 defining differences as statistically significant (*p < 0.05, **p < 0.01, ***p < 0.001).
3 RESULTS 3.1 PFFs inoculation site in the nigrostriatal pathway confirmed by genetic labeling in midbrain and striatumA single injection of recombinant α-synuclein PFFs into the wild-type mouse brain is already enough to trigger an LB-like pathology. We chose to use wild-type mouse α-synuclein PFFs because they are able to induce pathology in mice within weeks, whereas human α-synuclein requires months to trigger pathology [4, 24, 25]. α-synuclein strains derived from humans or mice can interfere with each other, mitigating aggregate formation if the injected exogenous α-synuclein is not from the same species as expressed in the host [24, 26].
To verify that PFFs or PBS were successfully injected into SNpc and to navigate the FSCV recording site in the striatum, we mixed AAV1.CAG.FLEX.tdTomato.WPRE.bGH (AAV-tdTomato) with the seeding material for the stereotactic injection (Figure 1A). Upon Cre-induced recombination, DA neurons in SNpc expressed the tdTomato fluorescent protein 1 m.p.i. (Figure 1B), indicating that the seeding material was taken up by SNpc neurons. Before conducting the FSCV recording at each time point, striatal slices were investigated under an epi-fluorescence stereoscope (Figure 1C,D). The TH terminals of the contralateral, as well as the ipsilateral sides in the striatum, were also successfully labeled, which allowed recording DA release in the tdTomato-positive dorsolateral striatum (Figure 1E). Note that the injection in the midbrain also targeted the mesocorticolimbic pathway; fluorescent labels in the ventral tegmental area (VTA) and Nucleus Accumbens (NAc) were apparent as well. Samples without a clear expression of tdTomato in the dorsolateral striatum were not used for data collection.

Experimental inoculation of PFFs/or PBS/tdTomato reporter was validated for ex vivo electrically evoked striatal DA release. Experimental (A) scheme and expression of fluorescent tdTomato in the midbrain (B), in ex vivo striatal slice ipsilateral to the PFFs hemisphere (C, seeded side), and ipsilateral to PBS-injected hemisphere (D, control side). The FSCV setup and striatal recording site in the dorsolateral striatum (E). Representative traces of electrically evoked DA release with current/voltage (CV) curves in the insets in young mice (2-month-old) at 1 m.p.i. (F) and 2 m.p.i. (G) and adult mice (5-month-old) at 1 m.p.i. (H) and 2 m.p.i. (I). Evoked DA release ratio in seeded side normalized by their internal control side, at different postseeding time points in young and adult mice (J). Only in the adult mice, DA release shows a significant reduction ([DA]e: Control = 1.852 ± 0.2573, Seeded = 1.424 ± 0.2448, paired Student t test: t(6) = 4.56, **p < 0.01) 2 m.p.i. The slope time constant of DA uptake rate following the evoked release (K), expressed as the percentage in seeded side normalized by their internal control side, was not affected by PFFs inoculation (p > 0.05). n = 5 mice per group, 3–5 technical repetitions per hemisphere in each animal
3.2 Unilateral PFFs inoculation in SNpc affects ipsilateral striatal DA release in adult miceDysfunction of striatal DA release in both α-synuclein overexpressing and knockout animal models [27-29] has been shown, but it remains unclear how seeding of α-synuclein PFFs in the SNpc would affect the DA release in the striatum. Although there are studies exploring striatal DA contents with HPLC in seeding models [4], we used FSCV to study the DA neurotransmission with a more sensitive temporal (subsecond) and spatial (in the dorsolateral striatum, the projecting site of SNpc neurons) resolution.
Thus, we investigated whether the ex vivo striatal DA release recorded by FSCV would change following PFFs inoculation in SNpc in young [30] and adult (5-month-old) mice, at 1 and 2 m.p.i., respectively. The results are presented as the percentage of DA release in the PFFs seeded side normalized to the PBS-injected internal control side (Figure 1F–K). In young mice, the striatal DA release was unchanged 1 and 2 m.p.i. (Figure 1J, left histogram pair: p > 0.05) compared with the internal control. In adult mice, DA release was unchanged 1 m.p.i. but displayed a remarkable decline at 2 m.p.i. compared with the control side (Figure 1J). The kinetic of DA uptake (slope time constant), strictly dependent on the DA transporter (DAT) activity, was comparable in both young and adult groups (Figure 1K).
3.3 In adult DA neurons, unilateral PFFs inoculation led to low somatic α-synuclein deposition and higher spreading along the nigrostriatal DA pathwayTo investigate the potential cause of the differential striatal DA release rates in young and adult mice, we analyzed the distribution of α-synuclein aggregates in SNpc and striatum, in both young and adult mice. First, we compared the volume covered by α-synuclein aggregates between hemispheres. Although DA terminals from the SNpc project mainly ipsilaterally, at least 1–3% of the DA fibers reaching the striatum originate from the contralateral SNpc [31, 32]. Within the time windows, we analyzed our samples, aggregates formed nearly exclusively in the hemisphere ipsilateral to the PFFs inoculation (Figure 2A–D), whereas aggregates in the contralateral hemisphere were rarely detected (Figure S1A–D). Moreover, the spreading of α-synuclein from the SNpc did not reach the motor cortex as well (Figure S2). These evidence validate the hemisphere injected with PBS as a valid internal control, allowing us to use the hemisphere contralateral to the PFFs injection to define the thresholds for our quantification and exclude experimental errors, interindividual variability, and experimenter bias from our result interpretation.

Representative images of immunohistochemistry staining in seeded SNpc and striatum of young and adult mice. Confocal acquisition of tile scanned SNpc reconstruction (left, scale bar: 100 µm) and dorsolateral striatum (right, scale bar: 20 µm) coronal area sections. Phospho-α-synuclein (pSyn) in green, Tyrosine Hydroxylase (TH) in magenta, and respective merged images. (A) Young and (B) adult brain areas, 1 m.p.i. (C) Young and (D) adult brain areas, 2 m.p.i.
Pathologic α-synuclein aggregates developed and accumulated 1 m.p.i. in PFFs-injected midbrains of both young (Figure 2A) and adult mice (Figure 2B). However, α-synuclein deposition in SNpc was more pronounced in young compared with adult mice (Figure 3A,B). Compared with 1 m.p.i., the formation of aggregates 2 m.p.i. in SNpc increased even more in young (Figure 2C) but not in adult DA neurons (Figures 2D and 3C,D).

Distribution of α-synuclein aggregates from SNpc to striatum and stereologic counting of DA neurons. Volume covered by α-synuclein aggregates in SNpc and striatum in young mice at 1 m.p.i. (A) and 2 m.p.i. (B), and in adult mice at 1 m.p.i. (C) and m.p.i. (D). Volumes covered by α-synuclein aggregates in the PFFs-injected hemisphere were always significantly higher than the respective contralateral PBS-injected sides (MANOVA Laterality Main Factor: +++p < 0.001). After 1 m.p.i., α-synuclein deposition in SNpc was more pronounced in young compared with adult mice, accumulating even more in young than in adult DA neurons at 2 m.p.i. (MANOVA significance in SNpc. Interaction treatment × inoculation time: F(1, 1) = 5.17, *p < 0.05; interaction treatment × age: F(1, 1) = 16.41, **p < 0.001. In the figures, LSD test: ##p < 0.01 for comparison between different inoculation times of the same age; **p < 0.01, ***p < 0.001 for comparison between different ages of the same inoculation time). In striatum, α-synuclein significantly accumulated more in adult compared with young mice, especially 1 m.p.i. (MANOVA significance in the striatum. Interaction treatment × anteroposteriorly: F(1, 2) = 5.26, *p < 0.01; interaction treatment × age: F(1, 1) = 12.21, **p < 0.001. In the figures, LSD test: #p < 0.05, ###p < 0.001 for comparison between different inoculation of the same age; *p < 0.05, ***p < 0.001 for comparison between different age of the same inoculation time). n = 5 mice/group, 3 technical repetitions for SNpc, and 9 for striatum per hemisphere in each animal. Unbiased stereologic cell counting in adult mice at 2 m.p.i. (E) Estimated TH+ cells. (F) and estimated volume of SNpc in the seeded side and its internal control side. n = 3 mice per group
In the striatum, α-synuclein significantly accumulated more in adult mice, 1 m.p.i. (Figures 2A,B and 3A,B). This suggests that within the first month after inoculation, the spreading of α-synuclein pathology was significantly more pronounced in adults compared with what was observed in young DA terminals. The distribution of aggregates in the striatum of young DA terminals did not change obviously from 1 to 2 m.p.i. (Figure 2C), instead, it decreased in adult DA terminals to a level comparable with the one observed in young mice (Figure 2D) at 2 m.p.i. (Figure 3A–D). As suggested previously [8], the inclusion formation after a single PFFs injection is likely to be transient in wild-type mice as healthy subjects are capable of eliminating the misfolded forms of α-synuclein pathology, within tolerable levels of deposition. Our results highlight that this process can weaken with age. This can be a critical point where the physiologic adaptation may turn into pathology onset, especially when other factors are considered (genetic mutation, environmental stressors, etc.).
Besides, we also quantified the number of aggregates for each group (Figure S3). The number of aggregates in striata of young mice (Figure S3A) was significantly lower compared with adult mice (Figure S3B) 1 m.p.i. but not compared with 2 m.p.i. (Figure S3C,D). This suggests that adult brains accumulate less intracellular α-synuclein aggregates compared with young brains, leading to early prominent spreading of α-synuclein pathology from SNpc to the striatum.
To understand if the reduced striatal DA release in adult mice at 2 m.p.i. was caused by DA neuronal loss in SNpc, we further determined the number of TH+ DA neurons via unbiased stereologic quantification. Results showed that the number of TH+ DA neurons in the seeded side of SNpc was not significantly different from the control side (Figure 3E). The estimated SNpc volume (Figure 3F) was also statistically comparable between the seeded and the control sides.
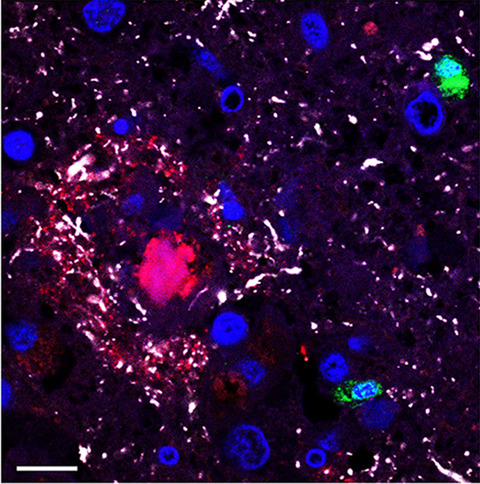
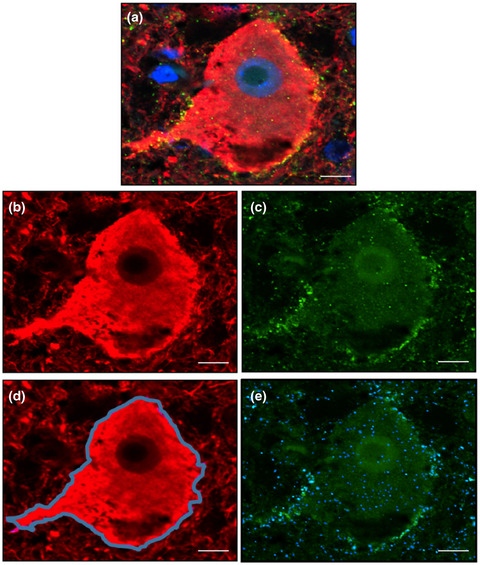
Data from the colocalization analysis showed that phospho-α-synuclein (pSyn) positive aggregates mostly accumulated in TH+ neurons (Figure 4A). There were approximately 87% of aggregates located in the cell body and axons of TH+ neurons in the SNpc of young mice at 1 m.p.i., but 2 m.p.i. (Figure 4B) it increased to 92%. In adult mice, about 88% of the aggregates developed in TH+ structures in SNpc 1 m.p.i. and dropped to about 36% after 2 m.p.i. (Figure 4C), with a nonsignificant increase of overall aggregates volume.

Colocalization of phospho-α-synuclein and Tyrosine Hydroxylase (TH) revealed different aggregate formations between young and adult DA neurons. Representative confocal images from SNpc (left) and dorsolateral striatum (right) areas of young (top) and adult (bottom) mice, 1 and 2 m.p.i. (A). Phospho-α-synuclein (pSyn) in green, TH in magenta and respective merged images. α-synuclein/TH colocalization in SNpc was ~87% and ~92% in young mice, from 1 to 2 m.p.i., respectively (B). In adult mice α-synuclein/TH colocalization in SNpc was ~88% and ~36% in young mice, from 1 to 2 m.p.i., respectively (C) (MANOVA significance in SNpc. Interaction Age × TH Co-localization × Seeding time: F(1, 1) = 8.71, *p < 0.01. In the figures, Bonferroni post hoc test: ##p < 0.01, ###p < 0.001 for comparison of aggregates in TH+ volume coverage between different inoculation of the same age; ***p < 0.001 for comparison of aggregates in TH+ volume coverage between different age of same inoculation time). α-synuclein / TH co-localization in Striatum was ~99% and ~92% in young mice, from 1 to 2 m.p.i., respectively (D). In adult mice α-synuclein/TH colocalization in SNpc was ~91% and ~92% in young mice, from 1 to 2 m.p.i., respectively (E) (MANOVA significance in the striatum. Interaction TH Colocalization × seeding time: F(1, 1) = 4.37, p < 0.05. In the figures, LSD test: ###p < 0.001 for comparison of aggregates in TH+ volume coverage between different inoculation times of the same age; **p < 0.01 for comparison of aggregates in TH+ volume coverage between different ages of the same inoculation time). Scale bars: for SNpc, 100 µm; for striatum, 20 µm. n = 5 mice per group, 3 technical repetitions for SNpc, and 9 for striatum per hemisphere in each animal
In the striatum, the young group showed approximately 99% colocalization of aggregates and TH+ terminals 1 m.p.i. and around 92% after 2 m.p.i. (Figure 4D), with no significant change in overall aggregate volume. While in adult mice, the TH+ area colocalizing with aggregates was about 91% 1 m.p.i. (Figure 4E), which was slightly less than that in young mice. At 2 m.p.i., the TH+ area covered by aggregates was significantly reduced in adult mice, although with a similar colocalization of 92%, which was comparable with the level in young mice.
3.4 In the striatum, the composition of TH+ terminals changed differently between young and adult DA innervation during α-synuclein spreadingWe analyzed the volume covered by the TH+ terminals in the dorsolateral striatum in both young and adult mice. We found a nonsignificantly reduced TH+ axonal coverage in the striatum of young mice 1 m.p.i. (Figure 5A), whereas the reduction became significant after 2 m.p.i. (Figure 5B). In adult mice, a nonsignificantly reduced TH+ axonal coverage (Figure 5C) was observed 1 m.p.i., but this trend did not reach significance even after 2 m.p.i. (Figure 5D).

Striatal DA innervation modifies following PFFs inoculation in SNpc only in young DA neurons. Quantification of dorsolateral striatal volume covered by TH+ structures in young mice at 1 m.p.i. (A) and 2 m.p.i. (B), and adult mice at 1 m.p.i. (C) and 2 m.p.i. (D). In both groups, 1 m.p.i. revealed a nonsignificant trend of reduced DA innervation in the striatum ipsilateral to the inoculation. At 2 m.p.i., young mice showed a significant reduction of TH+ innervation, compared to adult mice where the innervation in the seeded hemisphere was comparable to the internal control hemisphere (unpaired t test T(8) = 4.199, **p < 0.01). The cumulative frequency distribution (CFD) curves were calculate per each mouse and averaged for each group (±SEM expressed with light color lines). CFD of TH+ terminal sizes showed significant left-shifted curves in the seeded side, revealing a higher proportion of small terminals in young striata at 1 (E, two-way ANOVA Main Factor Treatment F(1, 160,008) = 18,960, p < 0.001; In the figure LSD test: *p < 0.05, **p < 0.01, ***p < 0.001) and 2 m.p.i. (F, two-way ANOVA Main Factor Treatment F(1, 160,008) = 38,852, p < 0.001; In the figure LSD test: *p < 0.05, **p < 0.01, ***p < 0.001). In adult mice, CFD curves of TH+ terminal sizes in the seeded side were significantly left shifted at 1 m.p.i. (G, two-way ANOVA Main Factor Treatment F(1, 160,008) = 9780, p < 0.001; in the figure LSD test: *p < 0.05, **p < 0.01) but not in adult striata at 2 m.p.i. (H, p > 0.05). No difference was detected between the seeded and internal control side. n = 5 mice per group, 3 technical repetitions for SNpc, and 9 for striatum per hemisphere in each animal
To understand if the PFFs inoculation affected a specific population of terminals, we further compared the cumulative frequency distributions (CFD) of the size (µm3) of the 3D reconstructed TH+ striatal terminals. The CFD was calculated per mouse and averaged for each group. In the young mice, the CFD curve of the ipsilateral seeded side was significantly left-shifted compared with the contralateral control side 1 and 2 m.p.i. This result indicates that the portion of small-sized terminals was always significantly higher in the hemisphere ipsilateral to the PFFs inoculation (Figure 5E) and also after 2 m.p.i. (Figure 5F).
However, adult mice displayed a different profile of the CFD pattern of TH+ terminals, which showed a smaller shift of significant differences of terminal size between the ipsilateral PFFs-injected side and the control side 1 m.p.i. (Figure 5G). While at 2 m.p.i., there was no significantly changed terminal distribution in adult mice (Figure 5H).
These results indicate that PFFs inoculation triggered modification in the striatal terminal density of young mice from 1 to 2 m.p.i., decreasing specifically large-sized terminals. Whereas, in the adult mice, this effect gradually disappears from 1 to 2 m.p.i.
3.5 Coverage of microglia in the PFFs-seeded side showed reduced neuroinflammatory reactivity around adult DA terminalsTo better understand the relationship between the seeding-induced alterations observed along the nigrostriatal pathway and the age-dependent microglial activation, we further quantified microglia coverage at each time point after PFFs inoculation in young and adult mice. In a previous pilot study, we did not observe any strong GFAP immunoreactivity in the SNpc or in the striatum, in either baseline and postseeding conditions (Figures S4 and S5). Likely, the reactivity of the microglia starts earlier than the astrogliosis, whereas astrocytic reactivity to α-synuclein spreading takes place later in the development of the pathology. Because we wanted to focus on the very early stage of the pathology spreading using the contralateral hemisphere as internal control, the role of astrocytes in the α-synuclein early stage of spreading would not be possible to investigate with our experimental design. Thus, we considered IBA1+ microglial coverage volume as a readout to evaluate the activation of microglia.
In young mice, the volume of microglial coverage in SNpc (Figure 6A) was always higher compared with the control side (Figure 6B). Considering the different patterns of aggregate formation observed in SNpc between young and adult mice, the high level of microglial activation coincided with the efficient formation of aggregates in young mice. While in adult mice, the lower level of activated microglia was accompanied by less α-synuclein deposition compared with young mice.

Microglial coverage volume increased in young mice, while adult mice showed limited microglial reactivity. (A) Representative images of IBA1 immunohistochemistry staining (left) and IBA1 merged with TH in SNpc in young (top rows) and adult (bottom rows) mice at different m.p.i. Scale bar: 100 µm. (B) at 1 and 2 m.p.i. revealed a significantly higher IBA1 coverage in young mice (two-way ANOVA Main Factor Age F(1, 16) = 6.366; *p < 0.05). (C) Representative images of IBA1 and TH immunohistochemistry staining in the striatum of young (top rows) and adult (bottom rows) mice at different m.p.i. Scale bar: 20 µm. Analysis of the microglia coverage volume in SNpc. In the striatum (D), the coverage volume of microglia in dorsolateral regions is higher in young compared with adult mice at 2 m.p.i. (two-way ANOVA Main Factor Age F(1, 16) = 6.366; *p < 0.05). Reactivity values are expressed as the ratio of microglia coverage volume in the seeded side normalized by each internal control side. n = 5 mice per group, 3 technical repetitions for SNpc, and 9 for striatum per hemisphere in each animal
In the striatum (Figure 6C), the volume covered by microglia in young mice was constantly larger than the control side, which is similar to the phenomena in SNpc. While in the adult mice, the microglial coverage volume was increased at 1 m.p.i. and became comparable with its control side after 2 m.p.i. (Figure 6D). Notably, the high level of microglial coverage coincided with a decreased DA terminal density in young mice. While in the adult mice, lower coverage of microglia is associated with an unchanged DA terminal innervation.
4 DISCUSSIONOur study aims to model the early presymptomatic stage of α-synuclein spreading, investigating the effects of acute PFFs seeding on α-synuclein pathology distribution, microglia reactivity, and neurotransmission associated with the nigrostriatal neurons. Our results showed a direct link between α-synuclein pathology spreading induced by seeding with reduced striatal DA release specifically in adult mice. Although α-synuclein pathology can affect a number of different neuronal populations in the brain, the mesostriatal DA neurons are critically important for the clinical development of PD. According to the Braak staging theory, the development of pathology does not follow a random pattern but, typically, the inclusions emerge with a topographical pattern which is classified as a six-stage progression [33]. In particular, stage 3 is characterized by Lewy body appearance in the midbrain before any occurrence in the cortex, and it is associated with the first appearance of motor symptoms.
At first, α-synuclein PFFs were inoculated into the midbrain and DA release was measured in the dorsolateral striatum. This area receives nigrostriatal afferents that are more sensitive to α-synuclein-dependent insults [34, 35]. Note that our FSCV studies were performed on striatal coronal slices where dopamine axons are functionally disconnected from the soma. Therefore, these results demonstrate that α-synuclein spreading toward DA axons affects neurotransmission at the terminals independently of any other changes in the DA neuronal activity due to the PFFs seeding. Interestingly, we found that electrically evoked DA release was significantly decreased by approximately 25% only in seeded adult striata 2 m.p.i., compared with their internal control side. The DA uptake rate in each group was similar to the internal control side.
Assuming the existence of a pathophysiologic phenotype in adult DA neurons, then we verified if α-synuclein pathology developed with different dynamics between adult and young DA neurons. First, we observed that the amount of α-synuclein aggregates detected in the internal control side was always extremely low in each group at each time point. This indicates that at least after 2 m.p.i., the pathology was restricted to the hemisphere ipsilateral to the PFFs inoculation, which validates the contralateral hemisphere as a proper internal control.
We observed 1 m.p.i. in SNpc that phospho-α-synuclein positive aggregates already formed in the SNpc ipsilateral to the PFFs injection in both young and adult mice. However, according to our quantification, α-synuclein aggregates covered more volume in SNpc of young mice compared with adult mice. At the same time, we confirmed that the spreading of aggregates in the striatum was significantly elevated in adult DA neurons compared with the young ones. These results suggest that in young DA neurons, the misfolded α-synuclein proteins were more prone to accumulate into highly condensed somatic aggregates and propagate less to the striatum, compared with adult DA neurons.
At 2 m.p.i., we observed an increased accumulation of aggregates in the SNpc area, although it was significantly higher in young than in adult DA neurons. This result further supports the idea that pronounced α-synuclein deposition in SNpc is associated with a low propagation of the pathology into the striatum.
In the striatum, most of the α-synuclein aggregates were localized in the TH+ area, and never observed in the postsynaptic medium spiny neurons (MSNs) of the dorsolateral striatum. MSNs represent more than 95% of the neuronal population of the striatum and, as GABAergic neurons, they are mostly spared from developing Lewy body pathology [36-40]. Moreover, the absence of aggregates in the postsynaptic striatal neurons suggests that the spreading of α-synuclein in the first 2 months after PFFs seeding between midbrain and striatum was essentially anterograde. Therefore, we did not extend our investigation to the Substantia Nigra pars reticulata, where the majority of the striatonigral synapses reside [41].
In adult mice, the propagation of misfolded α-synuclein into striatum was significantly higher at 1 m.p.i. compared with the contralateral internal control, and eventually, it decreased after 2 months. It seems that the striatal neuronal network in seeded adult neurons was able to cope with the high spreading of aggregates from SNpc at 1 month, so the presence of aggregates cannot account for the decrease in DA neurotransmission but may function to protect the terminals from the increased concentration of harmful, soluble oligomers. In fact, αSyn may exist in different forms in neurons, from monomers to soluble multimers, and some forms of αSyn oligomers may be responsible for toxicity that affects presynaptic vesicle composition and release [42]. It has been shown that α-synuclein oligomers are able to decrease synapsin SYN1 and SYN2 gene expression, which in turn decreases two transcription factors, cAMP response element binding and Nurr1, that regulates synapsin gene promoter activity [43]. Moreover, transgenic overexpression of α-synuclein oligomers in DA presynaptic terminals leads to enhanced age-dependent spreading pathology accompanied by behavioral abnormalities, reduced striatal DA content, and DA neuron loss [44]. Notably, these mice were monitored starting from 3 months and motor impairments were detected only between 14 and 24 months of age. Our findings are in accord with these prior studies showing a very early impact of the spreading α-synuclein pathology on the ability of striatal terminals to release DA. They also open the likelihood that early adaptive mechanisms might take place at the beginning of the spreading process and affect the evolution of the pathology.
Further, DA neurotransmission in young mice was not affected by the PFFs inoculation, and their preserved ability to release DA correlated with a constant, low density of striatal α-synuclein aggregates in the striatum.
In PD cases, as the disease progresses, neuronal or terminal loss usually accounts for the decreased DA neurotransmission in the striatum, which further contributes to the onset of motor dysfunctions. In adult mice 2 m.p.i., the total number of TH+ DA neurons in SNpc did not change significantly, implying that the decreased striatal DA release was not caused by neuronal loss in SNpc, which is consistent with previous results [25] but adds to the existing knowledge that α-synuclein-dependent early synaptic alterations precede neurodegeneration.
Surprisingly, when we analyzed the DA innervation in dorsolateral striatum, the volume covered by TH+ terminals significantly decreased in young mice, but not in the adults.
While the loss of DA innervation in the striatum is the principal cause of PD motor symptoms [45], early loss of neurons from SNpc is not directly associated with any clinical sign of the disease. Motor deficits in PD pat
留言 (0)