
記住我


This study included patients who fulfilled the following inclusion criteria: (1) underwent preoperative 3 T pancreatic MRI; (2) MRI showed the pancreatic lesion was resectable or borderline resectable lesions according to NCCN criteria [14]; (3) underwent surgery and histological confirmation as PDACs; (4) their largest regional lymph node was <10 mm in short-axis diameter at pancreatic MR imaging; (5) did not receive chemotherapy or radiotherapy before surgery and MRI; (6) < 1 month between imaging and surgery; (7) had available diagnostic quality images for measuring lesions, without any severe motion of metallic artifacts. The regional lymph nodes in pancreatic head and uncinate cancer included lymph nodes along the common bile duct, common hepatic artery, portomesenteric vein and pancreaticoduodenal arcades. The regional lymph nodes in pancreatic body and tail cancer included lymph nodes along the common hepatic artery, celiac axis, splenic artery, and splenic hilum [15]. More remote nonregional lymph nodes, such as infrarenal or retroperitoneal lymph nodes in a paraaortic location or lymph nodes on the left of the superior mesenteric artery within the jejunal mesentery, equated to distant metastatic disease and was not included in our study [16]. A total of 127 consecutive patients with histopathologically diagnosed PDAC meeting inclusion criteria were included in the study between January 2011 and June 2019. Patients were allocated to the training and testing groups according to the time of surgery in a 2:1 ratio, where the first 82 patients were allocated to the training group, and the subsequent 45 patients were allocated to the testing group. The individual patients were regarded as the unit of analysis and classified as groups of lymph node metastases and non-lymph node metastases according to the pathologic diagnosis of lymph nodes. The complete patient enrollment process is shown in Fig. 1. The clinical characteristics of all patients are shown in Table 1. The study was approved by the institutional review board of our hospital. The requirement for informed consent was waived.
Fig. 1 Table 1 Characteristics of the patients in the training and testing groupsMR imaging technique
MR examinations were performed on a 3 T MR system (Discovery 750; GE Healthcare, Waukesha, WI, USA) with 8-channel phased-array receiver coils in the supine position. The MR imaging protocol consisted of routine pancreatic imaging sequences and DW imaging sequences. The conventional MRI protocols included the following sequence: (1) a respiration-triggered axial T2-weighted fast spin-echo (FSE) (TR/TE, 8000/109 ms; matrix, 288 × 256; NEX, 4; slice thickness/gap, 5/1 mm); (2) pre-contrast imaging including fat-suppressed (FS) T1-weighted imaging were obtained with a 3D lava-flex sequence in one breath-hold (TR/TE, 3.2/2 ms; matrix, 256 × 192; NEX, 1; slice thickness/gap, 5/−2.5 mm); (3) dynamic contrast-enhanced MRI was acquired using lava-flex sequence (TR/TE, 3.2/2 ms; matrix, 256 × 192; NEX, 1; slice thickness/gap, 5/−2.5 mm); arterial, portal vein and delayed phase imaging were obtained approximately 25 s, 60 s and 2 min, respectively, after the start of contrast material administration. Intravenous injection of gadolinium-diethylenetriamine pentaacetic acid (DTPA) (Magnevist; Bayer Schering, Berlin, Germany) at 0.1 mmol/kilogram of body weight and flow rate 2 ml/s was used, followed by a 15-ml saline flush.
DWI was performed before enhanced imaging. Axial DWI was acquired by a respiratory triggered free-breathing single-shot echo-planar imaging using the navigator echo technique. The sequence parameters were as follows: TR/TE, 7000/60 ms; slice thickness/gap, 3/0.5 mm; the number of gradient directions of 3; FOV of 390 × 310 mm, the bandwidth of ± 250 kHz; flip angle of 90°; the integrated parallel acquisition techniques imaging option with a factor of 3; fat suppression technique; distortion correction technique to avoid artifacts; the NEX of b = 0–800, 1000, 1200, and 1500 s/mm2 were 1, 2, 4, and 6, respectively; a total of 10 b values (0, 20, 50, 100, 200, 600, 800, 1000, 1200, and 1500 s/mm2).
Image analysisAll images were reviewed using a local picture archiving and communication system. The reviewers were blinded to the clinical data, imaging results, and final diagnosis of lymph nodes; however, they were aware that the study population was PDAC. All MR images were independently analyzed and recorded by two abdominal radiologists (Dr. SS Sun and Dr. B Zhao with 6 and 4 years of experience reading abdominal MR images). Quantitative variables were recorded as the average of two separately measurement by two radiologists. For qualitative analysis, any discrepancy during analysis was resolved through achieving consensus by consulting a senior abdominal radiologist (Dr. Shi, 12 years of experience reading body MRI).
Qualitative analysisWe analyzed all patients’ data for demographic characteristics including sex, age, and laboratory examinations (CA 199 and CEA). Tumor-specific variables including location, characteristics of pancreatic cancer, and presence of main pancreatic duct (MPD) dilatation, arterial and venous invasion, duodenal invasion, and bile duct invasion were evaluated.
Tumor location was categorized into two groups; the first group, in which the tumor was located in the head or uncinate of the pancreas; the second group, in which the tumor was located in the neck, body, or tail of the pancreas. Characteristics of PDACs contained the presence of cystic components and morphologic patterns. Cystic components were defined as markedly high signal intensity areas on T2WI and displayed no enhancement in any dynamic phase. The morphologic patterns of tumors were graded as focal and diffuse type. Dilatation of MPD was defined as MPD diameter at the tail side was dilated compared with the MPD diameter at the ampullary side. Imaging findings related to vessel invasion in PDACs were classified as negative and positive. Peripancreatic vessels of unilateral or bilateral narrowing and stenosis or obstruction with collaterals were considered as vessel invasion. The observed vessels contained portal vein, gastroduodenal artery, splenic artery and vein, superior mesenteric artery and vein, and their branches.
We attempted to track the regional LNs by using LN size, signal intensity, margin, as well as its distance from the tumor [15, 17, 18]. A hyperintensity lymph node on high b values of DWI, or presence of internal necrosis in LNs, or irregular margin of LNs, or LNs near the tumor was diagnosed as positive for metastases. The short axis of LN was interpreted as follows: the larger the short-axis diameter of the lymph node, the higher the probability of metastasis. When one or more lymph nodes were diagnosing as metastatic LN in an individual patient, this patient was categorized as LNM group. When no lymph nodes was diagnosing as metastatic LN in an individual patient, this patient was categorized as non-LNM metastasis group.
Quantitative analysisThe diameters of the short and long axis of tumors were measured on the T2WI sequence. Extrapancreatic distance of tumor invasion was determined by measuring the distance between the outer border of the pancreas and the outermost border of the tumor on the T2WI sequence. Junctions between tumor and normal parenchyma were identified and then according the outline of normal pancreas we drew outer border of the pancreas between the two junctions. While the tumor was located in the body or tail of the pancreas, the outer border of the pancreas may be straight; when the tumor was located in the head or uncinate, the outer border of the pancreas may be curved (Fig. 2). The radiologists measured the shortest distance between peritoneum and tumor, and the short-axis diameter of the largest lymph node. The largest lymph node was used for quantitative evaluation if two or more positive nodes were observed in MRI.
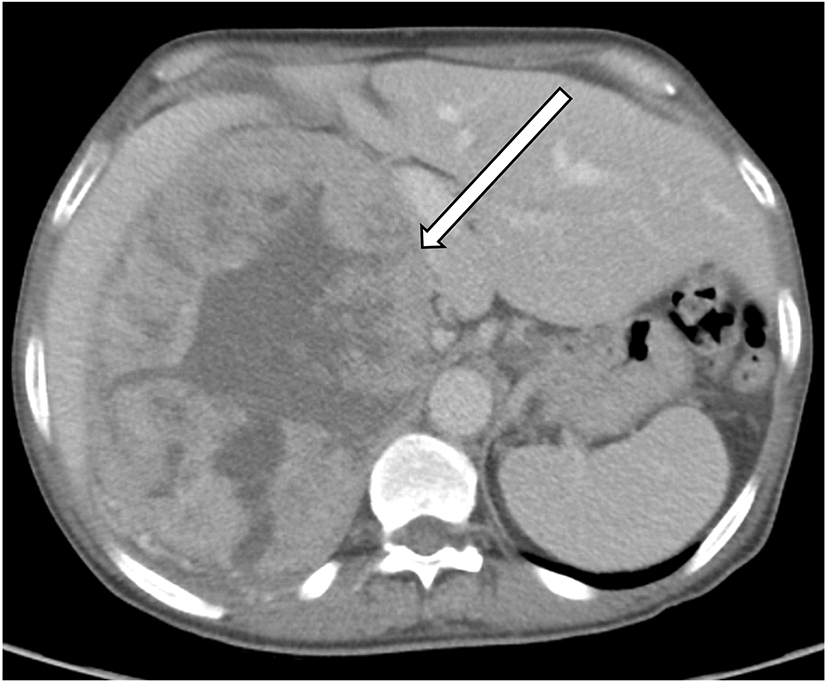
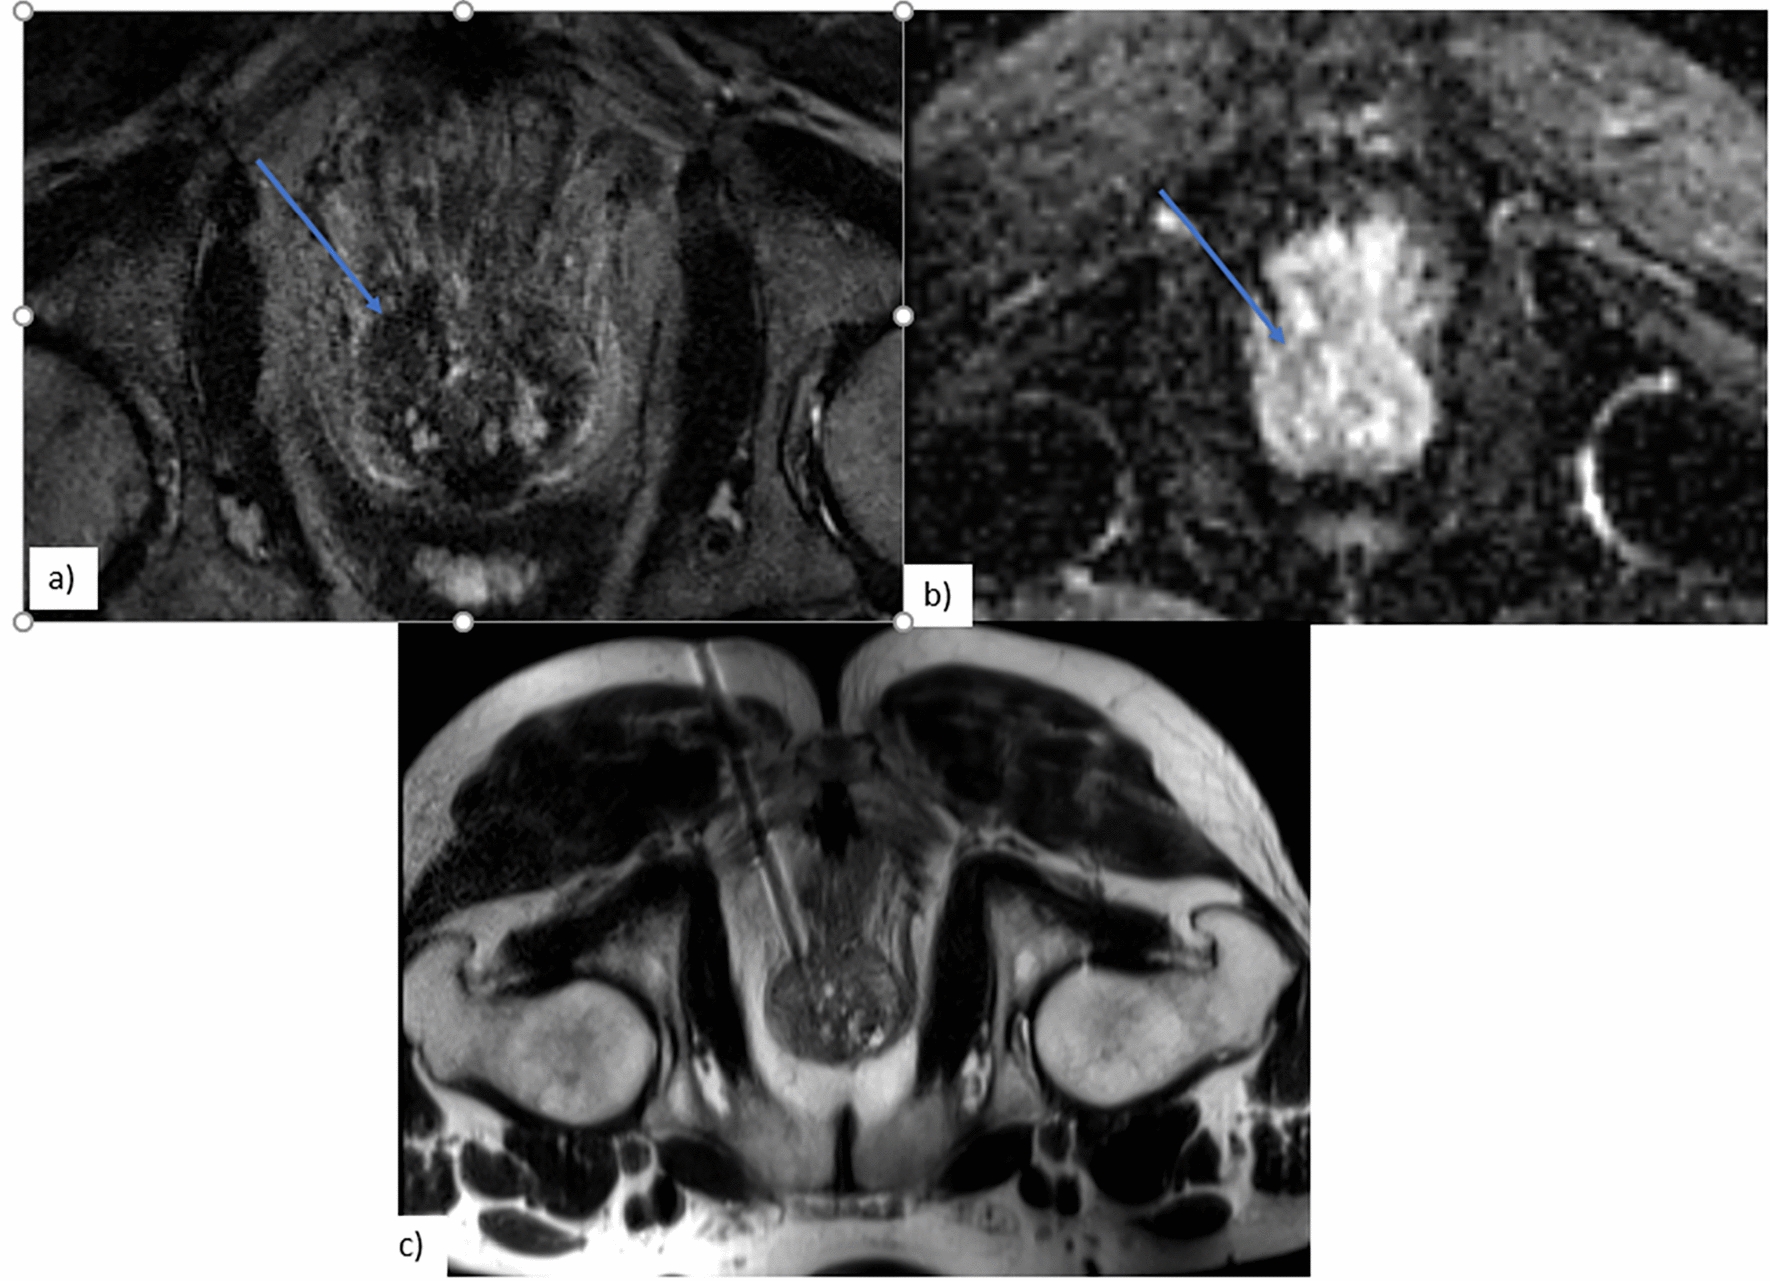
Fig. 2
(a–d) MR images of a 58-year-old man with pancreatic carcinoma with positive LNM. a Axial T2-weighted image showed an irregular high signal intensity tumor in the tail of the pancreas; the extrapancreatic distance (yellow line) of tumor invasion was 17 mm. b DWI with b = 1500 s/mm2 showed a hyperintense tumor; the ROI was drawn, including the entire tumor. c On the MD parametric map, the tumor showed an isointense signal with a value of 1.54 × 10⁻³ mm2/s, which was less than the cutoff value of 1.74 × 10⁻³ mm2/s. d On axial T2-weighted image, diameter of LN around the splenic artery was 7 mm (arrow). e–h MR images in a 56-year-old woman of pancreatic carcinoma with negative LNM. e Axial T2-weighted image showed a well-defined high signal intensity tumor in the head of the pancreas; the extrapancreatic distance (yellow line) of tumor invasion was 6 mm. f DWI with b = 1500 s/mm2 showed a hyperintense tumor; the ROI was drawn, including the entire tumor. g On the MD parametric map, the tumor showed an isointense signal with a value of 2.70 × 10⁻³ mm2/s. h Axial T2-weighted image showed LN with a diameter of 5 mm around the pancreatic head
The ROIs were manually drawn with the ITK-SNAP software (version 3.8.0) using DWI with a b value of 1500 s/mm2 on each slice. The tumor was contoured slice by slice to obtain the entire neoplastic ROIs. The ROIs were placed on the tumor region, as determined by T1WI, T2WI, DWI, and contrast imaging. Special attention was taken to avoid normal pancreatic tissue, pancreatitis, or adjacent normal vasculature. Parameters of DWI were obtained through the ROIs.
Parameter estimationAfter ROI delineation, the parameters of the non-gaussian DWI models were calculated. The IVIM parameters contained D, D* and f. D was the slow component of diffusion reflecting pure molecular diffusion, D* was the fast component of diffusion associated with perfusion and representing incoherent microcirculation, and f was the volume fraction of the protons linked to the intravascular component or to the microcirculation [19]. The SEM parameters included DDC (distributed diffusion coefficient) and α. DDC represented the mean intravoxel diffusion rate, and α was the intravoxel water molecular diffusion heterogeneity index, which characterized the deviation of signal attenuation from monoexponential behavior and ranged from 0 to 1. A value of α near 1 indicated high homogeneity in apparent diffusion [20]. DKI parameters contained Dapp and Kapp. Dapp was the apparent diffusion coefficient (in mm2/s), and Kapp was the apparent diffusion kurtosis coefficient [21].
Surgery and histopathologyPancreatic tumor surgery with regional LN dissection is the standard treatment procedure for patients with PDACs at our hospital. Pancreaticoduodenectomy (n = 56) and distal pancreatectomy (n = 71) were chosen according to tumor location. The surgeons were able to accurately label all specimens. In particular, regional lymph node specimens were dissected according to the NCCN criteria. The lymph nodes were dissected from the specimen, and nodes were examined separately. The lymph nodes metastasis showed ill-defined, round and slightly hard texture lesion with internal gray and white tissue containing area of necrosis in gross specimen. However, it was very difficult to differentiate LNM and non-LNM in gross specimen sometimes. One pathologist with a special interest in PDAC examined all pathologic specimens. Pathological slides were stained with hematoxylin and eosin and analyzed by light microscopy. Lymph nodes metastasis was confirmed by presence of the pancreatic cancer cell in the lymph nodes. Non-lymph nodes metastasis was diagnosed by absence of tumor cell and presence of leukomonocyte and lymphatic sinusoid. The presence of microscopic tumor invasion into the adjacent organ, and vessel invasion were determined. The results of the analysis of the surgical specimen were used as a reference standard.
Statistical analysisThe continuous variables were analyzed using Student’s t-test or Mann–Whitney U test. Categorical variables were analyzed using the Chi-square test. Multivariate analysis of factors predicting LNM was performed using logistic regression. Variables with P < 0.05 in univariate analysis were incorporated into a multivariate logistic regression model. The receiver operating characteristic (ROC) curve was used to assess the diagnostic performance. The area under the curve (AUC), sensitivity, specificity, and accuracy were calculated. The AUCs between the MRI model and radiologists were compared using the z-test. The interobserver agreement between the two radiologists was evaluated using kappa statistics. Overall survival was calculated from 1 January 2011 until cancer-specific death. Follow-up assessment consisted of outpatient interviews at 3-month intervals for 2 years, then at 6-month intervals for 3 years, and finally at 12-month intervals until death. No patient was lost to follow-up. Kaplan–Meier method with log-rank test was conducted to compare survival curves between LNM and non-LNM groups. All analyses were conducted using SPSS 22.0 (IBM Corporation, Armonk, NY, USA) and STATA 12.0 (Stata Corporation, College Station, TX, USA).
留言 (0)