
記住我


Stress-induced hyperglycemia (SIH) is the transient relative increase in glucose due to enhanced gluconeogenesis which occurs in acute physiological stress as a result of increased circulating cortisol, catecholamines, and inflammatory cytokines. It is commonly observed in the presence of stressors such as major surgery and acute illness, including ischemic stroke.1 The acute rise in glucose causes oxidative stress responses and affects endothelial function and coagulation factors, leading to a dysfunctional thrombotic state in people with or without diabetes mellitus.1, 2 SIH is associated with increased mortality and morbidity in hospitalized people, with greater negative impact in those without diabetes.1, 3-5
Hyperglycemia at the time of ischemic stroke presentation is associated with increased mortality and poor functional outcomes.3-6 SIH increases hemorrhagic conversion risk and infarct expansion and decreases the effectiveness of thrombolysis and thrombectomy.7-9 Hyperglycemia during ischemic stroke may cause increased ischemic injury via increased oxidative stress, endothelial dysfunction, and impaired fibrinolysis.10
Conventionally, blood glucose levels (BGL) ≥10 mmol/L are used to identify stress hyperglycemia in hospitalized people, with guidelines encouraging interventional glucose management above 10 mmol/L.11 People with diabetes with chronic poor glucose control and admitted to hospital may be incorrectly considered to have SIH, and clinically important SIH has been demonstrated at BGL <10 mmol/L in hospitalized people without diabetes. Inpatient glucose management targeting BGL ≥10 mmol/L may fail to recognize significant SIH.12
The SHINE study randomized participants with ischemic stroke to tight (4.4-7.2 mmol/L) or moderate (7.2-10 mmol/L) glucose control for 72 hours.13 Outcomes at 90 days were not influenced, with an adjusted relative risk for tight vs moderate control of 0.97, demonstrating that post-event glucose management based on one-size-fits-all glucose ranges does not improve outcomes for acute ischemic stroke. A more reliable approach to recognize SIH is required.
Acute increases in blood glucose above usual patient-specific background glycemia are more strongly associated with outcomes than absolute BGL and are likely to better represent SIH.12, 14 Two biomarkers of SIH have been developed to represent SIH, the stress hyperglycemia ratio (SHR) and the glycemic gap (GG), and show an association with acute stroke outcomes.14 In a population of participants with acute ischemic stroke, a GG of 2.5 mmol/L was shown to be the optimal threshold for prediction of poor outcome.14 While the optimal threshold for SHR to define SIH has not been definitively validated, Fabbri et al found that an SHR threshold of 1.14 significantly increased the discriminant capacity to predict outcome for hospitalized diabetic patients with sepsis.15 The same SHR threshold was strongly associated with complications in patients undergoing orthopedic trauma surgery, while Chu et al found that an SHR threshold of 1.19 best distinguished between large or small thrombus burden in diabetic patients with ST-segment elevation myocardial infarction.16, 17
In light of the results from the SHINE study13 and the emerging role of SHR and GG to accurately reflect the presence of SIH, it is important to assess stroke outcome against specific biomarkers of SIH other than glucose. This study investigated the relationship between SHR and GG with stroke outcome at hospital discharge, both as continuous variables and at nominated thresholds. We assessed the relationship using glucose metrics at admission to determine prognostic capabilities and as a maximum during the first 5 days of admission as a marker of the impact of ongoing exposure to SIH.
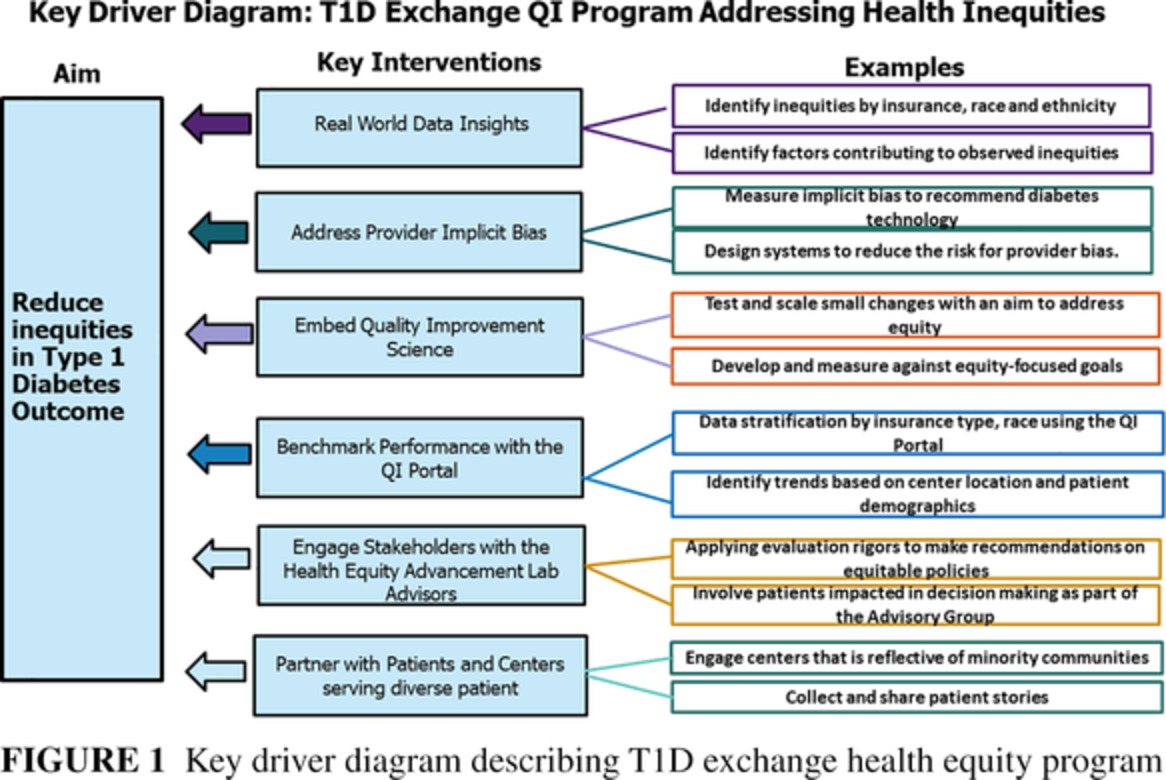
2 METHODSThis retrospective, single-center cohort study identified participants admitted for ischemic stroke from September 2013 to June 2017 using International Classification of Diseases, Tenth Revision codes. Review by a medical investigator confirmed the diagnosis. Modified Rankin score (mRS) and Glasgow Coma Scale (GCS) scores were calculated at admission and hospital discharge. CHA₂DS₂-VASc score, a composite of age, gender, and a history of heart failure, hypertension, stroke, transient ischemic attack, peripheral vascular disease, myocardial infarction, and diabetes, was used to represent patient comorbidity. The CHA₂DS₂-VASc score has been shown to be a reliable marker for predicting outcomes in patients both with and without atrial fibrillation.18 We included participants with a primary admission diagnosis of ischemic stroke as defined by the World Health Organization criteria, >18 years, BGL within 24 hours of admission, and glycosylated hemoglobin (HbA1c) within 1 month prior to admission. Patient recruitment flow is detailed in Figure 1. From an initial pool of 1682 candidates admitted under the stroke unit, 433 potential cases were identified and reviewed, resulting in 300 eligible cases.

Patient recruitment
SHR and GG utilize HbA1c to determine participant-specific background glucose by estimating average blood glucose (eAG) using the equation 1.59 × HbA1c − 2.59, where HbA1c is expressed as a percentage.19 eAG reflects glucose control from the previous 3 months and is unaffected by short-term variability related to SIH. SHR was calculated as BGL divided by the eAG, representing the relative difference from eAG.12 GG was calculated as BGL minus the eAG, representing the absolute difference from eAG.14
The primary study endpoint was a poor outcome at discharge, defined as any of a composite of inpatient mortality, stroke exacerbation (hemorrhagic transformation or thrombotic extension) during hospitalization, discharge to a permanently higher level of care, or functional deficit at hospital discharge compared to admission (increase of ≥2 points in mRS, decrease ≥5 in the GCS).
2.1 Statistical methodsDifferences between those with poor and good outcome were assessed using t tests, Mann-Whitney U tests, and chi-square tests as appropriate.
The relationship of outcome and glucose metrics both at admission and as a 5-day maximum were assessed in multivariable logistic regression analyses, adjusting for comorbidity (CHA₂DS₂-VASc score) and use of recombinant tissue plasminogen activator (rTPA). Glucose metrics were assessed as both continuous variables and at thresholds of glucose 10 mmol/L, SHR 1.14, and GG 2.5 mmol/L. SHR and GG were modeled separately due to colinearity. All logistic models were validated using the Hosmer-Lemeshow test. Locally weighted scatterplot smoothing (LOWESS) depicted the relationship of 5-day maximum glucose metric and outcome. All results are reported using 95% CI. A P value of less than .05 (two-sided) was statistically significant. Analyses were performed using Stata 16 (Stata Corp, College Station, Texas).
The study was approved by the Southern Adelaide Human Research Ethics Committee (HREC/15/SAC/266309.15), and individual informed consent was not required.
3 RESULTSEighty-one of 300 participants (27.0%) experienced a poor outcome (Table 1). At discharge, 37 (12.3%) required higher-level care, 7 (2.3%) had an increase of two points or more in mRS, 24 (8.0%) a decrease of ≥5 in GCS score, and 47 (15.7%) experienced stroke extension, ischemic-to-hemorrhagic conversion, or in-hospital death. Those with a poor outcome were older, had more atrial fibrillation, higher CHA₂DS₂-VASc score, and were more likely to receive antihypertensives.
TABLE 1. Patient characteristics (mean ± SD, unless otherwise stated) All Poor outcome Good outcome P n 300 (100%) 81 (27.0%) 219 (72.9%) - Age (y) 74.3 (13.6) 81.3 (9.5) 71.7 (14.0) <.001 Men 159 (53.0%) 35 (43.2%) 125 (57.0%) .051 HbA1c (%) 6.31 (1.56) 6.45 (1.6) 6.26 (1.55) .35 HbA1c ≥ 6.5%, n (%) 70 (23.3) 21 (25.9) 49 (22.4) .65 Systolic blood pressure (mm Hg) 157 (30) 156 (30) 157 (30) .88 Diastolic blood pressure (mm Hg) 81 (17) 83 (20) 81 (16) .35 eGFR (mL/min/1.73 m2) 68.0 (29.0) 67.9 (30.2) 67.7 (28.8) .98 Medication profile Antiplatelets, n (%) 132 (44.0) 43 (53.1) 130 (59.3) .36 Anticoagulants, n (%) 39 (13.0) 16 (19.8) 23 (10.5) .053 Statins, n (%) 111 (37.0) 32 (39.5) 79 (36.1) .59 Antihypertensives, n (%) 202 (67.3) 66 (81.5) 136 (62.1) .014 rTPA use, n (%) 39 (13.0) 13 (16.0) 26 (11.9) .34 Comorbidity status CHA₂DS₂-VASc score 3.2 (1.8) 3.9 (1.5) 3.0 (1.8) <.001 Atrial fibrillation, n (%) 87 (29.0) 33 (40.7) 54 (24.7) .007 Known diabetes, n (%) 90 (30.0) 30 (37.0) 60 (27.4) .12 Glucose metrics at admission Glucose (mmol/L) 7.4 (3.2) 8.1 (3.5) 7.2 (3.0) .034 SHR 1.00 (0.25) 1.05 (0.29) 0.98 (0.24) .021 GG (mmol/L) 0 (2.4) 0.4 (3.3) −0.2 (1.9) .072 Any blood glucose ≥10 mmol/L, n (%) 42 (14.0) 13 (16.0) 29 (13.2) .57 Any SHR ≥ 1.14, n (%) 69 (23.0) 27 (33.3) 42 (19.7) .013 Any GG ≥ 2.5 mmol/L, n (%) 34 (10.3) 11 (13.6) 23 (10.5) .54 Glucose metrics at 5 days Maximum glucose (mmol/L) 8.1 (3.7) 9.3 (4.6) 7.7 (3.2) <.001 Maximum SHR 1.10 (0.37) 1.23 (0.47) 1.05 (0.31) <.001 Maximum GG (mmol/L) 0.7 (2.9) 1.7 (4.1) 0.3 (2.3) <.001 Any glucose ≥10 mmol/L, n (%) 56 (18.7) 19 (23.5) 37 (16.9) .24 Any SHR ≥ 1.14, n (%) 101 (33.7) 41 (50.6) 60 (27.4) <.001 Any GG ≥ 2.5 mmol/L, n (%) 56 (18.7) 24 (29.6) 32 (14.6) .004 Abbreviations: eGFR, estimated glomerular filtration rate; GG, glycemic gap; HbA1c, glycosylated hemoglobin; rTPA, recombinant tissue plasminogen activator; SHR, stress hyperglycemia ratio.At admission, SHR, the percentage of patients with SHR ≥ 1.14, and glucose were all higher in patients with a poor outcome, but not GG, the percentage of patients with GG ≥ 2.5 mmol/L, or glucose ≥ 10 mmol/L. All 5-day maximum glucose metrics were higher in those with a poor outcome, with the exception of glucose ≥10 mmol/L.
3.1 Glucose metrics at admission outcomesAdmission SHR was associated with outcome after adjustment for CHA2DS2-VASc and use of rTPA (OR = 2.88; 95% CI: 1.05, 7.91; P = .041), but not when further adjusted for glucose (OR = 2.45; 95% CI: 0.75, 8.08; P = .14) (Table 2). Admission GG, admission glucose, or rTPA use were not associated with outcome in any model. CHA2DS2-VASc was associated with outcome in all models, with each one-point increase associated with a 36% to 37% increase in the likelihood of a poor outcome.
TABLE 2. Relationship between outcome with glucose metrics at admission and with 5-day maximum thresholds Odds ratios, unadjusted Glucose metrics adjusted for CHA2DS2-VASca and rTPAb Glucose metrics further adjusted for glucosec OR (95% CI) P value OR (95% CI) P value OR (95% CI) P value Continuous glucose metrics at admission SHR 3.15 (1.19-8.36) .021 2.88 (1.05-7.91) .041 2.45 (0.74-8.08) .14 GG (per 1 mmol/L) 1.10 (0.99-1.22) .086 1.08 (0.97-1.21) .18 1.04 (0.90-1.20) .62 Glucose (per 1 mmol/L) 1.08 (1.00-1.17) .040 1.06 (0.98-1.15) 0.13 – – CHA2DS2–VASc 1.40 (1.19-1.64) <.001 – – – – rTPA 1.42 (0.69-2.92) .34 – – – – Continuous glucose metrics as 5-day maximum SHR 3.86 (1.85-8.06) <.01 3.72 (1.75-7.92) .001 3.19 (1.11-9.15) .031 GG (per 1 mmol/L) 1.16 (1.06-1.28) .0013 1.15 (1.05-1.27) .003 1.11 (0.96-1.29) .17 Glucose (per 1 mmol/L) 1.12 (1.04-1.20) .0014 1.10 (1.03-1.18) .006 – – Glucose metric thresholds at admission SHR ≥ 1.14 2.11 (1.19-3.73) .011 2.07 (1.15-3.76) .016 2.24 (1.19-4.22) .012 GG ≥ 2.5 mmol/L 1.34 (0.62-2.89) .46 1.17 (0.53-2.59) .71 1.24 (0.44-3.47) .68 Glucose ≥10 mmol/L 1.25 (0.62-2.53) .53 1.04 (0.49-2.17) .92 – – Glucose metric thresholds as 5-day maximum SHR ≥ 1.14 2.71 (1.60-4.60) <.001 2.15 (1.25-3.71) .006 2.79 (1.55-5.03) <.001 GG ≥ 2.5 mmol/L 2.46 (1.34-5.51) .004 2.48 (1.20-4.24) .011 3.03 (1.34-6.88) .008 Glucose ≥10 mmol/L 1.51 (0.81-2.81) .20 1.23 (0.64-2.37) .53 – – Abbreviations: GG, glycemic gap; OR, odds ratio; rTPA, recombinant tissue plasminogen activator; SHR, stress hyperglycemia ratio. a CHA2DS2–VASc was associated with outcome in all models (P < .01 for all), with a 40% to 46% increase in likelihood of a poor outcome with each 1-point increase. b Use of rTPA not associated with outcome in any model. c Glucose not significantly associated with outcome when in combination with SHR or GG in any model.Admission SHR ≥ 1.14 was associated with poor outcome in all models, and this was independent of glucose (Table 2, Figure 2). Admission glucose ≥10 mmol/L or admission GG ≥2.5 mmol/L were not associated with outcome in any model.

Poor outcome above and below nominated glucose metric thresholds at admission. gluc<10 - admission glucose <10 mmol/L, gluc> = 10 - admission glucose >10 mmol/L, SHR <1.14 - admission Stress Hyperglycemia Ratio <1.14, SHR ≥1.14 - admission Stress Hyperglycemia Ratio >1.14, GG < 2.5 - Glycemic Gap <2.5 mmol/L, GG ≥2.5 - Glycemic Gap >2.5 mmol/L. P-values in figure calculated using logistic regression adjusted for comorbidity and rTPA. T-tests for HbA1c values: glucose ≥10 vs gluc<10 (P < .001). GG >2.5 vs GG < 2.5 (P = .006). SHR > =1.14 verses SHR < 1.14 (P = 0.34)
3.2 Five-day maximum glucose metrics and outcomesEighty-four (28.0%) participants experienced the maximum recorded glucose subsequent to the admission glucose. All 5-day maximum glucose metrics were associated with outcome after adjusting for CHA2DS2-VASc and use of rTPA (Table 2). On further adjustment for glucose, the significance with outcome was maintained for SHR, but not glucose. In the GG model, on further adjustment for glucose, neither GG nor glucose were associated with outcomes.
A 5-day maximum SHR ≥ 1.14 was strongly associated with outcome in all models, as was GG ≥ 2.5 mmol/L (Table 2). A 5-day maximum glucose ≥10 mmol/L was not associated with outcome in any model.
For glucose metric thresholds at admission, mean HbA1c was higher for those with glucose ≥10 mmol/L compared to <10 mmol/L and for those with GG ≥ 2.5 mmol/L compared to <2.5 mmol/L, but not for those with SHR ≥ 1.14 compared to <1.14. (Figure 2). Sensitivity testing on either side of the nominated thresholds, using SHR thresholds of 1.1 and 1.2 and GG thresholds of 2.0 and 3.0 mmol/L, showed no significant improvements in predicting outcome.
Univariate analysis of the individual CHA₂DS₂-VASc components indicated that increasing age was associated with worsening severity at admission (OR = 1.05; 95% CI: 1.03, 1.07; P < .001) and outcome at discharge (OR = 1.07; 95% CI: 1.04, 1.10; P < .001), as was female gender (OR = 1.87; 95% CI: 1.13, 3.09; P = .015 and OR = 1.72; 95% CI: 1.03, 2.87; P = .040, respectively), with no association for any other component. Substitution of CHA₂DS₂-VASc components into multivariate modeling in place of the CHA₂DS₂-VASc score did not alter multivariate outcomes for any glucose metrics, with the exception of the 5-day maximum SHR in the continuous model adjusted for rTPA and glucose (OR = 2.33; 95% CI: 0.68, 8.02; P = .18).
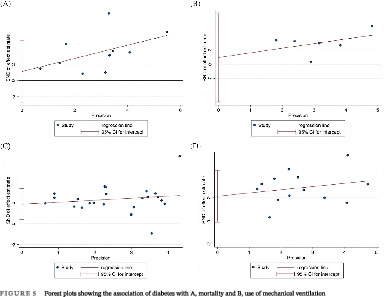
3.3 LOWESS modelingFor glucose, the level of events reached a plateau of 39% at glucose 8.9 mmol/L, followed by a decline in the percentage of events at higher glucose levels (Figure 3A). Increasing glucose closely reflected increasing HbA1c, with a mean HbA1c of 5.5% for participants with maximum glucose <5.0 mmol/L, up to 9.3% for maximum glucose ≥15 mmol/L. GG reached a plateau of 45% events at a gap of 7.0 mmol/L (Figure 3B), and SHR appeared linear over the range studied, up to an SHR of 2.3 (Figure 3C). Increasing SHR and GG showed little variation in HbA1c across the range studied.

Outcome and relationship with five-day maximum glucose (3A), five-day maximum Glycemic Gap (3B), and five-day maximum Stress Hyperglycemia Ratio (3C). Mean HbA1c values are the mean calculated from each nominated glucose metric range in the first line
3.4 Impact of known diabetesThe incidence of severity at admission for those with known diabetes (n = 90, including known diabetic patients with HbA1c < 6.5%) was 31.1% compared to 28.6% for those with no diabetes (n = 210, P = .70). The incidence of poor outcome was 33.3% for known diabetic patients compared to 24.3% for nondiabetic patients (P = .11). Further to this, there was no univariate association between known diabetes with either severity (OR = 1.13; 95% CI: 0.66, 1.93; P = .66) or outcome (OR = 1.56; 95% CI: 0.91, 2.67; P = .11).
4 DISCUSSIONThe SHR was the most consistent indicator of the presence of SIH and the associated impact on ischemic stroke outcomes in this mixed diabetes/non-diabetes cohort. SHR at admission, both as a continuous variable and at a threshold of 1.14 showed potential as a prognostic marker to determine glycemic intervention for management of SIH. Importantly, when SHR was further adjusted for glucose, it remained associated with outcome for admission SHR ≥ 1.14, adjusted 5-day maximum SHR, and 5-day maximum SHR ≥ 1.14, although not for admission SHR as a continuous variable.
In all models, in the presence of SHR, glucose was not associated with outcome. As a marker of SIH, glucose is often associated with outcome as a univariate association, as seen in this study, because it at least partly reflects acute changes in glucose from background glycemia. The association of glucose with outcome is more pronounced in cohorts with a narrow HbA1c range, as patients all have similar baseline background glycemia, and absolute glucose will more uniformly represent acute glucose changes from baseline. Over a wide HbA1c range, however, there is an inherently varying baseline glycemia, with glucose becoming a poor and potentially misleading indicator of SIH. Use of SIH-specific markers such as SHR then become critically important. The presence of SIH for hospitalized patients is conventionally defined as BGL ≥10 mmol/L. In this cohort with a widely varying HbA1c range, glucose was poorly associated with outcome and BGL ≥ 10 mmol/L not a reliable indicator of the presence of SIH. This is consistent with the findings of the SHINE study.13 While GG was more indicative of SIH than glucose, no GG metric at admission was associated with outcome, only in a limited fashion as a 5-day maximum value.
Five-day maximum glucose metrics, used to reflect general glucose control over this period and allowing insight into the impact of continued SIH exposure, were all associated with outcome. This is consistent with the observations of Rosenthal et al, who observed a strong relationship between maximum in-hospital glucose measurements and outcomes for patients with intracerebral hemorrhage.20 Five-day maximum SHR and any SHR ≥ 1.14 in the first 5 days were both associated with outcome even after adjustment for glucose, indicating that continued exposure to relative increases in glucose are associated with outcome. Of note, glucose had no association with outcome when adjusted for SHR. Five-day maximum GG was also associated with outcome, but this was lost after further adjustment for glucose. While these results indicate that ongoing exposure to SIH worsens outcome, they may also in part reflect an increase in post-admission glucose metrics due to stroke progression in some patients.
The threshold of 2.5 mmol/L for GG was defined in a cohort of ischemic stroke patients with diabetes and a mean HbA1c > 8%.14 The relative lack of predictive ability for GG in this study may be related to its application to a cohort containing a large proportion of nondiabetic patients. This study cohort (30% known diabetes) contained a wide HbA1c range (4.3%-15.7%). The application of an absolute GG value to this extended HbA1c range may be problematical. An increase of 2.5 mmol/L from the eAG in a patient with HbA1c 5% (eAG 5.3 mmol/L) is a 46% relative increase (SHR 1.46) and is likely to have different clinical ramifications to a change of 2.5 mmol/L in a patient with HbA1c 10% (eAG 13.3 mmol/L), equivalent to a 19% relative increase (SHR 1.19). The latter could easily be part of normal background variation rather than SIH. Further work is required to define the general applicability of SIH-specific markers over a wide range of HbA1c.
As the SHINE study demonstrated, glycemic intervention based on glucose ranges does not improve outcomes in acute ischemic stroke. Glucose as a marker does not distinguish between normal high background glucose (elevated HbA1c), new onset hyperglycemia, or nondiabetic patients with low HbA1c experiencing an acute hyperglycemia that remains below 10 mmol/L. This is reflected in Figure 3, where increasing glucose acts as a marker of increasing HbA1c, while increasing SHR or GG did not. Further to this, SHR was the only glucose metric that did not have a significant difference in HbA1c for those above or below the nominated thresholds at admission, highlighting its independent ability to recognize SIH regardless of HbA1c. Glucose does not reliably reflect the presence of SIH in patient cohorts with a broad HbA1c range with widely varying background glycemia. A number of studies in both ischemic stroke and other patient cohorts are consistent with this.12, 14-17, 21, 22 Future interventional studies need to acknowledge and incorporate this in their design.
As a marker of comorbidity, the CHA₂DS₂-VASc score was a powerful predictor of stroke outcome. This was consistent in all models, with a 36% to 37% increase in poor outcome with each 1-point increase. The comorbidity burden was highly associated with outcome and highlights the importance of adjustment for comorbidity when assessing stroke outcome. There was no difference in HbA1c for those with or without a poor outcome, suggesting HbA1c per se may not be related to stroke outcome but rather the degree of comorbidity associated with the diabetic state. Further to this, the presence of known diabetes was not directly associated with either severity or outcome. Studies linking stroke outcome to the presence or absence of diabetes need to carefully distinguish between the presence of diabetes itself and the degree of comorbidity associated with diabetes.
This study has a number of strengths. The step-wise progression of further adjustment for glucose in the logistic regression analysis more clearly defined the relationships between glucose metric markers, SIH, and outcome. The broad HbA1c range in our study cohort ensured an accurate insight into the generalizability of SHR and GG across representative ischemic stroke populations. Limitations include reliance on randomly measured glucose levels, restricting deeper insight into glucose patterns across the admission. We did not assess the possible impact of hypoglycemia,21 although only two participants recorded BGL < 4 mmol/L, neither of whom experienced a poor outcome. We did not assess the degree of glucose intervention after admission and used the maximum recorded glucose over the first 5 days as a marker of control in that period. While the National Institutes of Health (NIH) Stroke Scale score is the preferred option for assessment, we were unable to retrospectively obtain scores for all patients and used the GCS, which could be assessed retrospectively from case notes. We used nominal thresholds, based on previous literature, although sensitivity testing around these nominal thresholds did not indicate further improved prognostic insight.
This study adds to the growing body of evidence that in the setting of ischemic stroke, absolute glucose concentration is a not a reliable marker of SIH and the associated impact on outcome. In a cohort with a broad range of HbA1c, the conventional threshold of 10 mmol/L had little clinical relevance. SIH and the associated impact on outcome is only reflected by glucose metrics that measure the acute change in glucose from baseline, such as SHR or GG. These markers discriminate between the interpatient variation in normal premorbid background glycemia determined by HbA1c and the relative increase in glucose that represents SIH. SHR in particular had applicability across a wide HbA1c spectrum and showed promise as a prognostic marker at admission. There is a growing need for interventional studies to investigate the use of patient-specific glucose management, tailored to an SHR or GG range. Reanalysis of key studies such as the SHINE study, with the application of glucose metrics such as SHR, may also provide more meaningful insight.
CONFLICT OF INTERESTNone declared.
REFERENCES
留言 (0)