A miniaturized analytical method based on molecularly imprinted absorbents for selective extraction of (S)‐1,1′‐binaphthyl‐2,2′‐diamine and combinatorial screening of polymer precursors by computational simulation
Figure S1. The process of MIPs synthesis and selective binding for S-DABN.
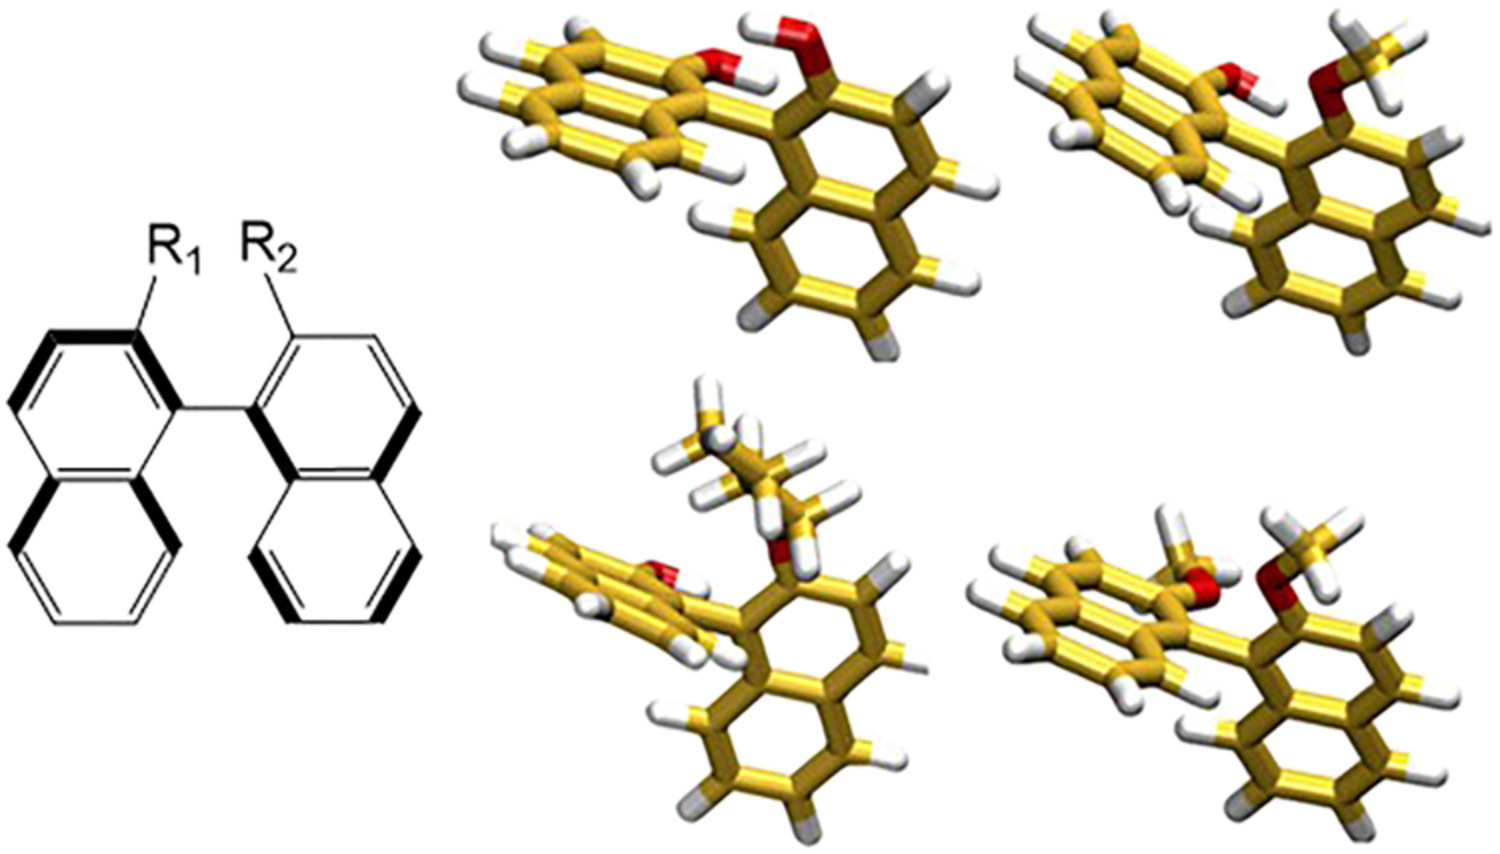
Figure S2. Molecular optimized configuration and corresponding Mulliken charge distribution.
Figure S3. The influence of mixing temperatures on chemical shifts with [S-DABN]/[MAA] = 1:4 in 3 mL acetonitrile-d3.
Figure S4. FT-IR spectra of MIP (P2) (a) before and (b) after removal of S-DABN, (c) NIP (P0).
Figure S5. TG and DTG curves of (a) MIP (P2) and (b) NIP (P0) at a heating rate of 10°C min−1 from room temperature to 800°C in N2 atmosphere.
Figure S6. (a) The relationship between ln (Qe-Q) and t; (b) t/Q and t for the first-and second-order adsorption models, respectively. ([S-DABN]0 = 35 mg L−1 in 20 mL acetonitrile, the mass of MIP (P2) was 25.0 mg at 25°C)
Figure S7. Fitting curve of lnKd versus 1/T for S-DABN adsorption by MIP (P2).
Table S1. Effect of MIPs adsorbent types on the selective extraction by MIP-MTSPE.
Figure S8. HPLC chromatograms of DABN racemic samples after extraction by MIP-MTSPE equipped with different MIP (P2). Chromatographic conditions: OD column (4.6 × 250 mm), mobile phase: N-hexane: Isopropanol (95: 5, v/v), flow rate: 0.50 mL min−1; sample loading, 5 μL DABN racemic samples after MIP-MTSPE treatment, and the initial concentration of samples before MIP-MTSPE treatment were (a) 0.08 mg mL−1, (b) 0.28 mg mL−1 and (c) 0.80 mg mL−1 respectively.
Table S2. Recoveries of S-DABN samples after selective extraction by MIP-MTSPEa.


留言 (0)