Figure S1. 1H NMR spectrum of [(S,S,S)/(R,R,R)-2] in CD2Cl2 at 298 K (400 MHz). Inset: expanded region from 5.56 to 12.06 ppm.
Figure S2. 31P spectrum of [(S,S,S)/(R,R,R)-2] in CD2Cl2 at 298 K (162 MHz).
Figure S3. 19F spectrum of [(S,S,S)/(R,R,R)-2] in CD2Cl2 at 298 K (376 MHz). Inset: expanded region from −81.3 to −79.6 ppm.
Figure S4. 1H NMR spectrum of [(S)/(R)-3] in CD2Cl2 at 298 K (400 MHz). Inset: expanded region from 5.80 to 12.22 ppm.
Figure S5. 31P spectrum of [(S)/(R)-3] in CD2Cl2 at 298 K (162 MHz). Inset: expanded region from −166 to −135 ppm.
Figure S6. 19F spectrum of [(S)/(R)-3] in CD2Cl2 at 298 K (376 MHz). Inset: expanded region from −81.4 to −79.1 ppm.
Figure S7. 1H NMR spectrum of [(S,S,S)/(R,R,R)-4] in CD2Cl2 at 298 K (400 MHz). Inset: expanded region from 5.98 to 9.52 ppm.
Figure S8. 19F spectrum of [(S,S,S)/(R,R,R)-4] in CD2Cl2 at 298 K (376 MHz). Inset: expanded region from −83.5 to −77.4 ppm.
Figure S9. Superposition of experimental powder X-ray diffraction patterns from [(S)-1]n and [(R)-1]n measured at 300 K and simulated from [(R)-1]n single-crystal data obtained at 150 K2.
Figure S10. Superposition of experimental powder X-ray diffraction patterns from [(S,S,S)-2]n and [(R,R,R)-2]n measured at 300 K and simulated from n single-crystal data obtained at 150 K2.
Figure S11. Superposition of experimental powder X-ray diffraction patterns from [(S,S,S)-4]n and [(R,R,R)-4]n measured at 300 K and simulated from n single-crystal data obtained at 150 K3.
Figure S12. ORTEP view of the asymmetric unit for n. Thermal ellipsoids are drawn at 30% probability. Hydrogen atoms are omitted for clarity.
Figure S13. Crystal packing of n highlighting the F···F and H···F contacts.
Figure S14. Superposition of experimental powder X-ray diffraction patterns from [(S)-3]n and [(R)-3]n measured at 300 K and simulated from n single-crystal data obtained at 150 K3.
Figure S15. (a) UV–visible absorption and (b) ECD spectra in CH2Cl2 solution at ? = 1·10−5 mol L−1 and room temperature for [(S)-1] (gray line) and [(R)-1] (black line).
Figure S16. (a) UV–visible absorption and (b) ECD spectra in CH2Cl2 solution at C = 1·10−5 mol L−1 and room temperature for [(S,S,S)-2]* (light blue line) and [(R,R,R)-2] (dark blue line). * The ECD signal at low energy is slightly saturated for this compound.
Figure S17. (a) UV–visible absorption and (b) ECD spectra in CH2Cl2 solution at C = 1·10−4 mol AUTHOR: As per journal style, abbreviations are not allowed in the article title. Please amend.L−1 and room temperature for [(S)-3] (light red line) and [(R)-3] (dark red line).
Figure S18. (a) UV–visible absorption and (b) ECD spectra in CH2Cl2 solution at C = 5·10−5 mol L−1 and room temperature for [(S,S,S)-4] (light green line) and [(R,R,R)-4] (dark green line).
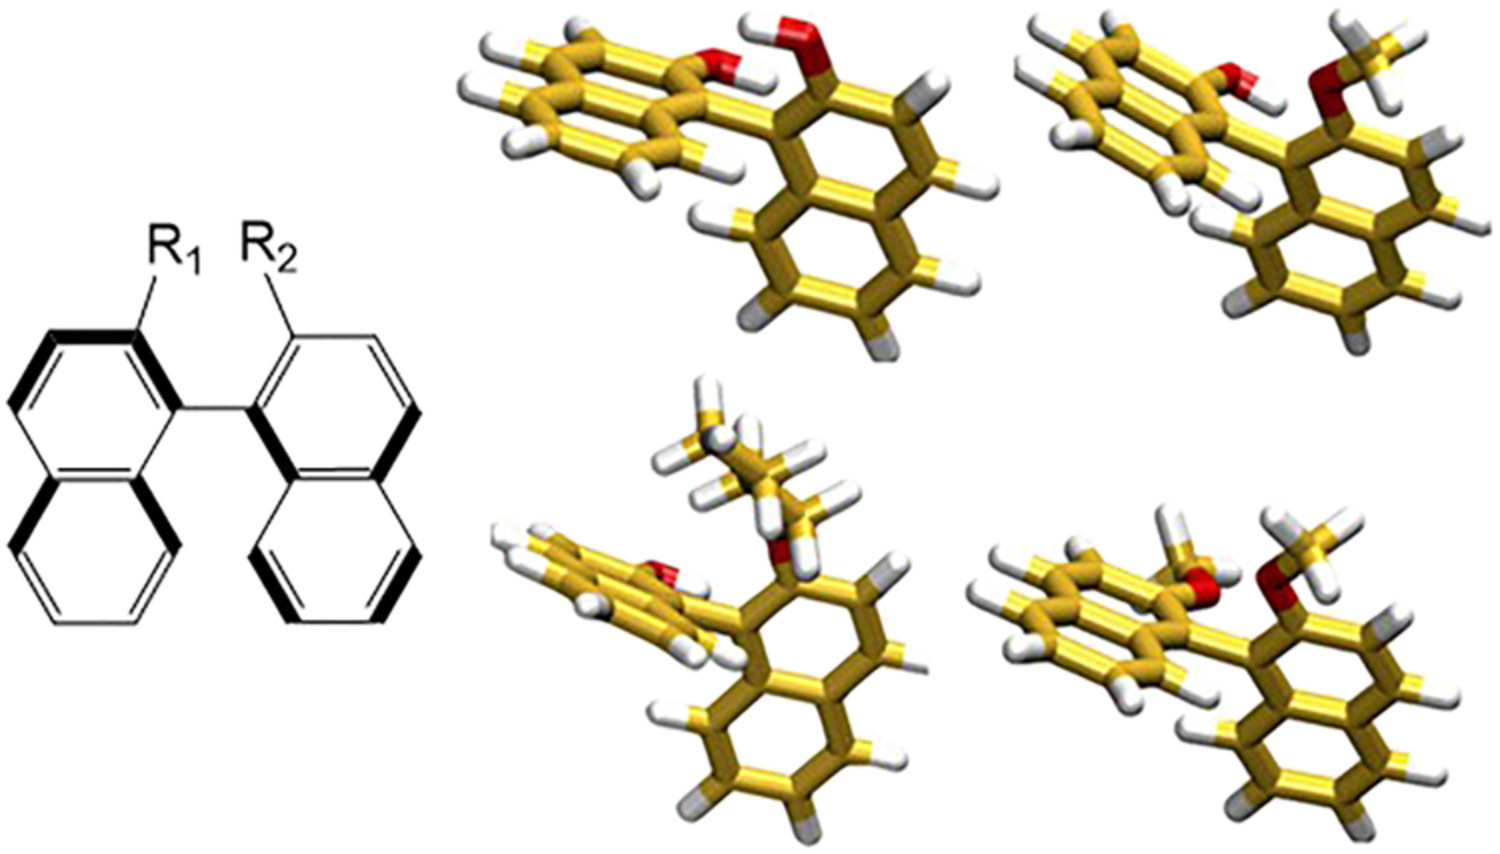
Figure S19. DFT optimized structure of [(S)-1] expected in CH2Cl2 solution.
Figure S20. Emission spectra of the 5D0 → 7FJ (J = 0,1) transitions measured in CH2Cl2 solution under 335 nm (29,851 cm−1) irradiation at room temperature for [(S/R)-1] (a), [(S,S,S/R,R,R)-2] (b), [(S/R)-3] (c) and [(S,S,S/R,R,R)-4] (d).
Figure S21. Emission lifetime decays (black dots) and mono-exponential fit curves (red line) for [(S/R)-1] (a), [(S,S,S/R,R,R)-2] (b), [(S/R)-3] (c) and [(S,S,S/R,R,R)-4] (d) in CH2Cl2 solution excited at 330 nm (30,303 cm−1).
Figure S22. Emission lifetime decays (black dots) and mono-exponential fit curves (red line) for [(S/R)-1]n (a), [(S,S,S/R,R,R)-2]n (b), [(S/R)-3]n (c) and [(S,S,S/R,R,R)-4]n (d) in solid-state excited at 330 nm (30,303 cm−1).
Table S1. Cell parameters for [(S,S,S)-4]n
Table S2. X-ray crystallographic data for n.
Table S3. SHAPE analysis of the coordination polyhedra around the lanthanide in the polymeric compound n.
Table S4. Selected dissymmetry factors glum for [(S/R)-1] in CH2Cl2 solution at room temperature.
Table S5. Selected dissymmetry factors glum for [(S,S,S/R,R,R)-2] in CH2Cl2 solution at room temperature.
Table S6. Selected dissymmetry factors glum for [(S/R)-3] in CH2Cl2 solution at room temperature.
Table S7. Selected dissymmetry factors glum for [(S,S,S/R,R,R)-4] in CH2Cl2 solution at room temperature.
Table S8. Experimental lifetime (τobs) for the europium compounds in solid-state excited at 330 nm (30,303 cm−1).
Table S9. Selected dissymmetry factors glum for [(S/R)-1]n in solid-state at room temperature.
Table S10. Selected dissymmetry factors glum for [(S,S,S/R,R,R)-2]n in solid-state at room temperature.
Table S11. Selected dissymmetry factors glum for [(S/R)-3]n in solid-state at room temperature.
Table S12. Selected dissymmetry factors glum for [(S,S,S/R,R,R)-4]n in solid-state at room temperature.


留言 (0)