Animal samples
Experiments were performed using pigs from two different populations: Tibetan pigs living in highlands (Linzhi, 3,000 m, TP) and Yorkshire pigs that migrated from lowlands (Beijing, 100 m) to highlands (Linzhi, 3,000 m, YP) approximately 3 yr ago. TP and YP were raised in the Tibet Agricultural and Animal Husbandry University Farm (Linzhi, 3,000 m) and Tibet Linzhi Ga Ma Breeding Co., Ltd. (Linzhi, 3,000 m), respectively, and ten boars (1.5 yr old with normal fertility and nutrition levels) from each population were used in this study (YP was used as the control group).
Semen collection and quality analysis
Twenty fresh semen samples, one per boar, were obtained from 10 TP and 10 YP by using the gloved-hand technique. After semen collection, no adverse effects on the health and growth of pigs were observed. Sperm quality was measured by sperm motility parameters and ROS levels. A computer-assisted semen analysis (CASA) system (Hamilton Thorne Research, Beverly, MA, USA) was used to measure the sperm concentration, motility, and VAP according to the manufacturer's instructions. In short, semen was incubated at 37 °C for 10 min, and then, 3 μL of semen was dropped onto a preheated (37 °C) Makler sperm count board, and sperm motility and other parameters were assessed by using the CASA system. At least 3 visual fields were observed to obtain an average. Diff-Quik staining was performed to detect the abnormal sperm rate [11]. Briefly, semen was fixed in 3.7% paraformaldehyde for 10 min, washed with PBS two times, resuspended in PBS, smeared, and stained according to the manufacturer's protocol for the Diff-Quik Stain Kit (D030-1–2, Nanjing Jiancheng Bioengineering Institute, Nannjing, China). The experiments were repeated three times, and at least 200 spermatozoa were counted in each count at 400 × under and ordinary light microscope. According to the manufacturer's protocol for the ROS assay kit (S0033M, Shanghai Beyotime Biotechnology Co. Ltd, Shanghai, China), the sperm ROS levels were evaluated by using the probe 2′,7′-dichlorodihydrofluorescein diacetate (DCFH-DA). Briefly, the semen samples were washed with PBS three times, resuspended and incubated with 10 μM DCFH-DA at 37 °C in the dark for 25 min. For the determination of the deesterification of intracellular DCFH-DA to dichlorodihydrofluorescein via oxidization by ROS, which has strong fluorescence, the fluorescence intensity was monitored using a fluorescent microplate reader (Biotek Synergy, SynergyH4, USA) at an excitation wavelength of 488 nm and at an emission wavelength of 525 nm.
Protein preparation
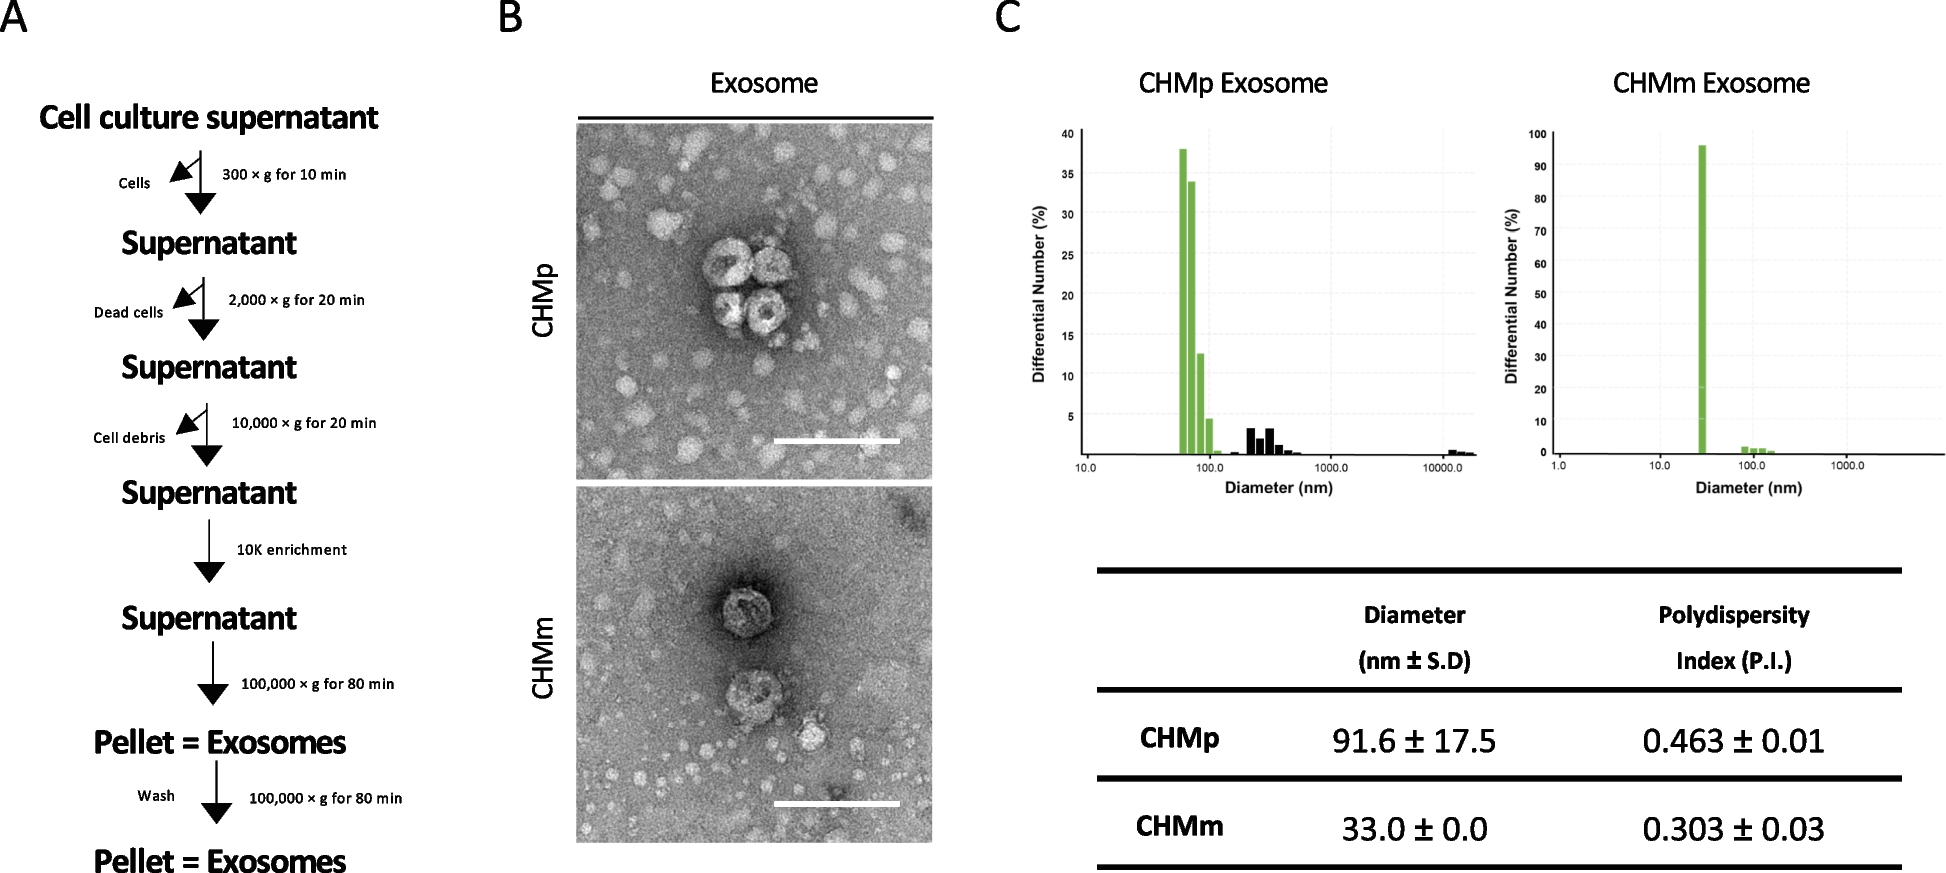
To remove seminal plasma and contamination (e.g., extender components and somatic cells, such as leukocytes and testicular cells), the semen samples were centrifuged at 500 × g for 20 min in a discontinuous (70% [v/v] and 35% [v/v]) Percoll gradient (Sigma, St Louis, MO, USA), and then, the sperm pellets were washed 3 times with cold phosphate-buffered saline (PBS). For protein extraction, each sperm sample (3 × 10⁸ spermatozoa) was resuspended in lysis buffer (8 M urea, 4% CHAPS, 50 mM DTT and protease inhibitor, pH 8.0) at 4 °C. The lysates were centrifuged at 10,000 g for 30 min to remove insoluble material, and the supernatants were collected for further analysis. The protein content was measured with a Bradford protein assay kit (P0006C, Beyotime Institute of Biotechnology, Nanjing, China).
Protein labeling and liquid chromatography coupled with tandem mass spectrometry (LC–MS/MS)
Equal aliquots of proteins (100 mg each) from the sperm samples were digested using filter-assisted sample preparation (FASP) as previously described [12]. The resulting TP and YP peptides were labeled 116 (TP1), 121 (TP2), 113 (YP1) and 119 (YP2) according to the instructions of the iTRAQ® Reagent-8PLEX Multiplex Kit (4,381,663, AB SCIEX, USA). The proteomic experiments required a more complex peptide mixture than the protein mixture. As a consequence, the peptides needed to be separated by two dimensional liquid chromatography. The first dimension was performed with a high-pH C18 reverse phase separation; 8–10 fractions were collected first, and each fraction was separated by a two-step nano-LC separation combined with high resolution mass spectrometry. The aim of the two dimmensional LC was to simplify the peptide component to increase the peptide signal for MS and allow more proteins to be identified. The combined peptide mixture was resuspended in buffer A (98% ddH2O, 2% acetonitrile, ACN, pH 10.0) and prefractionated by high-pH reverse-phase liquid chromatography (hp-RPLC) using an XBridge C18 column (130 Å, 3.5 µm, 4.6 mm × 250 mm,Waters, Milford, MA, USA) and an HPLC system (e2695, Waters, Milford, MA, USA) at a flow rate of 0.5 mL/min. The column was eluted with a 51 min gradient of 0 ~ 5% buffer B (98% acetonitrile, pH 10.0) for 5 min, 5 ~ 35% buffer B for 45 min, and 35 ~ 50% buffer B for 10 min at a flow rate of 1 mL/min. Forty fractions were collected and pooled into ten aliquots. The fractions were desalted using Zip-Tip C18 Tips (Millipore, USA; Cat. 87,782), suspended in buffer A (2% ACN, 0.1% FA), and analyzed on a nano-LC system (Easy nLC 1000, Thermo Fisher Scientific, Odense, Denmark) in tandem with an LTQ-Orbitrap Elite mass spectrometer (Thermo Fisher Scientific, Bremen, Germany). MS/MS scans in the range of m/z 350 to 1800 were recorded with a mass resolution of 70,000 at m/z 400. The LC–MS/MS data were acquired in data-dependent mode, and the ten most intense precursor ions were isolated and fragmented by collision-induced dissociation (CID) with 32% normalized collision energy. Dynamic exclusion was enabled (exclusion list size: 500, exclusion duration: 40 s).
Database search and bioinformatics
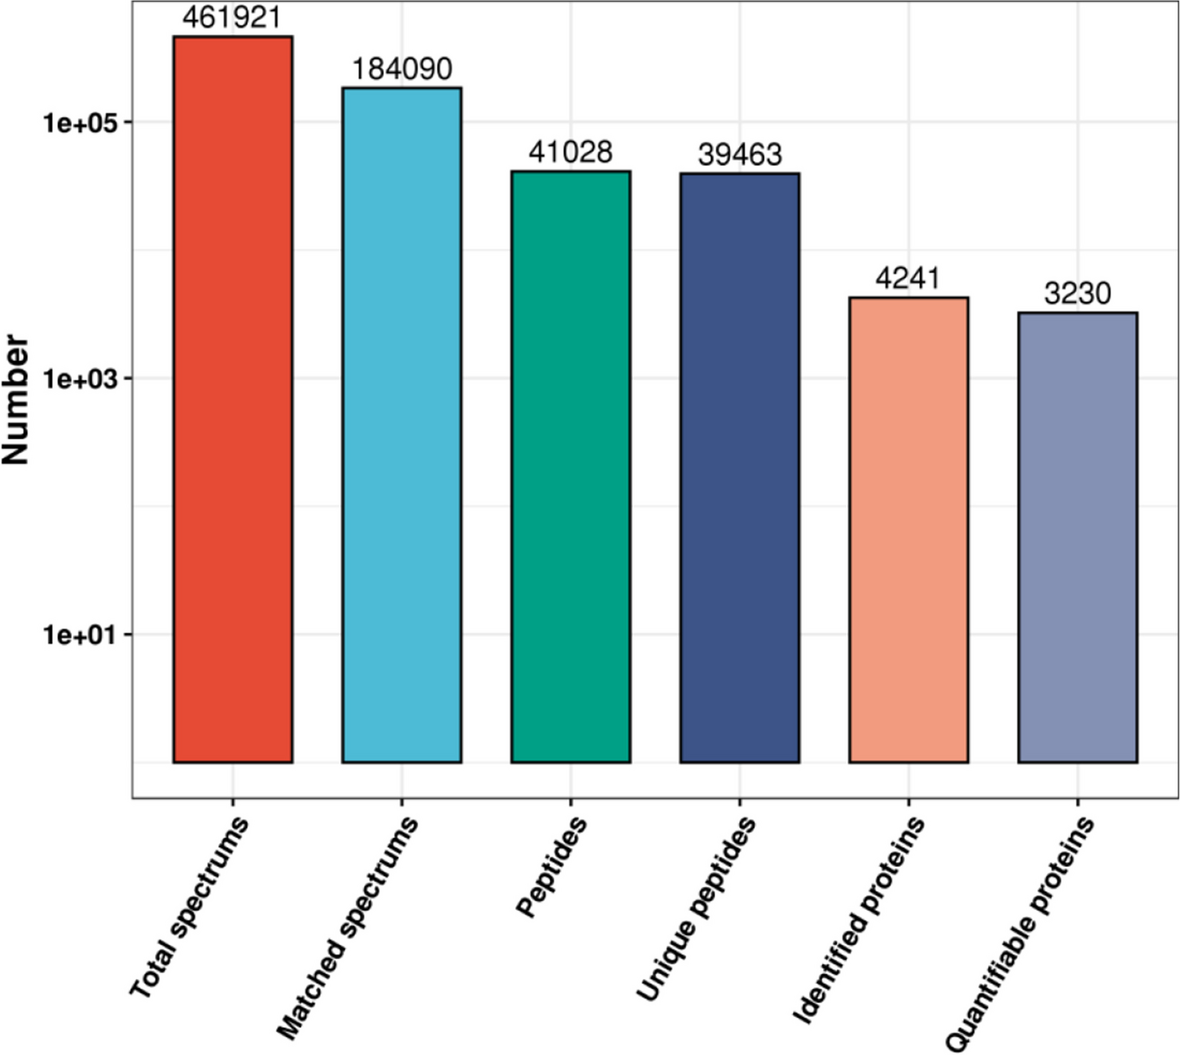
The MS/MS data were searched against the NCBI Sus_refesq_20180716.fasta (63,695 sequences) Fasta database for peptide identification and quantification using Mascot 2.5.1 and Proteome Discoverer 1.4 (Thermo). The search parameters were specified as follows: one missed enzymatic cleavage site was allowed, the mass tolerance was set to 10 ppm for precursor ions and ± 0.05 Da for fragment ions, carbamidomethylation was set as the fixed modification, and oxidation and iTRAQ-4plex were set the variable modifications. The false-positive detection rate (FDR) was calculated using a decoy database search with a FDR < 1.0%, which allowed each protein to be identified by at least 1 specific polypeptide, normalized to the median of the data. We compared the expression levels of all the identified proteins between the TP and YP groups to identify the proteins involved in reproductive traits of boars on plateaus. Student’s t-test was used to compare differences in protein expression between the TP and YP groups and to calculate the p values. p < 0.05 and a fold change ≥ 1.5 or ≤ 0.67 were set as the thresholds to identify differentially expressed proteins (DEPs). The average of six labeled sample mixtures was used as a reference (ref) based on the weighted average of the intensity of the reported ions for each identified peptide. The final ratios of proteins were normalized according to the median average protein ratio for the mixtures of different labeled samples (TP1/ref, TP2/ref, YP1/ref, and YP2/ref).
The DEP data were analyzed using bioinformatics, and the UniProt IDs of the DEPs were converted into mouse UniProt IDs due to the small number of studies on gene function in pigs. The gene ontology (GO) annotation and DEP enrichment were analyzed using the GO consortium database for GO assignment (http://geneontology.org/). Kyoto Encyclopedia of Genes and Genomes (KEGG) pathway and protein–protein interaction (PPI) analyses were performed using STRING online software (https://string-db.org/). The results of the GO analysis were mapped into a senior bubble map using the OmicShare tool, a free online platform for data analysis (http://www.omicshare.com/tools), which was also used to map the volcano figure and heatmap. The PPI networks were visualized and analyzed using Cytoscape 3.2.1 software [13].
Validation of DEPs by western blot analysis
From the differentially expressed proteins, we randomly selected four proteins, Cofilin-1 (CFL1), pro-epidermal growth factor (EGF), fibronectin 1 (FN1), and glutathione peroxidase 4 (GPX4), for western blot analysis (three replicates) to validate their expression levels in TP and YP spermatozoa; beta actin (β-actin) was used as a loading control. The bar line charts were created using Sigmaplot 10.0 (Systat Software, San Jose, CA, USA). In brief, denatured sperm proteins (30 µg) from TP and YP were separated by sodium dodecyl sulfate–polyacrylamide gel electrophoresis (SDS-PAGE with a 4% stacking gel and 12% separating gel) and transferred to polyvinylidene fluoride (PVDF) membranes using a Hoefer TE22 blotting instrument (Hoefer, Holliston, MA, USA). The membranes were blocked overnight in blocking buffer (P0071, Shanghai Beyotime Biotechnology Co. Ltd, Shanghai, China), incubated with the appropriate primary antibody (1:1000, ab42824, ab231103, ab32419, ab231174 or ab8227, Abcam, Cambridge, UK) and gently shaken at room temperature for 2 h. After three washes with phosphate-buffered saline containing 0.1% Tween 20 (PBST), the membranes were incubated with the appropriate secondary antibody (1:1000, A0208, Beyotime Ltd., Shanghai, China) for 1 h. After three washes in Tris-buffered saline with Tween 20 for 30 min, the immune complexes on the membranes were visualized using BeyoECL Plus (P0018S, A0216, Beyotime Ltd., Shanghai, China) following the manufacturer’s instructions. To determine the expression levels of CFL1, EGF, FN1 and GPX4 relative to that of β-actin, the gray value of the bands was analyzed using ImageJ 1.44 (NIH, Bethesda, MA, USA).
Statistical analysis
Statistical analyses were performed using IBM SPSS Statistics v17.0 (SPSS, Inc., Released 2008. SPSS Statistics for Windows, Version 17.0. Chicago: SPSS, Inc.). Graphs were prepared using SigmaPlot 10.0 (Systat Software, San Jose, CA, USA). Homogeneity of variance and one-way analysis of variance (ANOVA) were used to determine the significance of differences between two groups. All quantitative data are presented as the mean ± standard deviation (S.D.). We considered P < 0.05 (*) as statistically significant and P < 0.01 (**) as extremely statistically significant.


留言 (0)