
記住我

Traumatic brain injury (TBI) is a major health care problem worldwide. In recent estimates, the global incidence of TBI is as high as 900 cases per 100,000 individuals [1] and today, millions are living with TBI-related long-term disabilities [2-4]. Mild TBI (mTBI) is the least severe type of TBI. It is associated with subtle or no alteration of consciousness and the absence of overt intracranial abnormalities, constituting 70%–90% of overall TBI cases [1, 5]. Despite the term “mild”, mTBI has been suggested to be linked to a variety of persistent sequelae potentially having significant impact on the daily life of the injured [6]. Recently, it has been recognized that certain sub-populations who are frequently exposed to external impact to the head, via contact sports, military engagement, and domestic violence, are at higher risk for mTBI-related symptoms. Accordingly, these observations have garnered increased public attention for mTBI and its ensuing dysfunction [7, 8]. To date, extensive research has shown that mTBI exerts subtle structural changes with its associated morbidity. However, the overall complexity of mTBI is yet to be revealed. Further complicating our appreciation of the pathobiology of mTBI is the recognition that repetitive mTBIs, a common event in patients, generally portends exacerbated structural and functional responses in comparison to a singular insult. Accordingly, recent research has accelerated on those phenomena associated with repetitive mTBI.
Our lab as well as others have examined repetitive mTBI in animals and have confirmed that repetitive injuries of specific intensity and temporal spacing exacerbate the pathological changes associated with a singular injury alone. These studies conducted in the acute phases of injury assessed axonal injury and its associated anterograde and retrograde sequelae as well as the potential for neuronal death [9-14]. Unfortunately, the majority of the work published in this area has focused on the acute phase response to repetitive mTBI rather than its chronic assessment. Accordingly, the long-term structural and functional changes associated with repetitive mTBI are poorly appreciated, particularly in the context of axotomy and its retrograde neuronal consequences [15-17]. Specifically, it remains unclear whether the axotomized neurons persist postinjury, undergo either hypertrophic or atrophic change or rather do they or other related neuronal populations die over a more chronic time course. Not only are these issues theoretically complex, but also, they present many technological challenges in attempting to achieve their resolution. The reliance on structural or molecular markers of injury presents many barriers due to the diffuse nature of mTBI. Further, the assessment of histological, histochemical and immunocytochemical neuronal markers of injury, together with the rigorous quantitative assessments, also pose significant challenges.
In the current investigation, we examine the acute and chronic consequences of singular and repetitive mTBI using a comprehensive and rigorous approach. To this end, we incorporate spinning disk confocal microscopy to rapidly examine multiple fluorophores in multiple samples from consistent neocortical regions, allowing neuronal numbers, signal intensity and volumetric measures to be critically assessed via 3D-based image analysis algorithms. Following repetitive mTBI, we employ a widely used marker specific to axotomized neuronal soma, phosphorylated c-Jun (Ser 63) (p-c-Jun), to quantitatively assess the axotomized neuronal population. This approach was interfaced with the use of NeuN to assess the overall burden of neuronal loss, with the parallel use of NeuroTrace, a fluorescent Nissl stain dye to provide potential confirmatory information on neuronal survival in the neocortical areas evaluated. This approach was predicated on the recent observation that antibodies to NeuN may not represent the full number of existing neurons [12]. Using large-volume data sets obtained from the same neocortical regions of differently injured animals, we confirmed that repetitive mTBI resulted in an increased burden of axotomy as evidenced by increased number of p-c-Jun profiles. Despite these rather dramatic axotomy-mediated responses, the related neocortical domains showed no evidence of neuronal cell death. Rather, TBI induced a divergent response with respect to NeuN expression within the axotomized and non-axotomized neuronal populations. Collectively, these studies of repetitive mTBI do not support the potential for any injury-related neuronal cell loss. Rather, they demonstrate that increased axotomy-mediated changes are the most likely contributor to the resulting pathology and any associated morbidity.
2 MATERIALS AND METHODS 2.1 AnimalsAdult male mice C57BL/6J (#000664, Jackson Laboratory, Bar Harbor, ME) (8–11 weeks) were obtained directly from the vendor and kept in house for 48 h to habituate prior to experimentation. Animals were housed in vivarium under a 12-h light/12-h dark cycle with free access to food and water. The ambient temperature of vivarium and surgery room were set at 22.2℃ and maintained within the range consistent with the Guide for the Care and Use of Laboratory Animals: 8th Edition. All experimental procedures were conducted during the light cycle. A total of 32 animals were subjected for experimentation after group assignment described below.
2.2 Experimental designThe overall experimental design is summarized in Figure 1. Animals were randomly assigned into one of the following 5 experimental groups defined by the number of injuries and survival time after the first mTBI. These groups included a “Sham” group (“SH” group), an acute-phase with single mTBI group (“AS” group), an acute-phase with repetitive mTBI group (“AR” group), a chronic-phase with single mTBI group (“CS” group) and a chronic-phase with repetitive mTBI group (“CR” group). Experimental TBI was induced by central fluid percussion injury (cFPI). Three combinations of cFPI and/or sham injury were administered to the animals at an interval of 3 h. These included repetitive sham injuries (SH group), single cFPI followed by sham injury (AS and CS groups) or repetitive cFPI (AR and CR groups). From the initial mTBI, overall survival times of 24 h postinjury (24hpi) were employed for those in the SH, AS and AR groups while a 28-day postinjury survival time (28dpi) was employed for those in the CS and CR groups, respectively. Sample size of each group was determined to achieve adequate statistical power to observe significant differences in the number of axotomized neurons at 24hpi between single and repetitive mTBI (i.e., between AS and AR) based on our previous experience [12]. A smaller sample size was assigned for the SH group because minimum histological change and minimum inter-animal variability of data were anticipated. Accordingly, 4 animals were assigned to the SH group and 7 animals were assigned to each of the other experimental groups.

Animals were assigned to 5 experimental groups defined by the number of injuries (none, single or repetitive) and survival time after the first injury (24hpi or 28dpi). Two experimental TBIs were given at a 3-h interval in a form of cFPI at 1.6 atm, an intensity consistent with mild TBI
2.3 Surgical preparation and physiological assessments during surgeryAnimals were subjected to surgical preparation for cFPI as described previously [12]. Briefly, 3 mm diameter craniectomy was prepared along the sagittal suture midway between bregma and lambda, then a 20-gauge luer-lock hub was placed and stabilized on the skull over the craniectomy site using cyanoacrylate and dental acrylic. All surgical procedures were performed sterilely under anesthesia, which was initially induced via inspiration of 4% isoflurane in 100% oxygen in an anesthesia chamber for 4 min and then maintained with flow of 2% isoflurane in 100% oxygen via a nose cone with the mouse fitted in a stereotaxic frame (David Kopf Instruments, Tujunga, CA). An adequate plane of anesthesia was ensured by checking the absence of toe pinch response.
Body temperature was maintained at 37ºC using thermostatically controlled heating pad with a rectal temperature sensor (Harvard Apparatus, Holliston, MA). Heart rate, respiratory ratio, and arterial blood oxygenation (SpO2) were monitored using thigh-clump pulse oximeter sensor (MouseOx, STARR Life Sciences, Oakmont, PA). After surgery, animals were placed in a cage passively warmed with heating gel until their full recovery from anesthesia.
2.4 Experimental mild TBI and postinjury behavioral assessmentsThe animals were fully anesthetized with inspiration of 4% isoflurane in 100% oxygen in an anesthesia chamber for 4 min. Next, a luer-lock hub installed on the animal's skull was connected with FPI device (Custom Design and Fabrication, Virginia Commonwealth University, Richmond, VA) using a connector tube filled with sterile saline. Details of the device are described elsewhere [18]. The pendulum position of the device was calibrated to target 1.6 atm, an injury intensity previously determined to be in the mild-range [12, 19-21]. The actual intensity of the pressure wave impacting the animal's dural surface was measured by a transducer at the end of the device and displayed on an oscilloscope (Tektronix TDS 210, Tektronix Inc., Beaverton, OR). For sham injury, identical procedures were used except for the pendulum release. The time duration from taking fully anesthetized animal out from the chamber to the finish of the injury procedure was within seconds.
After cFPI, the animals were closely monitored until recovery of the righting reflex, and then returned to a cage. The loss of righting reflex (LORR) durations, an established measure for assessing the loss of consciousness in animals [22], were recorded at each time after the 1st injury (1st LORR) and the 2nd injury (2nd LORR). After the second cFPI, the skin around the injury site was sutured and animals were returned to the vivarium. Since the LORR required evaluation immediately following the traumatic event, induction of cFPI and LORR assessments were performed by the same examiner with appropriate blinding wherever possible.
2.5 Brain tissue preparationAt the designated time point of euthanasia, the animals were intraperitoneally injected with an overdose of pentobarbital and then transcardially perfused with heparinized saline followed by 4% paraformaldehyde in Millonig's buffer pH 7.4. The occipital and parietal bone were promptly removed, then brain was removed from the skull and immersed in the same fixative solution overnight, followed by replacement with Millonig's buffer in 4ºC. Coronally dissected brains between the level of the optic chiasm and the midbrain were embedded in agarose and then were cut using a vibratome (Leica VT1000S, Leica Biosystems, Nussloch, Germany) to obtain 40-µm-thick, serial floating slices directly below the craniectomy site (from −0.58 to −2.5 mm posterior to bregma), a region well known in this mild cFPI model to generate traumatic axonal injury (TAI) in the neocortical gray within the primary somatosensory cortex (S1) [12, 19-21]. Sections were collected in 24-well plate and stored in Millonig's buffer pH 7.4 at 4ºC. Of total 48 sections, the caudal 24 sections were used for the analyses, dividing them into 6 sets of sections containing 4 sections spaced 240 µm apart. One randomly selected set was used in the following immunohistochemical staining.
2.6 ImmunohistochemistryAn antibody to p-c-Jun (Ser 63), a marker of axotomized neuronal soma, was used to visualize axotomized neurons. To preclude the potential that any observed axonal damage led to cell death or a death independent of axotomy, we employed NeuN together with NeuroTrace, a florescent Nissl dye. For counterstaining nuclei, DRAQ5 was chosen and used for cell segmentation in the automated image processing employed in this study.
All samples were stained in the same one session employing randomization and blinding to preclude animal identity. Free-floating sections placed in culture plates were washed with PBS then subjected to heat induced epitope retrieval (HIER) by being immersed in 10 mM sodium citrate buffer pH 8.5 with 0.05% Tween-20 and warmed from outside of the plates for 10 min with heated water at a temperature of 80ºC [12, 20, 21]. After gradual cooling at room temperature, sections were incubated in blocking buffer (10% normal goat serum and 0.5% Triton X-100 in PBS) for 1 h and then incubated with primary antibodies in a dilution buffer (1% normal goat serum and 0.5% Triton X-100 in PBS) overnight at 4ºC temperature. The sections were then washed with a dilution buffer and incubated in secondary antibody solution (secondary antibodies in dilution buffer) for 2 h. After several washing with dilution buffer and PBS, sections were immersed in the counterstain solution for 2 h in room temperature. Sections washed with 0.1 M Na-phosphate buffer were placed on plain glass slides individually and sealed with mounting medium.
Primary antibodies to the following antigens were utilized in the indicated dilutions; p-c-Jun (Ser63) (anti-rabbit monoclonal IgG, clone SY0297, NBP2-67471, 1:200, Novus, Littleton, CO), NeuN (anti-mouse monoclonal IgG1 clone A60, MAB377, 1:500, Millipore, Billerica, MA). Fluorophore-conjugated secondary antibodies were utilized in the indicated dilutions; goat-derived anti-rabbit-IgG Alexa A568 (1:500, Thermo Fisher Scientific, Waltham, MA), goat-derived anti-mouse-IgG1 Alexa A488 (1:500, Thermo Fisher Scientific). The mixture of the following dyes in PBS were utilized as counterstain solution with the indicated dilutions; NeuroTrace 435/455, a fluorescent Nissl stain (N-21479, 1:100, Thermo Fisher Scientific), DRAQ5 (1:500, Thermo Fisher Scientific). VECTASHIELD Vibrance (Vector Laboratories, Burlingame, CA) was used as mounting medium.
2.7 Spinning disk confocal microscopyTo address the technically demanding need to rapidly acquire multiple fluorescently labeled images from a large number of samples covering a large neocortical region, image acquisition was performed using a spinning disk confocal microscope, an inverted fluorescence microscope (Axio Observer Z1, Carl-Zeiss Microscopy GmbH, Jena, Germany) equipped with a spinning disk unit (CSU-X1A, Yokogawa, Tokyo, Japan) and an electron multiplication charge coupled device (EMCCD) camera (Photometrics Evolve 512). Prior to the image acquisition, unified setting for gain and exposure time were determined for each channel (wavelengths of 405, 488, 561 and 639 nm) using randomly selected samples from experimental slide set. Image acquisition was then performed in random order and in blinded fashion as follows; the field of view was centered initially over the S1 along the dorsolateral edge of the hippocampus using a dry 10x objective lens (EC Plan-Neofluar 10x/0.30), followed by adjustments to maintain centering midway between upper and lower limit of neocortical layer V with a dry 20x objective lens (Plan-Apochromat 20x/0.8). Next two-by-two tiled, z-stack images were captured, with voxel size of 0.67 × 0.67 × 0.44 µm. The tile sets were automatically stitched with ZEN 2.0 blue (Carl-Zeiss Microscopy GmbH, Jena, Germany) to obtain images of 666.00 × 665.33 µm in size in the X-Y plane. After acquisition, the region of interest (ROI) equaling 630 × 200 µm was chosen with its long axis paralleling the cortical laminae in layer V and VI. These were determined individually by visualizing the NeuN-channel image. This ROI included pyramidal layer V which was chosen based on our previous experience with this model [12, 20]. On 4 sections from each animal, images of ROI on both hemispheres were captured, yielding total 8 tiled, composite images from each animal.
2.8 Cell detection and quantitative image analysisThe stitched image data were deconvolved (15–20 iterations) using nominal objective point spread function (PSF) and signal to noise ratio (SNR) of 25. The maximum likelihood (ML) deconvolution was implemented in Huyghens (version 18.04, Scientific Volume Imaging, Hilversum, Netherlands). The deconvolved 3D images were further processed and quantified using a custom-built algorithm implemented in MATLAB (version R2018a, MathWorks, Natick, MA). First, background was estimated with grayscale opening (19-pixel radius) for each color channel and subtracted from the deconvolved images. Threshold values of signal intensity for each marker were empirically determined by two expert observers using randomly selected images from the experimental image set. Voxels where the signal intensities were equal or greater than these static thresholds were considered positive and included in the respective channel masks. Voxel intensities below the threshold were set to zero. The first step of cell segmentation was conducted using the DRAQ5 channel where nuclei were isolated as sets of 27 voxels (8-connected). Adjacent nuclei were split with the Euclidean distance (ED) transform of the initial masks, followed by watershedding. Cell masks were generated by thresholding NeuN and NeuroTrace channels, followed by constrained dilation of nuclear masks (up to 10 iterations) used as seeds. If no cellular mask corresponding to a nucleus was present owing to insufficient signal quality, the nuclear mask was slightly dilated by 5 voxels and used as a surrogate. The nuclear masks were then subtracted from their cell counterparts to form cytoplasmic masks. The cells which did not have the corresponding nuclei detected were segmented using NeuroTrace data (thresholding followed by watershedding).
Signal intensities within the respective masks were used to quantify p-c-Jun and NeuN present in whole cell body, nucleus and cytoplasm. First, cumulative and mean signal intensities of p-c-Jun were calculated. The former represents the total amount of p-c-Jun whereas the latter its concentration in the corresponding compartment. Next, cumulative signal intensity of NeuN was calculated for ROI to represent total amount of NeuN presenting within the region. Cumulative and mean intensity of NeuN were calculated for single neurons as well. Finally, subpopulations of neurons positive and negative for either p-c-Jun or NeuN were identified in distributions of the respective signal intensities and verified using randomly selected images.
Volumetric assessment was performed to evaluate any potential morphological change in related to cellular response to the burden of TAI. Volume of the masks, cellular components and p-c-Jun+ profiles were calculated from the respective counts multiplied by the voxel volume (0.196 µm3).
Lastly, relationships between the cellular volume and the occurrence of axotomy or the attenuation of NeuN expression were evaluated. Neurons were divided into the quintiles based on cellular volume within neuronal populations of each individual animal as follows; Ex-S, extra-small (the minimum-20 percentile of cellular volume); S, small (20–40 percentile); M, middle (40–60 percentile); L, large (60–80 percentile); Ex-L, extra-large (80-the maximum). The fractions of p-c-Jun+ neurons or NeuN+ neurons within whole neuronal population were compared between subgroups within each experimental group.
2.9 Cell screening strategyNissl staining is highly sensitive for neurons, however, it is also known to stain glial cells [23, 24], although they lack cytoplasmic reaction for the Nissl dye [25-29]. To minimize potential glial contamination, we employed cell screening on identified cells via two criteria based on volumetric data of individual cells. Those cells in which the cellular volume was below 231.77 µm3, equaling the 99-percentile value of NeuroTrace−/NeuN− cells, or those cells for which the ratio of nuclear volume to cellular volume (nuclear-cellular volume ratio, NCVR) exceeded 0.5 were considered glia and eliminated from the further analyses.
2.10 Statistical analysisUnless specifically stated, data pooled from each animal were considered a statistical unit. Normality of the data distribution was analyzed by Shapiro-Wilk test. Homogeneity of the data distribution was analyzed by the Brown–Forsthye test. Differences between two experimental groups were analyzed by Welch's test for parametric data or by Brunner-Munzel test for nonparametric data. Pairwise comparisons between two different subgroups within the same group were analyzed by pairwise Welch's test for parametric data or by Wilcoxon's signed rank test for nonparametric data. Comparisons between pairs of proportional data were analyzed by Pearson's chi-square test. Multigroup comparison of physiological background between groups was assessed by Kruskal-Wallis test. For other multi-group comparisons, statistical analyses were performed for comparisons between the SH group and each injured group, between single and repetitive injury groups of the same time points (i.e., AS vs AR and CS vs CR), and between acute-injured and chronic-injured groups of corresponding injury mode (i.e., AS vs CS and AR vs CR). Pairwise comparisons between two populations within each experimental group were also performed as needed. In these multi-group comparisons, pooled p values were adjusted using Holm's method. All analyses were performed as two-sided. P values below 0.05 were considered as significant. In addition, correlation coefficient r for numerical data and/or odds ratio (OD) for proportional data were calculated for each pair of comparison to evaluate effect size of different experimental settings on the differences in the results. Data was summarized as mean ± standard error of the means (SEM). All statistical analyses were performed using R software (version 3.6.2) [30] with the following add on packages; “brunnermunzel” [31], “compute.es” [32], “exactRankTests” [33], “ggplot2” [34], “Rmisc” [35], “vcd” [36, 37]. Full list of the used packages are shown in Table S1.
3 RESULTS 3.1 Physiological data, injury intensity and loss of righting reflex durationsPhysiological data, injury intensity and duration of LORR are summarized in Table S2.
There were no significant differences in age and body weight at the time of the surgery. Animals were maintained in physiological homeostasis, with the maintenance of normal heart rate, respiratory rate, and oxygen saturation levels.
The intensity of the first cFPI for the AS, AR, CS and CR groups was 1.59 ± 0.00 atm, followed by 352 ± 17 s of LORR. The SH group, employed a sham injury, demonstrated 17 ± 2 s of LORR at this time point. With the second cFPI, the injury intensity for the AR and CR groups reached 1.58 ± 0.01 atm, followed by 290 ± 9 s of LORR. Consistent with our experimental design (Figure 1), the other 3 groups were subjected to sham injury at this time point and demonstrated 19 ± 2 s of LORR.
Overall, background parameters and physiological data during surgery were equal over all groups and the intensity of cFPI and duration of LORR were all consistent with our previous studies using the same mTBI model [12, 20, 21].
3.2 General histological observationsGross histological findings of the AS and AR groups demonstrated features consistent with acute phase observations described in previous studies using a cFPI model of mild injury [12, 19-21]. Overall tissue integrity was well preserved. The dorsal neocortex underneath the craniectomy site did not demonstrate contusion or cavitation. The brain parenchyma was free from any overt hemorrhage or hematoma. Isolated petechial hemorrhage was occasionally observed in the subcortical layer and/or corpus callosum. As expected, the SH group was unremarkable. Overall histology of chronic-injured groups appeared similar to the acute-injured groups, with the exception that isolated petechial hemorrhage could no longer be visualized. In summary, only minimal histological changes were noted throughout all samples, consistent with the nature of mTBI.
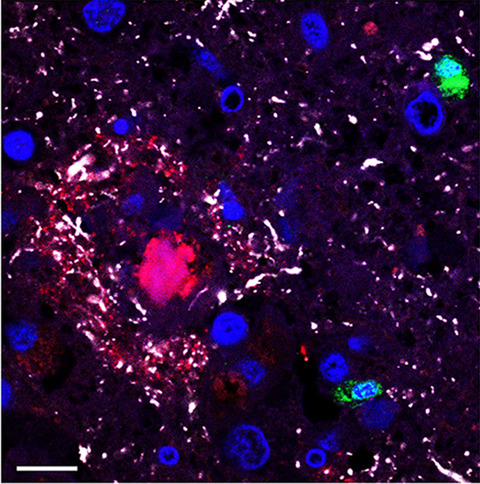
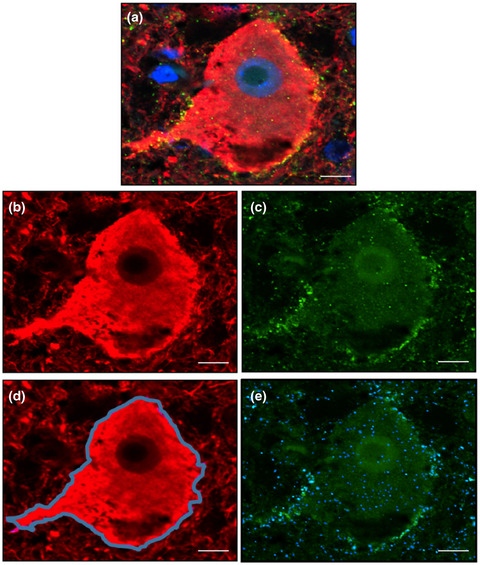
Immunofluorescently labeled brain tissues evaluated with spinning disk microscope demonstrated NeuN+ cells that were equally dispersed throughout the tissue sections regardless of experimental grouping, with the majority colabeled with NeuroTrace (Figure 2A,B). These cells also colabeled with DRAQ5. Those cells negative for either of NeuroTrace and NeuN, but positive for DRAQ5 were considered glia.

Representative images of immunofluorescently labeled cortical layer V. Tissues were labeled for NeuN and p-c-Jun and counterstained for neurons and nuclei with NeuroTrace (fluorescent Nissl dye) and DRAQ5. (A) Representative images from AR group after deconvolution (upper row), corresponding merged images (middle row) with the following color allocation; NeuroTrace (NT; cyan), NeuN (NN; red), p-c-Jun (pcJ; yellow) and DRAQ5 (D5; blue). Deconvolved images were further processed to generate cellular/cytoplasmic, nuclear and p-c-Jun+ masks (lower row). (B) Magnified images of the region indicated with yellow frame, showing cells differently labeled for the markers. NT+ NN+ cells including both p-c-Jun+ (arrowhead with asterisk) and p-c-Jun− cells (arrowhead) are most likely neurons. NT+ NN− cells are including both p-c-Jun+ (arrow with dagger) and p-c-Jun− (arrow). A cell negative for both NT and NN is also observed (dashed oval). Note that NT+ NN− cells are not necessarily neurons because NeuroTrace is known to stain glial cells, and thus the cellular screening was conducted before the analyses. (C) Representative images of each experimental group. AS and AR groups most frequently demonstrated p-c-Jun+ cells whereas Sham controls demonstrated few. CS and CR groups demonstrated p-c-Jun+ cells to a lesser extent compared to acute phase but were still in higher frequency compared to SH group. In (A and C), images were cropped from the center of an ROI which reveals stitching lines the result of image tiling and scale bars = 50 µm. In (B), brightness is readjusted for NeuroTrace and scale bar = 10 µm. Deconv., deconvolved image
3.3 Overview of whole cellular population and data screeningOverall, tissue harvesting proved excellent. Only one tissue section from an animal in the AR group was lost, with only 6 images obtained for this specific animal. Images of ROI placed in somatosensory layer V were automatically processed and 627,905 cells were identified in all the samples evaluated (NeuroTrace+/NeuN+ cells, 400,011 cells [75.6%]; NeuroTrace+/NeuN− cells, 91,778 cells [17.3%]; NeuroTrace−/NeuN+ cells, 34,839 cells [6.6%]; NeuroTrace−/NeuN− cells, 2766 cells [0.5%]) (Figure 3A,B). As described, cell screening was performed using volumetric parameters of individual cells (Figure 3C–E). After cell screening, 371,102 cells remained and were evaluated (Figure 3A). This population included cells positive for both NeuroTrace and NeuN (303,381 cells, 81.8%), those positive for NeuroTrace alone (48,651 cells, 13.1%), those positive for NeuN alone (18,565 cells, 5.0%) and those negative for both (505 cells, 0.1%) (Figure 3B).

Cell screening strategy to minimize glial contamination. (A) Total 627,905 cells were identified through automated image analysis. Cellular screening based on cellular volume and the volume ratio of nuclear to cell body, NCVR, excluded 256,803 cells with the remaining 371,102 cells subjected to the following assessments. (B–E) Population distributions before and after the screening (left and right of each panel) were depicted for cellular reactivity for NeuroTrace and NeuN (B), cellular volume (C), nuclear volume (D) and NCVR (E), respectively. NCVR, nuclear/cellular volume ratio; NN, NeuN; NT, NeuroTrace
3.4 Repetitive mild TBI exacerbates the burden of traumatic axonal injury in the acute phaseEmploying microscopic examination of the somatosensory neocortex, samples from the AS and AR groups demonstrated neurons with an intense p-c-Jun signal distributed primarily in layer V together with a few scattered p-c-Jun+ neurons in layer II/III as well as hippocampal dentate gyrus and thalamus. These neurons exhibited a p-c-Jun+ profile, that typically equaled or exceeded their nuclear size (Figure 2B,C), a finding previously reported in axotomized neurons at 24hpi [12, 19, 20]. In the SH group, p-c-Jun+ profiles were few. In the CS and CR groups, p-c-Jun+ profiles were reduced in comparison to the AS or AR groups, but were more frequent than the SH group.
The proportion of NeuroTrace+ neurons expressing p-c-Jun was quantitatively assessed to evaluate the burden of TAI in both the acute and chronic phase post mTBI (Figure 4A, Table 1 and Table S3).

Assessment of p-c-Jun expression. (A) Quantitative assessment of p-c-Jun+ neurons, presented as a percentage of all NeuroTrace+ neuronal populations. Data are presented as the estimates and 95% confidential interval. At the acute phase of injury, single and repetitive mTBI demonstrated p-c-Jun+ expression in 10%–13% of neurons, representing the incidence of TAI. At chronic phase of injury, the percentages decreased to approximately 3%. These values were significantly different in all injured groups from SH groups, between single and repetitive mTBI at the same time points and between acute and chronic time points after the same injury paradigm. (B, C) Assessment of p-c-Jun signal intensity. The measurements were performed over the whole cell body (left), within nuclei (center) and within cytoplasm (right). The values were normalized to the threshold value to determine neuronal positivity for p-c-Jun. Data are presented as mean ± SEM. (B) Mean signal intensity, representing the concentration of p-c-Jun within the corresponding cellular compartment, demonstrated significant increase in all three measurements in AS and AR groups compared to SH and to the corresponding chronic groups. However, only the nuclear measurement exceeded the threshold value, suggesting that the p-c-Jun existed in a highly concentrated state within neuronal nuclei relative to their cytoplasm. (C) Cumulative signal intensity, representing the total amount of p-c-Jun within the corresponding cellular compartment, demonstrated significant increase in all three measurements in AS and AR groups compared to SH and to the corresponding chronic groups. *p < 0.05, **p < 0.01, ***p < 0.001
TABLE 1. Quantification of neuronal populations SH AS AR CS CR NeuroTrace+ cells (/ROI) 1936 ± 105 1691 ± 75 1740 ± 100 2078 ± 46 2120 ± 90 NeuN+ cells (/ROI) 1859 ± 31 1497 ± 44 1486 ± 44 1812 ± 33 1889 ± 35 Fraction of NeuN+ neurons in NeuroTrace+ neurons 87.3% (87.1%–87.6%) 81.7% (81.5%–82.0%) 79.9% (79.7%–80.2%) 79.8% (79.5%–80.0%) 81.7% (81.5%–82.0%) in p-c-Jun+ neurons 88.9% (86.8%–90.9%) 89.1% (88.4%–89.7%) 90.7% (90.2%–91.2%) 78.0% (76.5%–79.4%) 78.4% (77.0%–79.7%) in p-c-Jun− neurons 87.3% (87.1%–87.6%) 80.9% (80.6%–81.2%) 78.3% (78.0%–78.6%) 79.8% (79.6%–80.0%) 81.9% (81.6%–82.1%) p-c-Jun+ NeuroTrace+ neurons (/ROI) 29 ± 8 174 ± 31 230 ± 25 59 ± 13 65 ± 17 Fraction of p-c-Jun+ neurons in NeuroTrace+ neurons 1.50% (1.41%–1.60%) 10.3% (10.1%–10.5%) 10.3% (10.1%–10.5%) 2.85% (2.75%–2.95%) 3.05% (2.95%–3.15%) Note Values are presented as “mean ± SEM” for neuronal numbers and “Estimate (95% CI)” for fraction of neuronal populations. Abbreviations: AR, acute-phase with repetitive mTBI; AS, acute-phase with single mTBI; CI, confidential interval; CR, chronic-phase with repetitive mTBI; CS, chronic-phase with single mTBI; mTBI, mild traumatic brain injury; ROI, region of interest; SEM, standard error of the means; SH, Sham.In the acute phase of injury, single and repetitive mTBI demonstrated p-c-Jun+ expression in 10%–13% of neurons, representing the incidence of TAI. In the chronic phase of injury, these percentages decreased to approximately 3%. All of these proportions were significantly elevated from the SH group (i.e., SH vs AS, vs AR, vs CS and vs CR). The differences between single and repetitive mTBI at the same time points (i.e., AS vs AR and CS vs CR) and between the acute and the chronic time points after the same injury paradigm (i.e., AS vs CS and AR vs CR) were all significant as well.
Collectively, the results confirmed the increased burden of TAI after single and repetitive mTBI at 24hpi, consistent with our previous study [12]. In contrast, at the more chronic time point, a much smaller proportion of NeuroTrace+ neurons expressed p-c-Jun, though that remained significantly elevated relative to SH controls.
3.5 Mild TBI induces high concentration of p-c-Jun primarily in neuronal nucleiThe mean and cumulative intensities of p-c-Jun, representing the concentration and their total amount respectively, were assessed (Figure 4B,C, Table 2, Tables S4 and S5). These measurements were performed over the whole cell body, which included the nuclei and cytoplasmic content. The values were normalized to the threshold value used to differentiate between p-c-Jun+ and p-c-Jun− subpopulations.
TABLE 2. Mean and cumulative signal intensity of p-c-Jun SH AS AR CS CR Mean signal intensity Whole cell body 0.140 ± 0.030 0.410 ± 0.040 0.500 ± 0.030 0.180 ± 0.010 0.180 ± 0.020 Nuclei 0.370 ± 0.100 1.10 ± 0.080 1.30 ± 0.060 0.400 ± 0.050 0.400 ± 0.070 Cytoplasm 0.061 ± 0.005 0.290 ± 0.020 0.370 ± 0.020 0.085 ± 0.005 0.084 ± 0.007 Cumulative signal intensity Whole cell body 283 ± 18 1300 ± 87 1647 ± 97 330 ± 17 346 ± 35 Nuclei 109 ± 31 295 ± 17 345 ± 14 112 ± 13 113 ± 21 Cytoplasm 163 ± 15 980 ± 69 1265 ± 81 213 ± 7 219 ± 21 Note Values are presented as “mean ± SEM.” The values are normalized to the threshold value to determine neuronal positivity for p-c-Jun. Abbreviations: AR, acute-phase with repetitive mTBI; AS, acute-phase with single mTBI; CR, chronic-phase with repetitive mTBI; CS, chronic-phase with single mTBI; mTBI, mild traumatic brain injury; SEM, standard error of the means; SH, Sham.In both the mean and cumulative intensities, single and repetitive mTBI demonstrated a significantly higher intensity compared to the SH group in the acute phase of injury (i.e., SH vs AS and SH vs AR) followed by significant decrease over time from 24hpi to 28dpi (i.e., AS vs CS and AR vs CR) in all evaluations for each cellular compartment.
3.6 Mild TBI does not lead to neuronal loss over 28-days postinjuryThe total neuronal population in the neocortex assessed was evaluated using NeuN together with NeuroTrace (Figure 5A, Table 1, Table S6 and S7).

Quantitative assessment of NeuN+ neurons and the marker expression. (A) Absolute numbers of NT+ cells and NeuN+ cells averaged for one ROI. NT+ cells demonstrated no difference from SH group in all groups, suggesting the absence of neuronal loss until 28dpi. In contrast, NeuN+ cells demonstrated significant decrease in the acute phase after repetitive mTBI, followed by returning to SH levels at 28dpi. (B, C) Fraction of NeuN+ cells within NT+ neurons (B) and within p-c-Jun+ and p-c-Jun− neurons (C). (B) NeuN+ cells accounted for 87% of neurons in SH group. In contrast, the other groups delineated 80%, significantly lower from SH group. A significant difference was observed between single and repetitive mTBI at both time points and between acute and chronic phase regardless of number of injuries. (C) NeuN+ neurons accounted for 87%–90% of either populations of SH group and p-c-Jun+
留言 (0)