
記住我

The coronavirus disease (COVID-19) outbreak led to a global pandemic.1 Infection control is significantly important to decrease virus transmission risk. Antiviral drug development and vaccination have been promoted worldwide,2 but new mutated virus variants have appeared, and complete containment of the COVID-19 pandemic remains difficult to predict. Therefore, basic good hygiene practices remains the major approach to protect against COVID-19.1 The Ministry of Health, Labor and Welfare of Japan (MHLW) recommends: (i) ensuring adequate physical distance, (ii) wearing a mask, (iii) maintaining hand hygiene and avoiding the three Cs (closed spaces, crowded places, and close contact) to reduce the risk of transmission.3 However, it is known that wearing a mask increases the facial temperature, and not wearing a mask is permitted during sports or in a hot and humid environment. This is because wearing a mask in a hot environment increases the risk of heatstroke.3
The number of people with heatstroke transported by ambulance was as high as 92,710 in 2019.4 In the summer of 2020, wearing a mask was part of the “new normal,” and precautions to be taken against heatstroke were announced.3 In exercising individuals, wearing a mask increased the facial temperature by 1.76°C.5 Oral temperature also increased with a face mask,6 whereas aural temperature did not show a change (36.49 ± 0.42°C without mask and 36.53 ± 0.45°C with mask).6 A guideline to prevent heatstroke during the COVID-19 epidemic was published.7 Wet-bulb globe temperature (WBGT) is known as an ideal indicator to monitor the risk of heatstroke. In nonexercising individuals, tympanic temperature more accurately represents the core body temperature (BT) than forehead temperature does.8 However, during this pandemic, forehead temperature was often used to screen individuals entering a building. Typically, a difference of 0.4°C is observed between the tympanic temperature and forehead temperature in individuals who do not have chills.9
To the best of our knowledge, there are no studies on changes in vital signs with environmental changes during the current pandemic. The purpose of the present study was to examine how vital signs change depending on the location (outdoor or indoor), presence of face shield (FS), and difference in tympanic and forehead temperature. We hypothesized that pulse rate and forehead and tympanic temperature would rise as WBGT increases and that the use of a FS would affect forehead temperature more than tympanic temperature.
Method ParticipantsThis was a retrospective cohort study carried out in collaboration with MEDIC Japan Inc. (Shibuya, Tokyo). The MEDIC Japan heatstroke prevention data were recorded in the Google Sheets application (Mountain View, CA, USA) between 1 August and 7 September, 2020, to monitor the medical condition during a work shift. Its database is a registry collection from seven medics (five male individuals and two female individuals). Due to invasive and ethical problems with undertaking this study under the extreme heat environment in Japan, only seven medics were available to record the data under the same condition during the study period. This resulted in a small sample size. Participants were chief medics who worked during the study period. MEDIC Japan provides health-care workers as medics at television commercial shooting sites. Medics are health-care professionals who provide COVID-19 medical screening and first aid and ensure infection control under the supervision of a medical control physician. All participating medics were certified as emergency life support technicians or nurses and young healthy pre-hospital health-care providers free from known pre-existing diseases. They wore medical scrubs and a surgical mask. A FS was worn depending on the field condition.
Data collectionDuring their work shift, the participants measured their own vital signs every hour from the commencement of work. The duration of the day shift and the waiting area were variable. Medics recorded weather, including WBGT (°C), air temperature (°C), and humidity (%), and vital signs, which included forehead temperature (°C), tympanic temperature (°C), blood pressure (mmHg), pulse (b.p.m.), and oxygen saturation (%).
To mandate continuous wearing of a mask under the extreme heat environment in Japan, or to mandate continuously not wearing a mask during the COVID-19 pandemic, are invasive and ethical issues. The wearing of masks was dependent on the field situation. Therefore, we could not investigate the effects of wearing a mask by comparing mask-wearing data with nonmask-wearing data in a retrospective study. As recommended by the MHLW, the medical director of MEDIC Japan Inc. also directed to remove masks outdoors when there is adequate physical distance (>2 m) between individuals.3 To maintain good health conditions and prevent heatstroke, the following measures were taken: (i) removing masks outdoors only when there was enough physical distance from others, (ii) keeping adequately hydrated, (iii) taking a break without hesitation when not feeling well.
InstrumentsMiharinbou Pro AD-5698 (A&D Company, Ltd., Toshima-Ku, Japan) was used to measure air temperature, humidity, and WBGT. The WBGT instrument was placed under shade as per the manufacturer’s instructions, but the height at which the instrument should be placed was not specified. The Braun ThermoScan 7 with Age Precision (Braun, Kronberg im Taunus, Germany) thermometer was used to measure BT.
OutcomeOutcomes were forehead temperature (°C), tympanic temperature (°C), blood pressure (mmHg), pulse (b.p.m.), and oxygen saturation (%).
Statistical analysisContinuous variables were reported as mean and standard deviation or median and interquartile range. Categorical variables were presented as counts and percentages. For comparison between the indoors and outdoors cohort, continuous data were compared using Student’s t-test or Welch’s t-test; categorical variables were compared using the χ2-test or Fisher’s exact test, whichever was appropriate. We undertook a significance test for comparison between the two groups wearing FS (with or without) and measurement locations (indoor or outdoor) by calculating the 95% confidence interval for the difference in means. Time of day and vital signs were plotted as mean and standard deviation, and the variation in vital signs was tested with repeated measured ANOVA. Eta-squared was calculated to estimate effect size. In order to confirm vital sign changes and the time of day depending on the location, we carried out a stratified analysis. Spline curves were used to confirm more specifically the transition between WBGT and BT and between air temperature and BT. The significance level was 0.05 (two-tailed) for all tests. We used RStudio (version 1.2.1335; RStudio, Boston, MA, USA) for describing figures and JMP Pro 15.0.0 (SAS Institute, Cary, NC, USA) for statistical analysis.
Results BackgroundThe mean participant age was 23.71 ± 1.28 years. A total of 323 measurements were taken, of which 73.7% were taken during daytime and 77.1% were taken on sunny days (Table 1). The mean air temperature, humidity, and WBGT were 28.2 ± 3.3°C, 65.9 ± 37.5%, and 24.4 ± 2.8°C, respectively (Table 1).
Table 1. Environmental factors overall, by location, and in the presence or absence of a face shield among prehospital health-care providers wearing personal protective equipment Overall Face shield LocationOverall,
n = 323
Missing, n (%)Face shield+
n = 40
Missing,
n (%)
Face shield−n = 283Missing,
n (%)
p-valueIndoor,
n = 216
Missing,
n (%)
Outdoor,
n = 64
Missing,
n (%)
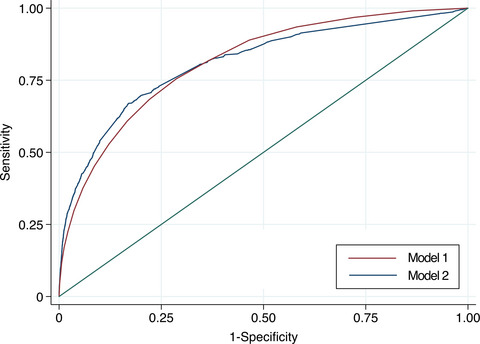
p-value Time zone, n (%)a 0 (0.0) 0 (0.0) 0 (0.0) 0.008* 0 (0.0) 0 (0.0) 0.980 Morning (06:00–09:59) 40 (12.4) 11 (27.5) 29 (10.3) 26 (9.3) 8 (12.5) Daytime (10:00–18:59) 238 (73.7) 25 (62.5) 213 (75.3) 158 (56.4) 46 (71.9) Night-time (19:00–05:59) 45 (13.9) 4 (10.0) 41 (14.5) 32 (11.4) 10 (15.6) Weather, n (%)a 0 (0.0) 0 (100.0) 0 (0.0) 0.010* 0 (0.0) 0 (0.0) <0.001* Sunny 249 (77.1) 39 (97.5) 210 (74.2) 199 (71.1) 47 (16.8) Cloudy 19 (5.9) 1 (2.5) 18 (6.4) 14 (5.0) 5 (1.8) Rainy 2 (0.6) 0 (0.0) 2 (0.7) 2 (0.7) 0 (0.0) Unknown 53 (16.4) 0 (0.0) 53 (18.7) 1 (0.4) 12 (4.3) Environmental factors WBGT, mean (SD), °Cb 24.4 (2.8) 56 (17.3) 24.2 (2.2) 4 (10.0) 24.5 (2.9) 52 (18.4) 0.540 23.9 (2.4) 16 (7.4) 26.4 (2.9) 5 (7.8) <0.001* Caution (21–25°C), n (%)a 156 (48.3) 27 (67.5) 129 (45.6) 138 (63.9) 14 (21.9) <0.001* Warning (25–28°C), n (%)a 79 (24.5) 6 (15.0) 73 (25.8) 47 (21.8) 28 (43.8) Severe warning (28–31°C), n (%)a 25 (7.7) 1 (2.5) 24 (8.5) 15 (6.0) 12 (18.8) Danger (≥31°C), n (%)a 7 (2.2) 2 (5.0) 5 (1.8) 0 (0.9) 5 (7.8) Temperature, mean (SD), °Cc 28.2 (3.3) 56 (17.3) 27.9 (3.1) 4 (10.0) 28.2 (3.3) 52 (18.4) 0.610 27.8 (2.8) 16 (7.4) 29.9 (4.1) 5 (7.8) <0.001* Humidity, mean (SD), %c 65.9 (37.5) 56 (17.3) 63.8 (9.8) 4 (10.0) 66.2 (40.2) 52 (18.4) 0.450 65.6 (43.1) 16 (7.4) 65.8 (9.2) 5 (7.8) 0.940 Abbreviations: SD, standard deviation; WBGT, wet-bulb globe temperature. aχ2-test. bStudent’s t-test. cWelch’s t-test. *Statistically significant. Vital sign changes with environmental factors and time of dayThe correlation between WBGT and vital signs is shown in Figure 1. In general, a weak positive but statistically significant correlation was observed between WBGT and pulse rate (correlation coefficient [95% confidence interval], r = 0.34 [0.23, 0.45]) and between WBGT and BT. In terms of BT, forehead temperature had a stronger correlation than tympanic temperature (forehead, r = 0.33 [0.21, 0.43] versus tympanic, r = 0.17 [0.05, 0.28]; Fig. 1), which also showed a larger effect (forehead, η2 = 0.08 versus tympanic, η2 = 0.05; Fig. 2). A weak negative but statistically significant correlation was found between WBGT and oxygen saturation (r = −0.21 [−0.32, −0.09]; Fig. 1). Systolic and diastolic blood pressure (SBP and DBP, respectively) very weakly or weakly decreased with increasing WBGT and air temperature. Vital signs were maintained within the normal range throughout the day (Fig. 2). Both tympanic temperature and forehead temperature were higher during daytime than at morning or night-time.

Correlation of vital signs with wet-bulb globe temperature (WBGT) overall and in instances with and without a face shield among prehospital health-care providers wearing personal protective equipment. CI, confidence interval.

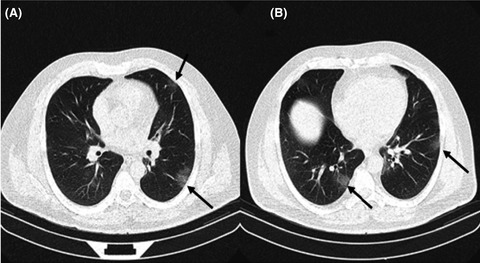
Correlation of vital signs with time of day overall and by location among prehospital health-care providers wearing personal protective equipment.
Use of a FSOf 323 measurements, 40 (2 outdoors and 38 indoors) were taken with a FS and 283 were taken without a FS (Table 1). The following vital signs showed a statistically significant difference between the presence and absence of a FS: SBP (118.5 ± 5.5 mmHg versus 113.5 ± 9.8 mmHg, P = 0.02), pulse rate (63.2 ± 6.1 b.p.m. versus 66.9 ± 8.2 b.p.m., P < 0.001), and tympanic BT (36.6 ± 0.2°C versus 36.6 ± 0.2 °C, P = 0.40; Table 2).
Table 2. Vital signs overall, by location, and in the presence or absence of a face shield among prehospital health-care providers wearing personal protective equipment Overall Face shield Location Vital signs Overall, n = 323 Missing Face shield+, n = 40 Missing Face shield−, n = 283 Missing Mean difference (95% CI) p-value Inside, n = 216 Missing Outside, n = 64 Missing Mean difference (95% CI) p-value n (%) n (%) n (%) n (%) n (%) n (%) n (%) n (%) n (%) n (%) Systolic BP, mean (SD), mmHga 114.0 (9.6) 134 (41.5) 118.5 (5.5) 19 (47.5) 113.5 (9.8) 115 (40.6) −4.97 (−9.29, −0.69) 0.02* 113.5 (9.4) 67 (31.0) 116.2 (10.9) 31 (48.4) −2.69 (−0.98, 6.35) 0.150 Diastolic BP, mean (SD), mmHga 70.4 (8.2) 134 (41.5) 67.4 (8.3) 19 (47.5) 70.8 (8.1) 115 (40.6) −3.40 (−0.32, 7.13) 0.07 69.5 (8.3) 67 (31.0) 73.9 (6.7) 31 (48.4) -4.41 (1.37, 7.45) 0.005* Pulse rate, mean (SD), b.p.m.b 68.4 (10.0) 63 (19.5) 63.2 (6.1) 11 (27.5) 69.0 (10.2) 52 (18.4) 5.76 (1.92, 9.60) <.001* 66.9 (8.2) 23 (10.6) 72.2 (13.1) 4 (6.3) 5.29 (2.51, 8.07) <.001* Oxygen saturation, median, (IQR), %c 98.0 (1.0) 63 (19.5) 97.7 (0.9) 11 (27.5) 97.6 (1.1) 52 (18.4) –0.07 (−0.48, 0.34) 0.73 97.5 (1.2) 23 (10.6) 97.6 (1.0) 4 (6.3) -0.11 (−0.42, 0.20) 0.48 Forehead BT, mean (SD), °Cb 36.6 (0.2) 52 (16.1) 36.6 (0.2) 8 (20.0) 36.6 (0.2) 44 (15.5) 0.20 (0.08, 0.32) <.001* 36.6 (0.2) 16 (7.4) 36.7 (0.3) 1 (1.6) 0.16 (0.07, 0.26) <.001* Tympanic BT, mean (SD), °Ca 36.8 (0.3) 59 (18.3) 36.6 (0.2) 9 (22.5) 36.6 (0.2) 50 (17.7) 0.03 (−0.05, 0.12) 0.40 36.8 (0.3) 15 (6.9) 37.0 (0.3) 8 (12.5) 0.13 (0.06, 0.19) <.001* Abbreviation: BP, blood pressure; BT, body temperature; CI, confidence interval; IQR, interquartile range; SD, standard deviation. aStudent’s t-test. bWelch’s t-test. cMann–Whitney U-test. *Statistically significant.As shown in Figure 1, when a FS was not worn and only a surgical mask was worn, a statistically significant difference was observed in the correlation between WBGT and the following factors: tympanic temperature, forehead temperature, pulse rate, and SBP. The correlation coefficient between WBGT and tympanic temperature was 0.33 (−0.02, 0.61) with a FS and 0.17 (0.04, 0.29) without a FS. The correlation between WBGT and forehead temperature was weakly positive regardless of the presence of a FS (r = 0.27 [−0.09, 0.57] with a FS versus r = 0.34 [0.22, 0.45] without a FS). As WBGT increased, tympanic and forehead temperature increased in individuals wearing a surgical mask but not a FS. Pulse rate and WBGT showed a very weak positive correlation with a FS (r = 0.03 [−0.34, 0.39]) but a weak positive and statistically significant correlation without a FS (r = 0.37 [0.25, 0.48]). Blood pressure and WBGT showed a weak positive correlation with a FS (SBP: r = 0.20 [−0.25, 0.58]; DBP: r = 0.31 [−0.41, 0.65]) but a very weak negative correlation without a FS (SBP: r = −0.17 [−0.32, −0.02]; DBP: r = −0.15 [−0.30, 0.01]). Notably, SBP and WBGT showed a statistically significant correlation in individuals wearing a surgical mask but not a FS (Fig. 1).
LocationAs shown in Table 1, 64 and 216 measurements were taken outdoors and indoors, respectively, and 47 measurements were taken outdoors on a sunny day. All five measurements that recorded WBGT of 31°C or greater were taken outdoors. The mean WBGT indoors and outdoors was 23.9 ± 2.4°C and 26.4 ± 2.9°C, respectively (P < 0.001). Forehead and tympanic temperatures were significantly higher outdoors (36.7 ± 0.3°C and 37.0 ± 0.3°C, respectively) than indoors (36.6 ± 0.2°C and 36.8 ± 0.3°C, respectively; P < 0.001; Table 2). Pulse rate was maintained within the normal range regardless of being outdoors or indoors, but it was higher outdoors than indoors (66.9 ± 8.2 b.p.m. versus 72.2 ± 13.1 b.p.m.; P < 0.001; Table 2).
Wearing a mask outdoors had a large effect on vital sign changes depending on the time of day (Fig. 2). Oxygen saturation had a medium effect size of 0.08 when measured indoors but a large effect size of 0.30 when measured outdoors. Similarly, SBP and DBP had a small effect size of 0.04 and a medium effect size of 0.08, respectively, when measured indoors and a large effect size of 0.45 and 0.51, respectively, when measured outdoors. Forehead temperature measured indoors had a medium effect size of 0.09, but forehead temperature measured outdoors had a large effect size of 0.28. However, tympanic temperature measured indoors and outdoors both showed a medium effect size of 0.09 and 0.11, respectively (Fig. 2).
Tympanic and forehead temperature changes depending on WBGT and air temperatureThere was a difference of 0.2°C between mean tympanic and forehead temperature (36.8 ± 0.3°C and 36.6 ± 0.2°C, respectively; Table 2). Tympanic temperature was higher than forehead temperature at all times (r = 0.33 [0.21, –0.43] versus r = 0.17 [0.05, –0.28]; Fig. 1).
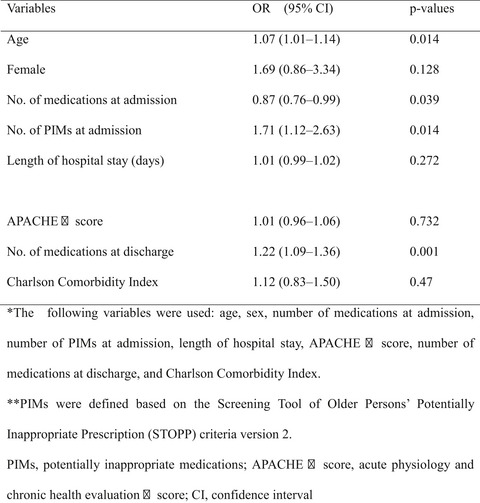
As shown in Figure 3, forehead temperature increased sharply at a WBGT of 28°C and at an air temperature of 33°C. Similarly, tympanic temperature also rapidly increased at a WBGT of 25°C. However, tympanic temperature increased constantly with increasing air temperature without showing an abrupt increase at a certain temperature. When air temperature reached 40°C, there was no difference observed between tympanic and forehead temperature (Fig. 3).

Spline curve
留言 (0)