
記住我


Non-muscle invasive bladder cancer (NMIBC) represents 75–80% of all bladder cancer diagnoses [1]. NMIBC presents challenges, including frequent recurrence which necessitates repeated cystoscopies, and a risk of progression to life-threatening muscle-invasive disease [1, 2]. NMIBCs include low- and high-grade (stage pTa) noninvasive cancers, as well as superficially invasive (stage pT1) tumors. Their risks of recurrence and progression are variable [1, 2] and are currently assessed using clinical algorithms such as the American Urological Association (AUA) risk score [3] which inform the intensity of surveillance and treatment, including intravesical bacillus Calmette–Guérin (BCG) [1-3]. However, these algorithms do not capture the clinical variability seen in NMIBC, which may result from discrete biologic origins known as molecular subtypes. Here, we develop a streamlined approach to NMIBC subtyping and investigate its prognostic significance.
In bladder cancer, luminal and basal subtypes have been identified using mRNA profiles, predominantly from MIBC cases [4-8]. Reflecting distinct differentiation states and gene expression repertoires of basal stem cells or more differentiated luminal (intermediate and superficial) cells in benign urothelium, luminal and basal molecular subtypes may reflect distinct oncogenic pathways [9-11]. These subtypes have yielded a number of promising prognostic and predictive associations that may improve risk stratification beyond standard histologic assessment [4-7, 12, 13]. A consensus subtyping scheme has been developed for MIBC [8], but not for NMIBC. Nevertheless, a basal subtype and two luminal subtypes, urothelial-like (URO) and genomically unstable (GU), have been validated in both NMIBC and MIBC [4, 13-16]. Both URO and GU express urothelial differentiation markers GATA3 and FOXA1 [17, 18], but inactivate cell cycle checkpoints through different mechanisms. URO cancers inactivate the cell cycle regulator RB1 indirectly through loss of CDKN2A, which encodes the p16INK4A cyclin-dependent kinase inhibitor [19-21]. GU cancers inactivate RB1 directly through genomic loss and can have a worse prognosis than URO [13, 20, 22, 23]. GU cancers also demonstrate reduced p63 protein expression compared to URO. Conversely, basal/squamous cell carcinoma-like (SCCL), the most lethal subtype, expresses basal urothelial stem cell markers (e.g. EGFR, KRT5, and KRT14) but not markers of urothelial differentiation (e.g. GATA3 and FOXA1) [10, 24].
While molecular subtyping could yield useful prognostic and predictive information, complex testing paradigms have prevented its clinical implementation. Motivated by the need to separate stromal signals from those of cancer cells, an immunohistochemistry (IHC)-based Lund taxonomy was validated against mRNA subtypes for both MIBC and NMIBC [12, 14, 16, 25].
A mainstay of pathology practice, IHC-based tests, should be easy to implement. However, Lund IHC subtyping uses up to 13 antibodies, posing a barrier to implementation [26]. We therefore identified antibodies routinely used in surgical pathology laboratories that represent cardinal features of luminal and basal subtypes. GATA3 and KRT5 staining distinguish luminal and basal subtypes [9, 27]. Expression of p16 further stratifies luminal subtypes into URO and GU [15, 26, 28]. Here, we validate the diagnostic and prognostic significance of molecular subtypes in an NMIBC cohort using this simplified three-antibody algorithm.
Materials and methods Cohort compositionUnder Queen's University research ethics board approval, including a waiver of informed consent, NMIBC tumors (n = 481) representing 390 patients diagnosed between 2008 and 2016 were collected from Kingston Health Science Centre in Ontario, Canada. All Ta and T1 stage papillary tumors were included, following pathological review (DMB and LC) using the WHO 2004 grading system [29]. Samples were not required to be consecutive for a given patient. Pure carcinoma in situ (CIS) cases were excluded, as were cases with insufficient tissue. Clinical and pathological information is summarized in supplementary material, Tables S1 and S2. Subtype stability was assessed in a subset of metachronous samples from 49 patients (supplementary material, Table S3). In the absence of tumor location data for these metachronous samples, any NMIBC recurrence was considered regardless of anatomic location.
Clinical definitionsProgression-free survival (PFS) was defined as time from NMIBC transurethral resection (TURBT) to confirmation of muscle-invasive or metastatic disease. Recurrence-free survival (RFS) was defined as time from TURBT to the next malignant TURBT diagnosis. Operative notes were reviewed to exclude re-resections as recurrences. Adequate BCG treatment was defined as receipt of at least five induction BCG instillations in a previously BCG-naïve patient.
ImmunohistochemistrySix tissue microarray (TMA) blocks were prepared from formalin-fixed paraffin-embedded TURBTs, of which 81% were sampled with two 1.0 mm cores, and the remainder with a single core. IHC assays were performed on a Bond III Autostainer (Leica Biosystems, Concord, Canada) using monoclonal antibodies listed in supplementary material, Table S4.
IHC analysisBased on intensity (p16, GATA3) or localization (KRT5) of staining, tumor cell IHC scores were calculated as described previously [26, 28]. Percent IHC-positive cells per core were quantified in deciles (0.1–0.9) using HALO software v1.94 (Indica Labs, Inc., Albuquerque, NM, USA) (supplementary material, Figure S1). Intensity was visually scored from 0 to 3. GATA3 was assessed as binary scores of 0 (no staining) or 1 (positive). As described [28], KRT5 was evaluated visually by proximity to the basal cell layer: 0, no staining; 1, staining confined to the basal cell layer; 2, mostly basal with some suprabasal staining; and 3, homogenous staining. In brief, tumor cell scores ranging from 0 to 1 were calculated as the product of the intensity or proximity score with the percentage score divided by the maximum score. Tumor cell scores for a given case were equal to the mean score of all cores. Detailed scoring methods are provided in supplementary material, Table S5.
Clustering and statistical analysesAll analyses were conducted using R version 3.5.3. Unsupervised hierarchical clustering was conducted using divisive methods and Euclidean distance measures with the base stats and cluster packages. Heatmaps were generated using gplots and RColorBrewer. Kaplan–Meier curves and Cox proportional hazards models were calculated using log-rank statistics in the survminer and survival R packages. Forest plots were generated using ggplots. Follow-up time for Kaplan–Meier curves ended when 10% of patients remained in each group [30]. Categorical clinical and pathological variables were tested using chi-square tests or Fisher's exact test. Numerical pairwise or ANOVA testing was conducted using Mann–Whitney U or Kruskal–Wallis tests, respectively. Two-sided P values of less than 0.05 were considered statistically significant.
Results Overview of the three-antibody algorithmThe three-antibody algorithm (Figure 1A) is a two-step process that identifies four subtypes of NMIBC. The first division uses GATA3 to separate basal (GATA3−) and luminal (GATA3+) subtypes as the ‘top-level’ of classification universal to current bladder cancer subtyping schemes [4-8, 15, 16]. The basal subtype is verified with positive KRT5 staining. Division of the luminal subtypes uses KRT5, which is positive in the URO-KRT5+ subtype, as well as p16, which is negative in the URO subtype and positive in the GU subtype.

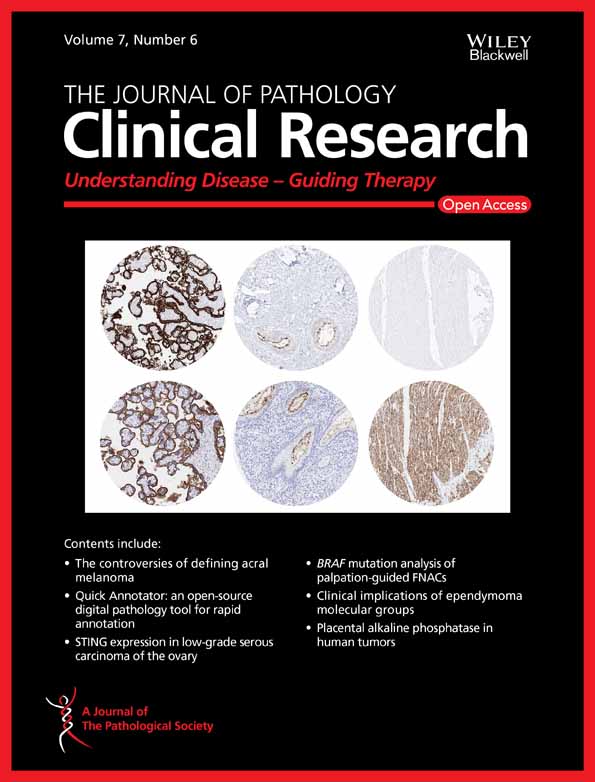
Subtyping algorithm and associations with stage and grade (A). Immunohistochemical algorithm for subtyping NMIBC samples. (i) GATA3 expression yields two categories (basal and luminal). (ii) Subtype is determined by KRT5 and p16 staining. KRT5-positive staining classifies basal and URO (KRT5+) subtypes, whereas KRT5-negative staining classifies the URO and GU subtypes. p16 staining defines the URO and GU subtypes based on negative and positive expression, respectively. (B) Representative IHC staining of NMIBC tumors using GATA3, KRT5, and p16 IHC. Images represent 0.5 mm from each 1.0 mm core. URO cases are strongly positive for GATA3 but negative for p16 expression, with KRT5 expression limited to the basal cell layer. GU cases are strongly positive for GATA3 and p16 expression and negative for KRT5 expression. URO (KRT5+) cases are strongly positive for GATA3 and KRT5 expression and negative for p16 expression. Basal cases are negative for GATA3 expression and highly positive for KRT5, with weak p16 expression. (C) Unsupervised hierarchical clustering of IHC scores identifies NMIBC subtypes from 481 tumor samples (left). Ordered heatmap (right) demonstrates stage and grade distributions across NMIBC subtypes. Stages are represented as: stage Ta, low-grade samples (light green); stage Ta, high-grade samples (green); and stage T1, high-grade samples (purple). Basal tumors were classified as GATA3−, KRT5+. GU tumors were classified as GATA3+, KRT5−, p16+. URO subtype was classified as GATA3+, KRT5−, p16 weak or negative. Red represents high IHC tumor cell scores (high protein expression) and blue represents low IHC tumor cell scores (low protein expression). (D) Proportions of samples belonging to specific stages and grades, separated by subtype.
IHC staining patterns GATA3GATA3 is a transcriptional activator of luminal differentiation in urothelium and, along with additional transcription factors, can control the expression of luminal keratins [18]. Multiple studies have demonstrated that GATA3 can accurately classify luminal subtypes using IHC [9, 27]. GATA3 positivity was defined as necessary and sufficient to identify luminal cancers (Figure 1A). Homogenous strong nuclear GATA3 staining was found in 97% (n = 467) of NMIBC cancers [15, 28, 31] (Figure 1A, B). Only 3% (n = 16) were GATA3 negative and therefore defined as basal (see below).
KRT5Using immunohistochemical detection of KRT5, we identified three patterns of basal cell differentiation. Basal tumors (n = 16, 3%) (Figure 1B) showed diffuse intense cytoplasmic staining in tumor cells (tumor cell score > 0.83) and were negative for GATA3 [15, 31]. As expected for the URO subtype [28], we observed stratified expression of KRT5 and KRT5 staining confined to the basal cell layer (n = 220, 46%). Surprisingly, a separate subset of GATA3-positive tumors (n = 108, 23%) showed strong expression of KRT5 in an expanded suprabasal pattern (Figure 1B). As these were luminal tumors as defined by GATA3 expression, we called this novel subtype URO-KRT5+. GU tumors (n = 137, 28%) were defined by intact p16 (see below) and demonstrated limited expression of KRT5.
p16 (CDKN2A)Deletions of CDKN2A are frequent events in the URO subtype resulting in a lack of p16 protein expression [15, 31]. Conversely, p16 overexpression is characteristic of the GU subtype [15, 31]. We observed a range of intensities of p16 expression, with moderate and high expression belonging to the GU subtype (Figure 1B,C).
ClusteringUnsupervised hierarchical clustering of the IHC tumor cell scores identified four key clusters (Figure 1C) corresponding with the three previously identified subtypes [15, 26, 28, 31]: basal (GATA3−, KRT5+), genomically unstable (GATA3+, p16+, KRT5−), urothelial-like (GATA3+, p16−, KRT5−), and the previously undescribed KRT5 positive urothelial-like (GATA3+, KRT5+) subtype. For samples with two cores available for analysis, 86% demonstrated subtype agreement between the two cores.
Subtype switching across recurrencesA clinically useful subtyping scheme should be relatively stable across metachronous tumors. Using IHC, we classified multiple NMIBC recurrences in 49 patients (Figure 2 and supplementary material, Table S3). The majority were initially URO (n = 30), followed by GU (n = 13), URO-KRT5+ (n = 3), and basal (n = 3). For most patients, recurrent tumors retained the same subtype as the initial tumor (n = 33/49, 67%). Similar to previous observations [31], BCG treatment had no discernible effect on subtype. The relative stability of subtypes across recurrent tumors indicates that this three-antibody algorithm can provide clinically useful information at the time of diagnosis.

Recurrences across multiple patients (n = 49), with respect to molecular subtypes. Individual patients are represented by a single row, and each recurrence is represented by a colored bar which all occur within a 5-year period. Majority of recurrences occurred within 1 year. Colors are representative of subtype: URO (blue), GU (purple), URO-KRT5+ (turquoise), basal (red). Patients not treated with BCG are indicated by a green X. BCG treatment occurring between recurrences is categorized as induction (green square) or induction plus maintenance (green triangle).
Significant associations between subtype and clinical/pathological variables Stage and gradeThe basal subtype was dramatically enriched for high grade and stage, with 100% of tumors presenting as high grade, AUA high risk and over 80% of the subtype represented by invasive (stage pT1) tumors (Table 1, Figure 1D). Accordingly, the basal subtype showed a relative risk (RR) of 3.25 and an odds ratio (OR) of 13 for stage T1 disease (Table 1). Conversely, 66% of the URO-KRT5+ subtype was pTa, low grade, and associated with low AUA risk scores, resulting in an RR and OR for low grade of 1.93 and 3.7, respectively (Table 1). Only 26 and 8% of the URO-KRT5+ subtype were pTa high grade or pT1 high grade, respectively (Table 1, Figure 1D). In contrast, both the URO and GU subtypes showed relatively balanced frequencies across NMIBC grades and stages and across AUA risk scores (Table 1, Figure 1D). The basal and GU subtypes were significantly associated with concomitant CIS (p < 0.0001). In contrast, only 4% of URO-KRT5+ cases presented with concomitant CIS (Table 1). Based on clinical and pathological features alone, basal tumors were most frequently associated with high-risk features, followed by URO and GU, and finally, URO-KRT5+ which was associated with lower-risk features.
Table 1. Clinical and histopathological characteristics of samples stratified by subtype. URO (n = 220) (%) GU (n = 137) (%) URO KRT5+ (n = 108) (%) Basal (n = 16) (%) P value Stage and grade Ta, low grade 75 (34) 37 (27) 71 (66) 0 (0) <0.0001 Ta, high grade 90 (41) 56 (41) 28 (26) 3 (19) T1, high grade 55 (25) 44 (32) 9 (8) 13 (81) Sex Male 182 108 86 10 0.24 Female 38 29 22 6 CIS Yes 25 (11) 32 (23) 4 (4) 5 (31) <0.0001 No 195 (89) 105 (76) 104 (96) 11 (69) Variant histology Squamous 8 4 3 7 0.085 Glandular 0 3 0 0 Micropapillary 1 2 0 0 AUA risk score Low 46 (21) 28 (20.4) 39 (36) 0 (0) <0.0001 Intermediate 42 (19) 28 (20.4) 36 (33) 0 (0) High 132 (60) 81 (59.2) 33 (31) 16 (100) Time to recurrence post-BCG Early (<1 year) 18 7 4 0 0.21 Late (1–2 years) 4 2 1 1 No recurrence within 2 years 36 41 16 5 Median RFS Days (months) 349 (11.5) 515 (16.9) 1176 (38.7) 276 (9.1) 0.039* Median PFS Days (months) NA 3802 (124.9) 4010 (131.8) 1077 (35.4) <0.00011* OR for stage/grade relative to URO [95% CI] Low grade Reference NA 3.7 [2.28–6.02] 0 NA High grade 0.27 [0.17–0.44] Infinite pTa 3.67 [1.74–7.74] 0.08 [0.02–0.28] pT1 0.27 [0.13–0.58] 13 [3.6–47.3]RR for stage and grade relative to URO [95% CI]
Low grade Reference NA 1.93 [1.53–2.42] 0 NA High grade 0.52 [0.39–0.69] 1.51 [1.38–1.67] pTa 1.22 [1.11–1.34) 0.25 [0.09–0.7] pT1 0.33 [0.17–0.65] 3.25 [2.34–4.5] NA, not applicable. * Log-rank test. Recurrence-free survivalAs high-grade tumors present the highest risk for progression or recurrence events, we restricted further analyses to high-grade samples. We observed significant associations between subtype and RFS (Figure 3A, p = 0.039). The basal subtype recurred the fastest, with a median RFS of 9.1 months (Table 1). The URO and GU subtypes followed, with a median RFS of 11.5 and 16.9 months, respectively. The URO-KRT5+ subtype was the slowest to recur with a median RFS of 38.7 months, triple the RFS time of its URO counterpart (p = 0.011). We observed significant decreases in overall RFS between TaHG and T1HG tumors and conducted separate analyses for these tumor stages (Figure 3 and supplementary material, Figure S2). Stratification by stage and grade showed no overall significant differences between subtype and RFS for TaHG and T1HG tumors in Kaplan–Meier analysis (Figure 3C,E). However, due to the stage and grade distribution of basal and URO-KRT5+ subtypes, there were limited basal TaHG and URO-KRT5+ T1HG samples for analysis. Importantly, in pairwise and Kaplan–Meier analyses between the URO and URO-KRT5+ subtype for TaHG tumors, we consistently observed that the URO-KRT5+ subtype recurred significantly more slowly with a median RFS of 16.4 and 38.7 months, respectively (Figure 3C and supplementary material, Figure S2B,C, p = 0.047 and 0.046).

Prognostic associations of molecular subtypes in high-grade NMIBC. RFS (A) and PFS (B) of high-grade NMIBC patients, stratified by subtype. RFS (C) and PFS (D) of NMIBC patients with TaHG diagnoses, stratified by subtype. RFS (E) and PFS (F) of NMIBC patients with T1HG diagnoses, stratified by subtype. Progression is defined as progression to muscle invasion (greater than stage pT2). Colors represent subtype: URO (blue), GU (purple), URO-KRT5+ (turquoise), and basal (red). P values listed according to log-rank test.
Progression to muscle invasionThe basal subtype was significantly associated with more rapid progression to muscle invasion with a median PFS of 35.4 months (p = 0.00011) (Figure 3B, Table 1). High-grade cases subtyped as URO-KRT5+ and GU had a median PFS of 131.8 and 124.9 months, respectively (Figure 3B, Table 1). For the URO group, PFS was 79% at 7 years (Figure 3B). When all high-grade cases were stratified by stage, there were no overall significant differences in PFS between subtypes for stage Ta tumors (Figure 3D). When stratified for stage pT1 tumors, URO and GU tumors demonstrated similar PFS (Figure 3F). However, stage pT1 high-grade basal tumors showed the highest risk for progression to muscle invasion (Figure 3F, p = 0.0013). Subsequent multivariable analysis with AUA risk score and subtype indicated the basal subtype as a significant predictor for risk of progression (Figure 4).

Forest plot for multivariable Cox regression analysis for PFS in high-grade NMIBC tumors. P values listed according to log-rank test, where * denotes p < 0.05.
Prognostic associations of URO and GU subtypesContrary to the findings in MIBC [12, 25], we observed that the GU subtype was associated with improved prognosis compared to URO. GU tumors exhibited a 5.5-month improvement in RFS compared to URO (median RFS = 16.9 and 11.5, respectively) (Figure 3A). These RFS differences may reflect p16 status (Figure 1C), where URO tumors were defined by low p16 staining levels (<0.40), and GU tumor defined by intermediate and high p16 staining (>0.40). Indeed, tumors with low p16 recurred the fastest (median RFS = 13.5 months), and tumors with intermediate and high p16 expression (>0.40) recurred more slowly with a median RFS of 22.8 and 67.7 months, respectively (supplementary material, Figure S3).
As previous work in higher-stage tumors reported that GU tumors were more likely than URO to progress [13], we confirmed GU subtyping using IHC assays for p63, which should be negative in approximately two-thirds of GU tumors [28, 32] (supplementary material, Figure S4).
BCG response and subtypeWe explored whether subtypes were associated with response to BCG. Both the URO and GU subtypes appeared to derive benefit from BCG, with fewer high-grade recurrences after BCG treatment (Figure 5A, p < 0.0001). However, the GU subtype achieved the greatest RFS after adequate induction of BCG, experiencing fewer high-grade recurrences than its URO counterpart (p = 0.033). As the URO-KRT5+ subtype was significantly enriched for low-grade tumors, many of these patients did not receive BCG, resulting in too few patients for analysis. Similarly, only six patients of the basal subtype received BCG and were excluded from the analysis. When categorized for time to recurrence, the GU subtype had significantly fewer high-grade recurrences within 1 year post-BCG and a greater proportion of patients with no recurrences within 2 years when compared to its URO counterpart (Figure 5B, p = 0.049).

Subtype associations with BCG outcomes. (A) High-grade RFS (HG-RFS) for patients treated with adequate induction BCG versus untreated patients, stratified by subtype (URO versus GU). Colors represent patient treatment and subtype: treated URO (blue), untreated URO (magenta), treated GU (purple), and untreated GU (pink). P values are listed according to log-rank test. Individual P values are listed for comparison of URO- and GU-treated (p = 0.033) and -untreated (p = 0.17) patients, whereas comparison of all four groups demonstrated p < 0.0001. (B) BCG response with respect to subtype, observing the time to recurrence post-BCG for URO and GU subtypes. P value is listed according to chi-square test.
DiscussionThis study describes a simple three-antibody immunohistochemical algorithm that classifies NMIBC into four distinct subtypes. With a large body of evidence and investment in MIBC subtyping schemes, this study demonstrates a tractable way of validating these established classification schemes within the context of NMIBC. IHC-based subtyping provides an important complement to RNA-based approaches, which cannot feasibly be performed in every sample in a clinical laboratory. The antibodies used in this algorithm are routinely employed in surgical pathology [33-36], and scoring can be performed digitally or visually [26] by qualitative assessment. The algorithm can therefore be readily implemented into the pathology workflow.
The validity of the four subtypes we observed is supported by unsupervised hierarchical clustering, which revealed three established clusters of NMIBC tumors (basal, URO, and GU) at expected frequencies, along with a novel cluster, URO-KRT5+ [15, 26, 28, 31] (Figure 1C). Importantly, significant associations with progression and recurrence (Table 1, Figure 3A,B) indicate that identifying these subtypes can potentially provide important predictive and prognostic information and help guide clinical management if implemented into the pathology practice.
The novel URO-KRT5+ subtype, constituting over 20% of NMIBC tumors, was enriched for low-risk, low-grade tumors that recur slower than any of the other subtypes. We also note that URO-KRT5+ cases do not correspond to the RNA-based subtype ‘UroB’, which occurs in more advanced stages and has increased basal marker expression and a poor outcome [15, 28]. Instead, URO-KRT5+ most likely corresponds to UroA tumors, a luminal subtype (thus the URO designation) with expanded expression of KRT5. Recent work by Lindskrog et al transcriptomically characterized NMIBC and detected four mRNA classes [37]. Interestingly, class 3 tumors demonstrated positive immunohistochemical staining for GATA3 and KRT5, further supporting the presence of a luminal KRT5+ subtype [37]. Further characterization of URO-KRT5+ tumors will be needed to determine whether they differ from their URO counterparts with regard to expression of other differentiation markers or genomic alterations. The URO-KRT5+ subtype may represent a group of patients that requires less intense surveillance. If confirmed, identifying these tumors using this three-antibody algorithm could reduce the economic burden, discomfort, and inconvenience of repeated cystoscopies.
In muscle-invasive disease, the basal/SCCL subtype represents more aggressive, higher stage cancers [6, 8, 9, 12, 15,
留言 (0)