
記住我
Although mainly preventable, dental caries are the most common chronic disease worldwide and pose public health challenges at the population level.1,2 Fluoride has been well established as an effective measure to prevent dental caries, and community water fluoridation (CWF) is considered to be the most cost-effective population-wide preventive measure.3 Fluoride has both pre- and post-eruptive effects. The pre-eruptive effect refers to integration of the fluoride ion into the enamel structure during tooth development, as it changes hydroxyapatite into fluorapatite.4 The post-eruptive effect refers to remineralization and inhibition of demineralization of tooth enamel in early childhood caries.5
Fluoride is a natural mineral found throughout the earth’s crust and is widely distributed in nature. Although fluoride is naturally present in water, its concentration is not always ideal for preventing dental caries. CWF is the adjustment of fluoride concentration in public water supplies up to the recommended level to prevent dental caries.6 CWF has been identified by the United States’ Centers for Disease Control and Prevention as, “One of the ten greatest public health achievements of the 20th century.”7,8 In Canada, the practice of CWF started in 1945, in Brantford, Ontario.7,9 Scientific research has observed that populations living in communities with fluoridated public water supplies have 20–40% fewer dental caries than populations living in communities that do not adjust fluoride concentration in their water.10,11 The Guidelines for Canadian drinking water quality12 have established a maximum acceptable fluoride concentration of 1.5 mg/L. Water containing fluoride at or below this concentration does not pose risks to human health. However, Health Canada recommends a fluoride concentration in public water supplies of 0.7 mg/L (or 0.7 ppm), which is considered the optimal concentration for preventing dental caries.7,13 This is based on consideration of various sources of fluoride intake, such as toothpaste, drinkable liquid and food prepared with fluoridated water. According to the American Dental Association, 25% of dental caries can be prevented in children and adults who drink water with an optimal concentration of fluoride, an argument supported by 70 years of research.14
Through the topical and systemic effects of ingested fluoride, children < 8 years old greatly benefit from water fluoridation during tooth development, although all ages benefit from fluoridation related to post-eruption effects.1,2 Topically, tooth enamel is strengthened and forming teeth incorporate fluoride, which leads to caries prevention in adulthood. In the delivery of CWF, the concentration of fluoride in drinking water is the most important factor in its effectiveness. Although CWF is delivered through water treatment facilities (WTFs) and public water systems, limited research has been done on tap water as the fluoride concentration’s endpoint. Therefore, this investigation aimed to determine whether fluoride concentration in tap water at daycare facilities across the province of Alberta, Canada, remains the same as at the WTF.
Materials and MethodsThis research was part of a larger project aimed at measuring the lead concentration in public drinking water. During the first of 3 rounds of water collection at daycares, 1 sample was also tested for fluoride, as the volume was sufficient to support both analyses. The Ministry of Children’s Services provided a comprehensive list of 400 eligible licensed daycares in Alberta. We calculated a target sample size of 140 daycares based on a 95% confidence interval and a 6.7% margin of error. Samples were stratified according to daycare location using Alberta Health Services (AHS) zones: North, Edmonton, Central, Calgary and South.
The daycares were further assessed using a pre-screening survey developed to help select facilities with a variety of possible risk factors related to lead in drinking water. The final selection was approved by the AHS Environmental Public Health zone directors. The management of each selected daycare was informed of its inclusion in the research project, and information about the research project was provided to the parents/caregivers of the children attending the daycares.
From September to December 2017, water samples were collected by environmental public health practicum students using a random daytime sampling protocol. Samples were collected only from taps and fountains that were frequently used for drinking. Water was collected as a single 250-mL sample in 500-mL chemical analysis bottles supplied by the Alberta Centre for Toxicology (ACFT). All water samples were sent to and received by the ACFT for analysis within 7 days of collection. The ACFT used ion chromatography to determine water fluoride concentrations.
All data handling and evaluation occurred electronically using a password-protected computer on a secure network. Descriptive statistics for the water samples, daycare facilities and WTFs were used to analyze the data and compare means. The sample is independent, and the assumptions were met, allowing for 1-sample t test analysis at a 95% confidence interval. Data analyses were carried out using SPSS (v. 25, SPSS Inc., Chicago, IL, USA). We used the Kolmogorov-Smirnov test to verify assumptions of normality, equal variances and independence. A parametric or non-parametric test was then chosen to analyze the data, based on the Kolmogorov-Smirnov test results.
ResultsWater samples for fluoride concentration analysis were collected from 141 randomly selected daycares across Alberta, located in 35 municipalities, some with fluoridation of the public water supply and others without or unknown (Table 1). Most samples were collected from a kitchen faucet and, in a few cases, from faucets located in classrooms and water fountains. One of the daycares selected for this investigation uses water from a private well (groundwater source) and another uses hauled water (supplier unknown).
Table 1: Minimum and maximum fluoride concentrations in water at Alberta daycare facilities.Minimum and maximum fluoride concentrations in water at Alberta daycare facilities.
No. municipalities
No. daycares
Fluoride concentration, mg/L
Average
Minimum
Maximum
*Private well or hauled water.
†Not detectable (≤ 0.1mg/L).
The daycares with adjusted fluoride concentrations in their public water supply (n = 72) were located in 19 municipalities. In these municipalities, water is supplied by 8 Alberta Environment & Parks (AEP) regulated public water system providers (Table 2). Each municipality is supplied by only 1 AEP regulated water utility. The fluoride concentration of water samples collected in daycares ranged from 0.58 mg/L to a maximum of 0.78 mg/L (mean 0.68 ± 0.50 mL).
Table 2: Fluoride concentration in water samples from water treatment facilities and the Alberta daycares they serve.Water treatment facility
Fluoride concentration at facility,* mg/L
No. daycares served
Fluoride concentration at daycares, mg/L
Difference in fluoride concentration, mg/L
*Source: Lok, Dorothy, Municipal Approvals Engineer, Alberta Environment and Parks
A 0.81 1 0.76 −0.05 B 0.68 35 0.64–0.71 −0.04 to 0.03 C 0.67 12 0.60–0.66 −0.01 to −0.07 D 0.76 2 0.73–0.77 −0.03 to 0.01 E 0.75 2 0.60–0.61 −0.14 to −0.15 F 0.80 5 0.68–0.75 −0.05 to −0.12 G 0.80 14 0.58–0.78 −0.01 to −0.22 H 0.82 1 0.63 −0.19The difference in fluoride concentration between WTFs and daycare water samples ranged from −0.22 to 0.03 mg/L (Table 2), i.e., fluoride concentration at the endpoint increased a maximum of 0.03 mg/L and decreased a maximum of 0.22 mg/L. At 4 daycares (5.6%), fluoride concentration in water samples did not differ from that at WTF-B, which supplied their water. At 10 daycares (13.9%), fluoride concentration in water samples was higher than that of their WTF (range 0.01–0.03 mg/L); 9 were supplied by WTF-B and 1 by WTF-D. At the remaining 58 daycares (80.5%), fluoride concentrations were lower than at the WTF (range −0.01 to −0.22 mg/L). Water at 2 daycares supplied by WTF-G had the largest decrease in fluoride concentration (−0.22 mg/L) between facility and endpoint. WTF-H was associated with the second greatest difference in fluoride concentration with a decrease of 0.19 mg/L in 1 daycare’s water sample. Figure 1 illustrates the variation in fluoride concentration between water providers and the daycares they serve.
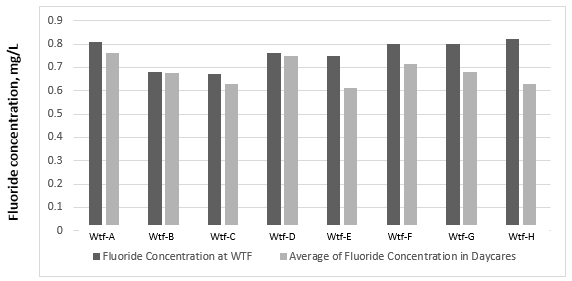
Figure 1: Average fluoride concentration in water at water treatment facilities (WTFs) and the daycares they serve in Alberta.
The data showed a normal distribution when analyzed using the Kolmogorov-Smirnov test (p = 0.11). Because the assumptions of normality, equal variances and independence were met, a parametric test was used to analyze the data. Fluoride concentration in water at each daycare was compared with the fluoride concentration at the WTF providing the water. However, this analysis requires at least 5 observations; thus, only WTF-B (35 daycares), WTF-G (14 daycares), WTF-F (5 daycares) and WTF-C (12 daycares) met this criterion. Based on these 66 observations, we identified significant differences between the concentrations of fluoride at the WTF and in water samples at the daycares they serve (Table 3). The overall results show a mean fluoride concentration at the endpoints of 0.76 ± 0.06 mg/L (p = 0.02) and a mean difference of −0.06 (95% CI −0.01, −0.11).
Table 3: Significance of changes in fluoride concentration between water treatment facilities and water at Alberta daycares.WTF
Mean fluoride concentration at daycares, mg/L ± SD
p
Mean difference, mg/L
95% CI, mg/L
Note: CI = confidence interval, SD = standard deviation, WTF = water treatment facility.
WTF-B 0.67 ± 0.02 0.006 −0.01 −0.02 −0.01 WTF-G 0.71 ± 0.68 < 0.001 −0.09 −0.13 −0.05 WTF-F 0.72 ± 0.03 0.004 −0.08 −0.11 −0.04 WTF-C 0.62 ± 0.02 < 0.001 −0.04 −0.06 −0.03 Overall 0.76 ± 0.06 0.021 −0.06 −0.11 −0.01 DiscussionTo our knowledge, this is the first study looking at differences in fluoride concentration between WTFs and endpoints. It shows that the public health measure to prevent dental caries provided by CWF accomplishes its objective: to deliver fluoride at the recommended concentration. The 2010 Guidelines for Canadian drinking water quality12 recommend 0.7 mg/L as the optimal target concentration of fluoride in public drinking water. This concentration, established by Health Canada, is based on daily intake of fluoride from various sources, such as drinking water, food, beverages and toothpaste. It provides desirable dental health benefits and is well below the maximum acceptable concentration (1.5 mg/L), and does not pose a risk to human health.
In Canada, although the federal, provincial and territorial governments establish guidelines, the decision to adjust fluoride levels in public water supplies is made by municipalities. High concentrations of naturally occurring fluoride in drinking water sources are relatively infrequent in Canada, which helps to justify the recommendations for adjustment of fluoride concentration in public water supplies for dental caries prevention.12,15 The specific types of chemicals used to adjust the fluoride concentration at a WTF vary, but they are all certified by the National Sanitation Foundation for drinking water treatment (NSF/ANSI standard 60). Examples include fluorosilicic, hydrofluorosilicic and hydrofluosilicic acids. These additives are used to adjust fluoride levels in drinking water to 0.8 ± 0.2 mg/L.
In this project, 67 samples were taken from daycares that were not supplied with water adjusted for fluoride. For these facilities, the average concentration of fluoride observed at the endpoint was 0.17 mg/L, with the highest level 0.41 mg/L. These results support the above statement that naturally occurring fluoride in drinking water supplies is below the recommended 0.70 mg/L guideline for dental health.
Although the recommended concentration of fluoride in public drinking water to prevent dental caries is 0.70 mg/L,6,12,16 a variation of ± 0.2 mg/L will not affect the rate of caries prevention.17 Our results showed fluoride concentrations of 0.58–0.78 mg/L (n = 72), a range that is statistically but not clinically significant. This study shows that, in Alberta, communities adjusting the fluoride concentration in their public water supplies are achieving their goal. The fluoride concentration at the endpoint (daycares) is within the range recommended for caries prevention. Hence, CWF is an effective public health measure to reduce the prevalence of dental caries. Our findings support CWF as a population preventive measure, certifying that fluoride’s adjusted concentration leads to the optimal level to prevent dental caries.
One considerable limitation of this project is the fluoride concentration at the WTF. Although the information provided by the WTF is reliable, the test for fluoride concentration was not performed by the same laboratory and the analytical methods may not have been the same as those used to test water from the daycares (e.g., ion chromatography). However, WTFs use an accredited laboratory and standard methods to assess fluoride concentration. We used average concentration at the WTF versus a 1-time grab sample at the daycare facilities. These differences could explain some of the variations in fluoride levels between WTF and daycare. For instance, 10 observations showed a small increase, ranging from 0.01 to 0.03 mg/L, in fluoride concentration at the endpoint compared with that at the WTF, which is difficult to account for. In addition, the sampling could be considered a limitation. It would have been interesting to include more samples from daycares that were supplied by WTF-G and WTF-H, as these were associated with the most considerable changes. Not all AEP-regulated systems that fluoridate were tested. This would have given a much better picture.
ConclusionThis study confirms that fluoride adjusted concentration at the WTFs in Alberta is maintained at the endpoints (daycares) at the approximate optimal fluoride concentration of 0.7 mg/L with a variation of concentration ranging from 0.58 to 0.78 mg/L.
THE AUTHORS

Dr. Gianoni-Capenakas is PhD/resident in orthodontics, School of Dentistry, University of Alberta; Edmonton, Alberta.

Ms. Popadynetz is public health inspector, Healthy Physical Environments, Provincial Strategies & Projects, Alberta Health Services, Edmonton, Alberta.

Mr. Younger is executive officer/public health inspector III, provincial drinking water coordinator, Healthy Physical Environments, Alberta Health Services, Edmonton, Alberta.

Mr. White is executive officer/disease control coordinator, Environmental Public Health, South Zone, Alberta Health Services, Edmonton, Alberta.

Ms. Hodgkinson is director, Environmental Public Health, South Zone, Safe Healthy Environments, Alberta Health Services, Edmonton, Alberta.

Dr. Patterson is associate chair (academic) and professor, School of Dentistry, Faculty of Medicine & Dentistry, University of Alberta, Edmonton, Alberta.

Dr. Pacheco-Pereira is clinical assistant professor in Radiology, School of Dentistry, University of Alberta, Edmonton, Alberta.

Dr. Figueiredo is provincial dental public health officer, provincial population and public health, Alberta Health Services and University of Alberta, Edmonton, Alberta.
Corresponding author: Dr. Silvia Gianoni-Capenakas, School of Dentistry, University of Alberta, 5th Floor, ECHA 5-488, 11405 87 Ave, Edmonton AB T6G 1C9. Email: capenaka@ualberta.ca
The authors have no declared financial interests.
This article has been peer reviewed.
References Schwendicke F, Dörfer CE, Schlattmann P, Foster Page L, Thomson WM, Paris S. Socioeconomic inequality and caries: a systematic review and meta-analysis. J Dent Res. 2015;94(1):10-8. Lambert MJ, Vanobbergen JSN, Martens LC, De Visschere LMJ. Socioeconomic inequalities in caries experience, care level and dental attendance in primary school children in Belgium: a cross-sectional survey. BMJ Open. 2017;7(7):e015042. Water fluoridation: questions and answers. Toronto: Faculty of Dentistry, University of Toronto; 2012. Available: http://www.caphd.ca/sites/default/files/WaterFluoridationQA.pdf (accessed 2020 May 30). Institute of Medicine Standing Committee on the Scientific Evaluation of Dietary Reference Intakes. Dietary reference intakes for calcium, phosphorus, magnesium, vitamin D and fluoride. Washington, DC: National Academies Press; 1997. O’Mullane DM, Baez RJ, Jones S, Lennon MA, Petersen PE, Rugg-Gunn AJ, et al. Fluoride and oral health. Community Dent Health. 2016;33(2):69-99. Fluoridation facts. Chicago: American Dental Association; 2018. Available: https://www.ada.org/en/public-programs/advocating-for-the-public/fluoride-and-fluoridation/fluoridation-facts (accessed 2020 May 29). Fluoride and oral health. Ottawa: Health Canada; 2017. Available: https://www.canada.ca/en/health-canada/services/healthy-living/your-health/environment/fluorides-human-health.html (accessed 2020 Aug. 11). Centers for Disease Control and Prevention. Ten great public health achievements -- United States, 1900–1999. MMWR Morb Mortal Wkly Rep. 1999;48(12):241-3. McLaren L. Fluoridation exposure status based on location of data collection in the Canadian Health Measures Survey: is it valid? J Can Dent Assoc. 2016;82:g17. McLaren L, McIntyre L. Drinking water fluoridation in Canada: review and synthesis of published literature. Ottawa: Public Health Agency of Canada; 2011. Available: https://www.albertahealthservices.ca/poph/hi-poph-surv-phids-drinking-water-fluoridation.pdf (accessed 2020 Oct. 16). Report on the findings of the oral health component of the Canadian Health Measures Survey 2007–2009. Ottawa: Health Canada; 2010. Available: https://publications.gc.ca/site/eng/369649/publication.html (accessed 2020 Oct. 16). Guidelines for Canadian drinking water quality. Guideline technical document: fluoride. Ottawa: Health Canada; 2010. Available: https://www.canada.ca/content/dam/canada/health-canada/migration/healthy-canadians/publications/healthy-living-vie-saine/water-fluoride-fluorure-eau/alt/water-fluoride-fluorure-eau-eng.pdf (accessed 2020 Oct. 16). U.S. Department of Health and Human Services Federal Panel on Community Water Fluoridation. U.S. Public Health Service recommendation for fluoride concentration in drinking water for the prevention of dental caries. Public Health Rep. 2015;130(4):318-31. Qian J, Susheela AK, Mudgal A, Keast G. Fluoride in water: an overview. WATERfront. 1999;13:11-3. Available: http://www.dealmortgage.net/fluoride-class-action/unicef-fluoridein-water-1999.pdf (accessed 2020 May 29). Edmunds WM, Smedley PL. Groundwater geochemistry and health: an overview. Geological Society, London, Special Publications. 1996;113:91-105. Available: https://sp.lyellcollection.org/content/113/1/91 (accessed 2020 Nov. 26). World Health Organization. New WHO report tackles fluoride in drinking-water. Water Online. 2006;24 Nov. https://www.who.int/water_sanitation_health/dwq/chemicals/fluoride.pdf Barker LK, Duchon KK, Lesaja S, Robison VA, Presson SM. Adjusted fluoride concentrations and control ranges in 34 states: 2006–2010 and 2015. J Am Water Works Assoc. 2017;109(8):13-5.
留言 (0)