
記住我
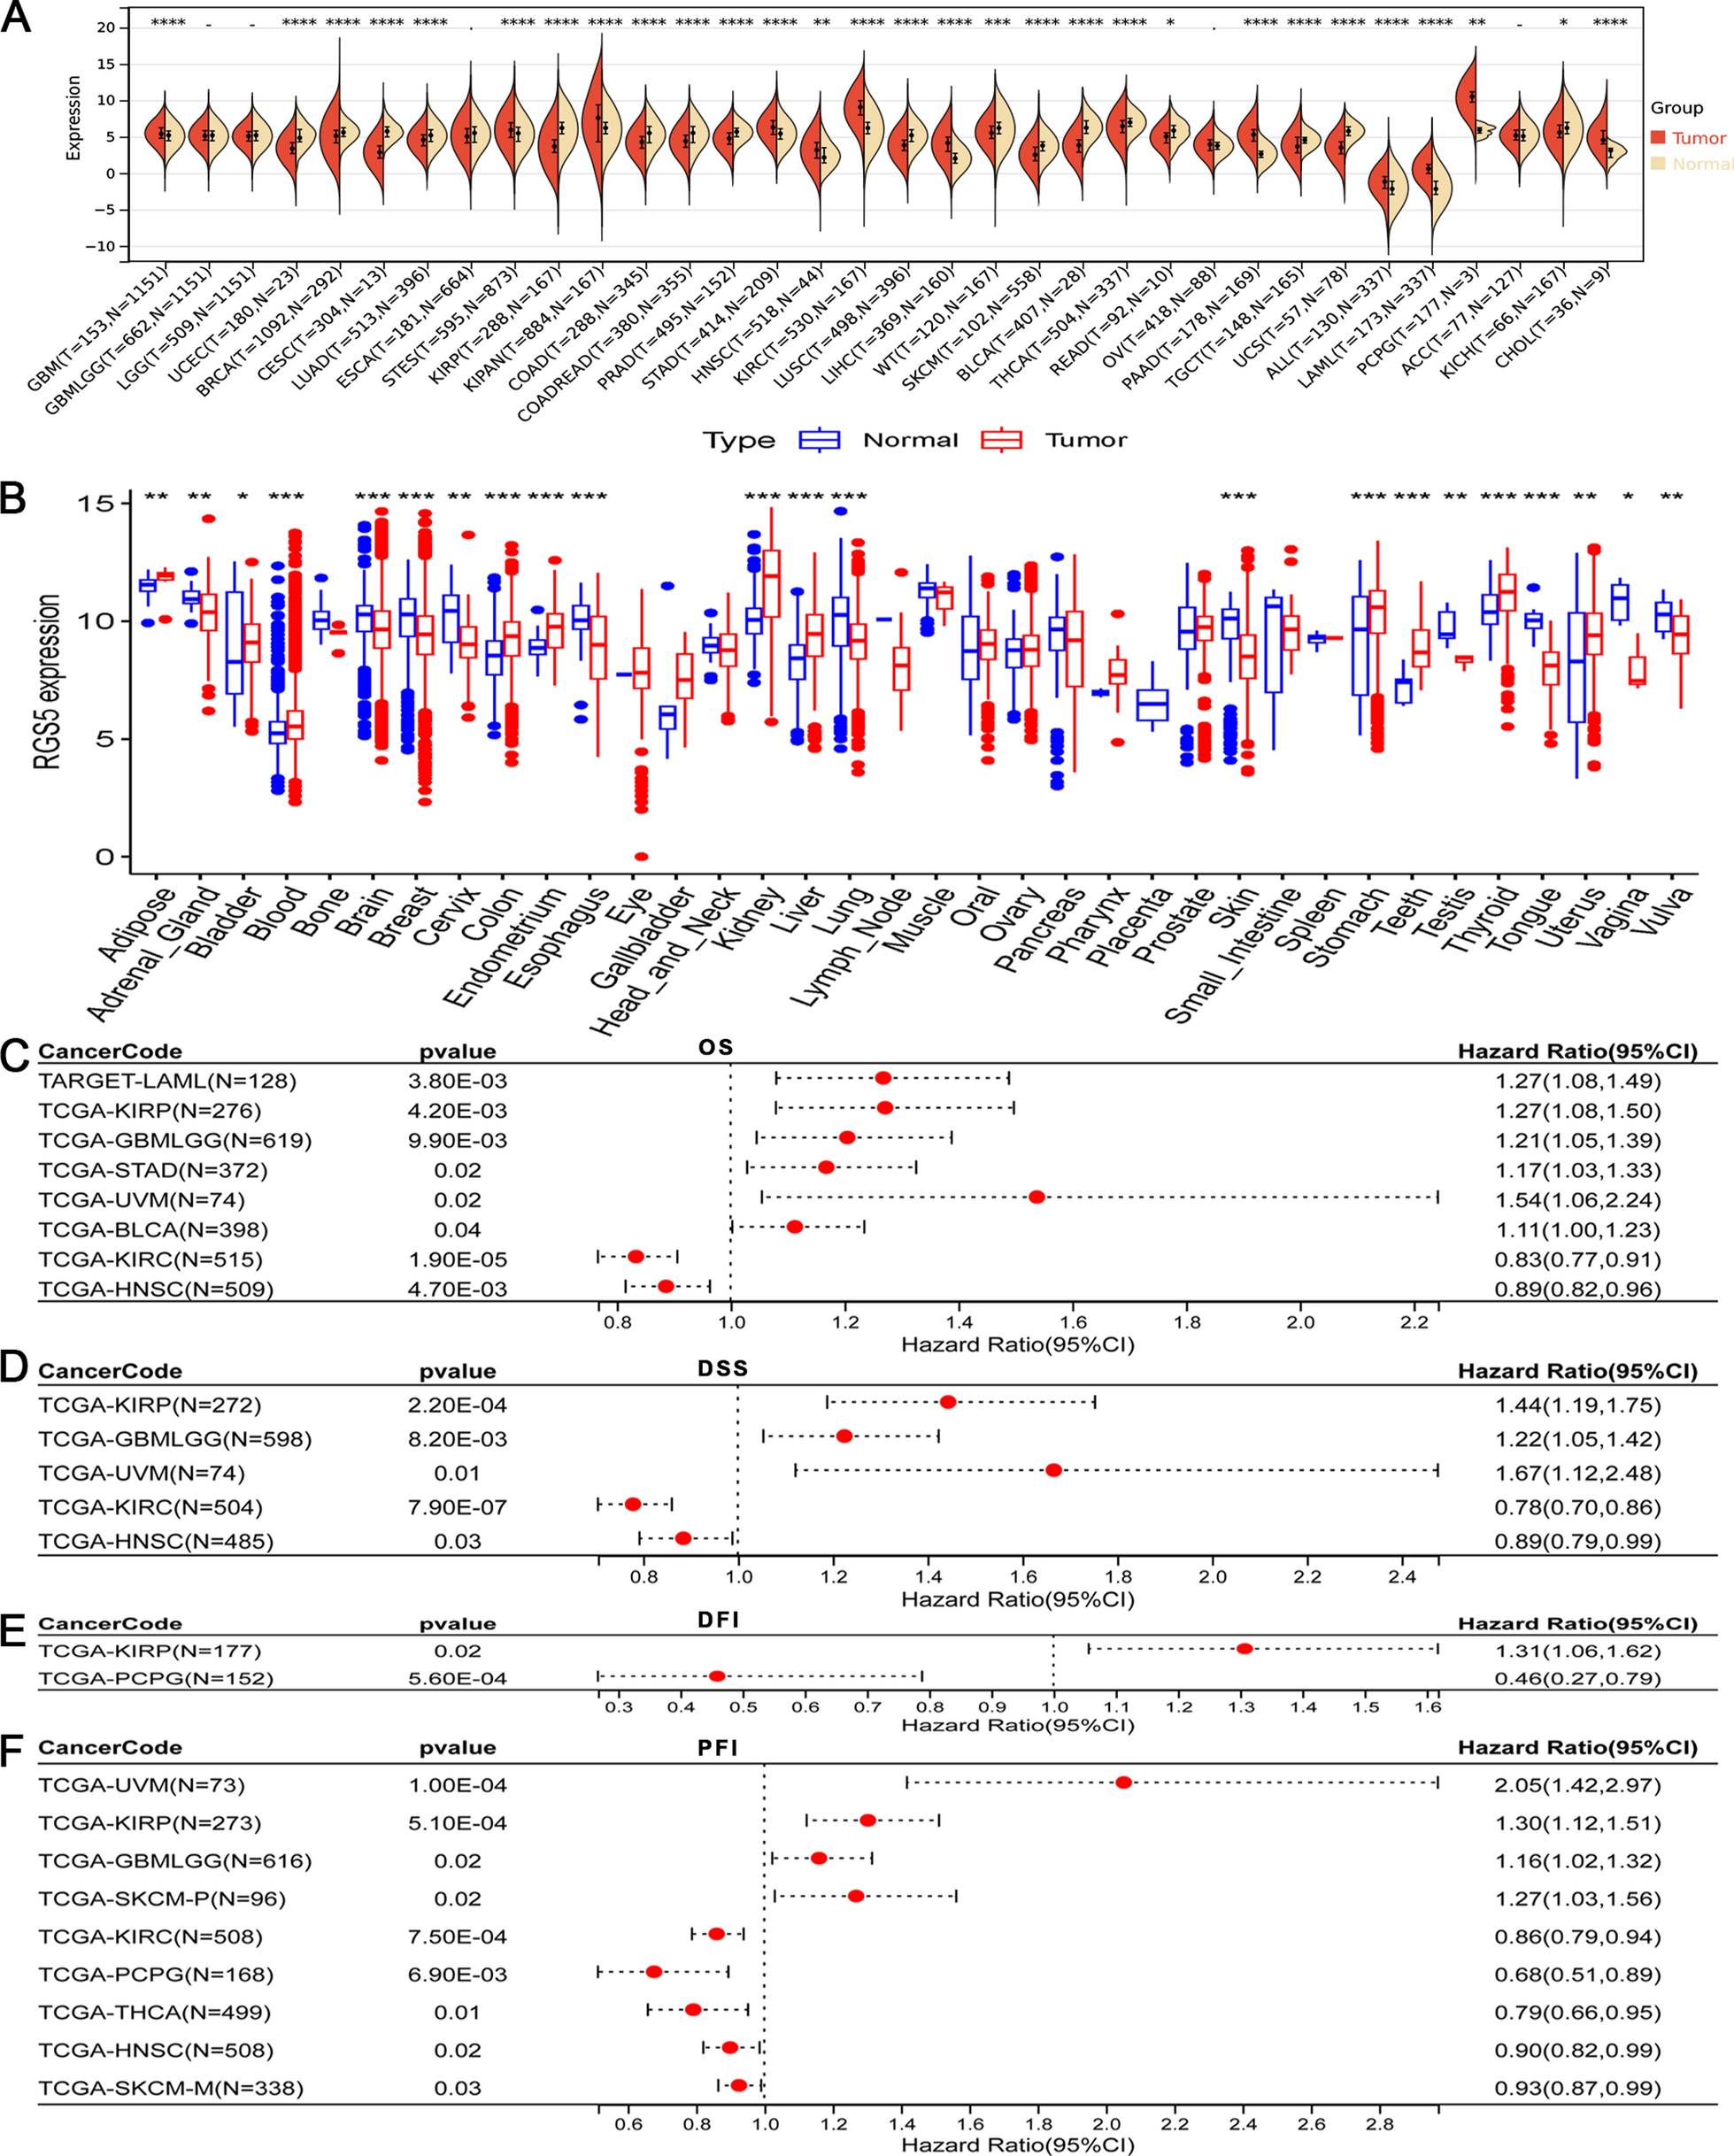


In the TCGA cohort, we found that RGS5 transcription was higher in 12 tumor types than in normal tissues (Fig. 1A). Conversely, significant downregulation was observed in 17 tumor types (Fig. 1A). Eleven tumor types in the GEO cohort had increased RGS5 transcription levels (Fig. 1B). Eleven tumor types showed reduced expression (Fig. 1B). According to OS analysis, a bad prognosis was linked to high RGS5 expression in six tumor types, whereas a better prognosis was related to it in two tumor types (Fig. 1C). In the DSS analysis, high RGS5 expression in three tumor types correlated with poor prognosis, whereas low expression in two tumor types was associated with poor prognosis (Fig. 1D). According to DFI analysis, a higher expression of RGS5 in PCPG predicted a better prognosis, but a higher expression in KIRP indicated a bad prognosis (Fig. 1E). In the PFI analysis, a poor prognosis was associated with high RGS5 expression in four tumor types, while a better prognosis was predicted by raised expression in five tumor types (Fig. 1F).
Fig. 1
RGS5 expression and prognosis analysis in human cancers. A Pan-cancer analysis of RGS5 for differential expression between tumor and normal tissues in TCGA cohort. B Pan-cancer analysis of RGS5 for differential expression between tumor and normal tissues in GEO cohort. C Pan-cancer analysis of RGS5 for overall survival (OS). D Pan-cancer analysis of RGS5 for disease-specific survival (DSS). E Pan-cancer analysis of RGS5 for disease-free interval (DFI). F Pan-cancer analysis of RGS5 for progression-free interval (PFI). *P < 0.05; **P < 0.01; ***P < 0.001; ****P < 0.0001
Association of RGS5 expression with genomic heterogeneity and tumor stemness in human cancersWe calculated the correlation between RGS5 expression levels and four genomic heterogeneity indicators as well as two tumor stemness scores. RGS5 expression was negatively correlated with TMB in six tumor types (Fig. 2A). A significant positive correlation between RGS5 expression and MSI was observed in TGCT. Conversely, negative correlations were identified in 13 tumor types (Fig. 2B). RGS5 expression showed a positive correlation with NEO in TGCT, but negative correlations in five tumor types (Fig. 2C). RGS5 expression was significantly positively correlated with tumor purity in 2 tumor types, such as THYM and TGCT, significantly negatively correlated in 18 tumor types (Fig. 2D). RGS5 expression was significantly positively correlated with DNAss in 7 tumor types and negatively correlated with (DNA methylation-based stemness) DNAss in 10 tumor types (Fig. 2E). RGS5 expression was significantly positively correlated with RNA expression-based stemness (RNAss) in LGG and negatively correlated with RNAss in 27 tumor types (Fig. 2F).
Fig. 2
The correlation analysis of tumor heterogeneity and stemness in pan-cancer. A The correlation between tumor mutation burden (TMB) and RGS5 level. B The correlation between microsatellite instability (MSI) and RGS5 level. C The correlation between neoantigen (NEO) and RGS5 level. D The correlation between tumor purity and RGS5 level. E The correlation between DNAss and RGS5 level. F The correlation between RNAss and RGS5 level
Association of RGS5 expression with clinical features in human cancersWe analyzed the relationship between RGS5 expression and clinical features across various tumor types. We observed that RGS5 expression was significantly positively correlated with age in 6 tumor types, and negatively correlated with age in 6 tumor types (Fig. 3A). In gender analysis, significant differences in RGS5 expression were observed in KIRP and KIPAN (Fig. 3B). For the M stage, RGS5 expression differed significantly in LUAD, KIPAN, KIRC, and LUSC (Fig. 3C). As regards grade, Significant differences were found in ESCA, STES, KIPAN, HNSC, and KIRC (Fig. 3D). In terms of the N stage, RGS5 expression varied significantly in STES, KIRP, THCA, BLCA, and ACC (Fig. 3E). For the T stage, RGS5 expression showed significant differences in STEC, KIRP, KIPAN, PRAD, KIRC, and THCA (Fig. 3F).
Fig. 3
The correlation analysis of clinical features in pan-cancer. A The correlation between age and RGS5 level. B The correlation between gender and RGS5 level. C The correlation between M stage and RGS5 level. D The correlation between grade and RGS5 level. E The correlation between N stage and RGS5 level. (F) The correlation between T stage and RGS5 level. *P < 0.05; **P < 0.01; ***P < 0.001; ****P < 0.0001
Association between RGS5 expression and gene variation in human cancersUsing the TCGA database, we investigated RGS5 gene variation across tumor types (Fig. 4A). According to the cBioPortal website, we found that RGS5 mutations, primarily amplification, were more common in breast cancer (Fig. 4B). The GSCALite website provided us with the methylation levels of RGS5 in several tumor kinds, and we found that 10 tumor types had variable expression, particularly kidney and lung cancer (Fig. 4C). Additionally, we investigated the frequency of SNV mutations of the RGS5 gene in 16 different forms of cancer. The highest sample mutation frequency was found in UCEC patients (Fig. 4D). Furthermore, we examined the relationship between RGS5 and pan-cancer CNVs, including none, hete.amp, homo.amp, hete.del, and hete.del. The results suggested that the CNVs mutation of RGS5 was various in each type of cancer, and the main type of CNVs was hete.amp in most cancer types (Fig. 4E).
Fig. 4
The analysis of mutation landscape in pan-cancer. A Mutation landscapes of RGS5 for pan-cancer. B Mutation frequency of RGS5 for pan-cancer. C Methylation difference of RGS5 for pan-cancer. D The SNVs mutation type of RGS5 for pan-cancer. E The CNVs mutation type of RGS5 for pan-cancer
Association between RGS5 expression with immune regulation, checkpoints, RNA modification, and drug sensitivityWe investigated the relationship between RGS5 expression and other immunoregulatory genes in various tumor types. In several tumor types, such as WT, ACC, and KIRC, RGS5 expression exhibited strong positive associations with immunoregulatory genes (Fig. 5A). Furthermore, in some tumor types, such as WT, ACC, and KIRC, RGS5 expression demonstrated strong positive relationships with immunoregulatory genes (Fig. 5B). We found that eight different types of immune infiltrating cells in various tumor types had a significant correlation with RGS5 expression. Notably, in a number of tumor forms, including KIRC, ESCA, KIPAN, and TGCT, RGS5 expression was highly connected with endothelial cells and CAF infiltration (Fig. 5C).
Fig. 5
Immunological value analysis of RGS5 for pan-cancer. A The correlation of RGS5 expression with immune regulatory genes. B The correlation of RGS5 expression with immune checkpoint genes. C The correlation of RGS5 expression with immune infiltrating cells using TIMER algorithm. *P < 0.05; **P < 0.01; ***P < 0.001; ****P < 0.0001
Our findings support the idea that RNA modification in a variety of tumor types may be influenced by RGS5 expression. In a variety of tumor types, RGS5 expression showed a favorable correlation with RNA modification genes (m1A, m5C, and m6A) (Fig. 6A). To investigate the biological role of RGS5 in various tumor types, we conducted GSVA analyses. These findings demonstrated that in several tumor species, RGS5 expression was substantially inversely connected with signaling pathways linked to the cell cycle and apoptosis (Fig. 6B). RGS5 expression was favorably connected with CTRP drug sensitivity to cancer medications such as gefitinib, bosutinib, and afatinib (Fig. 6C). Drugs such as AICAR, AT-7519, PHA-793887, and WZ3105 showed favorable relationships with GDSC drug sensitivity (Fig. 6D).
Fig. 6
The correlation analysis of RGS5 expression and drug sensitivity analysis. A The correlation of RGS5 expression with genes of RNA modification. B The correlation of RGS5 expression with GSVA. C The correlation between gene expression and the sensitivity of GDSC drugs (top 10) in pan-cancer; D The correlation between gene expression and the sensitivity of CTRP drugs (top 10) in pan-cancer. *P value ≤ 0.05; #FDR ≤ 0.05
Expression patterns and experimental verification of RGS5 in ccRCCWe focused on the expression pattern of RGS5 in patients with ccRCC because of previous advances in kidney cancer research. RGS5 was considerably more abundant in tumor tissues than in normal tissues in the TCGA-KIRC cohort (Fig. 7A, B). ROC curve analysis indicated high diagnostic accuracy for RGS5 in ccRCC patients (Fig. 7C). The majority of renal cancer cell lines have increased RGS5 expression, according to the CCLE database (Fig. 7D). High RGS5 expression was associated with favorable outcomes in ccRCC patients for OS, DSS, and PFI (Fig. 7E). We obtained kidney cancer tissue and nearby normal tissue for the IHC assay in order to confirm the aforementioned results. Our findings supported the increased RGS5 protein expression in tumor tissue based on the IHC score (Fig. 7F, G). RGS5 expression was found in several cell subsets, especially fibroblasts, according to an analysis of the TISCH database (Fig. 7H). Existing RGS5 and fibroblast marker (α-SMA) in ccRCC and adjacent tissues were evaluated by IF assay. Co-localization with fibroblast marker α-SMA confirmed cytoplasmic RGS5 expression in ccRCC tissues and its association with fibroblast distribution (Fig. 7I, J).
Fig. 7
RGS5 expression and prognosis analysis in renal cancer cohort. A Unpaired and B paired RGS5 expression in KIRC were analyzed. C ROC analysis of ANLN expression in the diagnosis of patients with KIRC. D RGS5 expression in renal cancer cell line and normal cell line based on the CCLE database. E Prognostic analysis of RGS5 in KIRC. F Representative pictures of IHC staining of RGS5 in tumor and matched adjacent normal tissues. G IHC scores were obtained in 14 cases of renal carcinoma and adjacent tissues. H Single-cell analysis of RGS5 in different cell subpopulations was based on the TISCH database. I Representative images of RGS5 (red) and α-SMA (green) fluorescence staining in KIRC (three cases of tumor and adjacent tissue) under ×400 magnification. Blue indicates the nucleus. J Histochemistry score (H-Score) was obtained from 3 cases of renal carcinoma and adjacent tissues. **P < 0.01; ***P < 0.001
Functional enrichment and experimental verification of RGS5 in ccRCCWe identified RGS5 and co-expressed proteins through the GeneMANIA website, where RGS5 was observed to have the strongest correlation with RGS18 (Fig. 8A). Differentially expressed genes based on median RGS5 expression were identified, with a heatmap highlighting the top 50 genes (Fig. 8B). These biological processes are significantly enriched, including nucleosome assembly, nucleosome organization, and protein-DNA complex assembly (Fig. 8C). These cellular components are significantly enriched, including nucleosome, immunoglobulin complex, and CENP-A containing nucleosome (Fig. 8C). These molecular functions were significantly enriched, including structural constituent of chromatin, protein heterodimerization activity, and snRNA binding (Fig. 8C). These signaling pathways are significantly enriched, including Neutrophil extracellular trap formation, Systemic lupus erythematosus, PI3K-Akt signaling pathway, p53 signaling pathway, and IL-17 signaling pathway (Fig. 8D). In addition, we noted that in the rich concentration of cell cycle and cell stroma-related signaling pathways, the groups with high or low expression of RGS5 had significant differences according to the GSVA results, such as olfactory transduction, homologous recombination, and cell adhesion molecules cams (Fig. 8E).
Fig. 8
Functional enrichment analysis of RGS5 expression in KIRC. A The GeneMANIA website identifies RGS5 co-expressed genes. B Heatmap showing the top 50 up-regulated genes and top 50 down-regulated genes; red, up-regulated genes; blue, down-regulated genes. C GO analysis results of RGS5 expression in KIRC. D KEGG analysis results of RGS5 expression in KIRC. E GSVA results between RGS5-high and RGS5-low group
We evaluated RGS5 expression in renal carcinoma cells and tubular epithelial cells (HK2) using WB assays, finding that RGS5 was upregulated in 786-O, ACHN, and Caki-2 (Fig. 9A). RGS5 expression in 786-O and Caki-1 cells was knocked down using siRNA to examine the possible biological role of RGS5 in renal cancer cells. When compared to the siRNA negative control (si-NC), RNA interference dramatically decreased the expression of both RGS5 (Fig. 9B). Transwell experiments showed that the migration and invasion ability of 786-O and Caki-2 cells treated with si-1 or si-2 were weaker than those treated with si-NC (Fig. 9C). Comparing the si-1 or si-2-treated 786-O and Caki-1 cells to the si-NC group, the EdU assay revealed a decrease in EdU-positive cells (Fig. 9D).
Fig. 9
Effects of RGS5 silencing on the carcinogenesis of renal cancer cell lines. A Protein expression analysis of RGS5 in renal carcinoma cell lines and normal cells by WB assay. B RGS5 silencing by targeted siRNA was confirmed using WB assay. C Transwell migration and invasion assays for siRNA transfected renal cancer cell line. D EdU assay to confirm the proliferation effect of RGS5 expression in renal cancer cell lines. **P < 0.01; ***P < 0.001
留言 (0)