
記住我


A total of 3,721 CMT-related original articles were identified in the WOS database. The metadata provided by biblioshiny (Supplementary Table 1) demonstrated that the data of the categories focused on, such as authors, journals, and cited references, were well-gathered and organized. Figure 2 shows the number of publications on CMT in each country. Researchers from a total of 71 countries worldwide have contributed to CMT studies from WOS between 2000 and 2023, with the United States, Italy, and France being the top three countries in terms of publication output. However, fewer than two articles were published in 18.3% of the countries. Importantly, more than 100 articles were published by each country of the top 10 countries.
Fig. 2
Number of publications on Charcot-Marie-Tooth disease per country (top 20)
The extensive research on CMT in the twenty-first century has dispersed publications across a wide range of over 1,000 (Supplementary Fig. 1). However, only a few journals have published more than 30 articles. In Supplementary Table 2, the sources of the top 20 biggest publications are listed, with Neuromuscular Disorders ranking the first (164 CMT papers), followed by Journal of The Peripheral Nervous System (153) and Muscle & Nerve (132). More than half of these top 20 publications journals were from the United States, while others originated from England, Germany, Italy, and the Netherlands. It was worth mentioning that these journals, having published high-quality articles about CMT, ranked among the top positions in the Journal Citation Reports (JCR) partition.
If a scholar is listed as a co-author, whether as the corresponding author or any other author, they are considered to have contributed to the production of the article. Based on this criterion, the top 10 authors and their contribution to the number of articles related to CMT since the start of this century are presented in Supplementary Table 3. Each of the authors published more than 70 papers. Notably, Professor Reilly MM, the co-director of the Centre for Neuromuscular Diseases, UCL Queen Square Institute of Neurology, London, UK, stood out with the most publications of 142 papers on CMT.
Supplementary Fig. 2 illustrates the cooperative relationships between countries, with the intensity of blue color representing the number of publications. The lines between countries symbolize cooperative relationships, and their thickness corresponds to the intensity of frequency-based collaboration. We identified 743 collaboration connections. The United States had the strongest cooperation with other countries, collaborating with 65 countries, resulting in a total collaboration frequency (f) of 1,069. It closely cooperated with the United Kingdom (f = 146), followed by Italy (f = 116), Germany (f = 91), Australia (f = 71), France (f = 62), Belgium (f = 61), and China (f = 57). The second most cooperative country was Germany, with cooperation with 58 other countries (total collaboration frequency of 477), including the United Kingdom (f = 87), Germany (f = 43), France (f = 38), Australia (f = 33), Belgium (f = 29), Switzerland (f = 28), and Spain (f = 24).
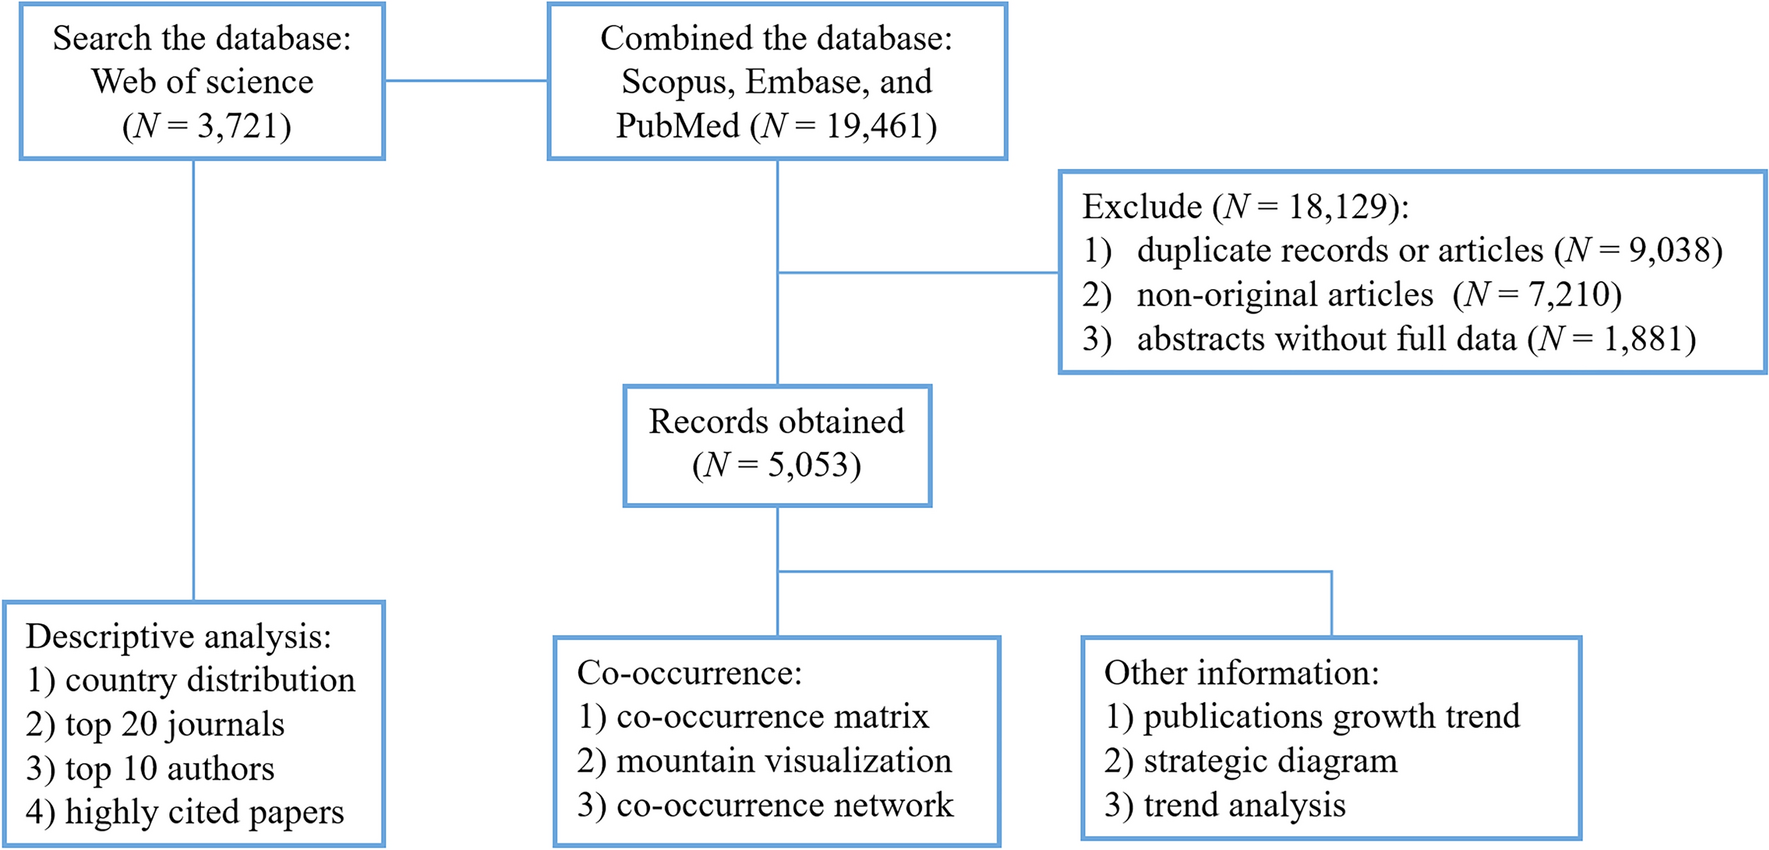
Publication growth trend from merged databaseApplying the methods outlined above, the study identified 5,053 relevant records after merging the bibliometric information of the four databases and screening. Figure 3 illustrates the temporal changes in the number of CMT publications from January 2000 to December 2023. The data indicated an increasing trend in the number of publications on CMT since the beginning of the twenty-first century. The highest number of publications was recorded in 2023, with a slight dip observed in 2007. The publication count of CMT has been consistently increasing over the years, as depicted by the red dotted line with a positive slope. This line represents the linear fit of the publication count from 2000 to 2023. The equation of the line is y = 7.7943*x – 15468, where “y” represents the publication count of each year and “x” indicates the specific year.
Fig. 3
Distribution of publications on Charcot–Marie–Tooth disease. The dotted line indicates a linear fit based on the number of publications from 2000 to 2023. The equation of the dotted line: y = 7.7943*x – 15468; y: number of publications, x: year, R2: coefficient of determination
Clustering and co-occurrence keywords networkThis study obtained 25,466 keywords from the retrieved 5,053 articles, with a cumulative frequency of 156,723 occurrences. According to H-index, the top 124 words were selected as high-frequency words, and the cumulative percentage of their frequencies was 41.53% (65,088/156,723). After screening for high-frequency keywords, BICOMB generated a matrix that mapped keywords to source articles. In this matrix, the source document set was represented as rows, while the high-frequency keywords were represented as columns (Supplementary Table 4). Additionally, by analyzing the data, a co-occurrence matrix for keywords could be obtained, with the numerical values indicating the number of times two words appeared together (Supplementary Table 5).
The 124 high-frequency keywords were segregated into three clusters, which are represented by the three small mountains in Fig. 4. Cluster 1, distinctly separated from the other two clusters, had the lowest Esim value, and the similarity of its objects (Isim) was the highest. Cluster 2 had the largest size.
Fig. 4
Mountain visualization result of the double-cluster analysis of keyword-source article matrix generated with gCLUTO software. A larger “Size” of the mountain indicates a greater number of clustered keywords in that particular category. The distance between each mountain (“Esim”) is proportional to their clustering effect (inter-cluster average similarity). The height of the mountain (“Isim”) is directly proportional to the similarity of the objects in the cluster (intra-cluster average object similarity)
It is important to note that, despite gCLUTO only classifying the keywords into three clusters, some of these clusters were further subdivided into smaller topics based on their semantic relationships. The three clusters and their respective subclusters are listed below.
Cluster 1:Cell and animal model studies: animal cell; animal model (experiment/tissue); chemistry; controlled study; human cell; model; mouse; nonhuman; rat; Schwann cell; unclassified drug.
Associated proteins: axon; gene expression: GTP phosphohydrolases; guanosine triphosphatase; membrane protein; metabolism; mitochondrion and mitochondrial protein; mitofusin 2; myelin; nerve tissue proteins; neurofilament protein; protein; protein expression; protein function; protein domain; western blotting.
Neurological studies: motor neuron; myelination; nerve fiber/ degeneration; pathogenesis; pathology; peripheral nerve; physiology.
Cluster 2:Epidemiological distribution: adolescent; adult; aged; case report; child; clinical article; family/family history; female; follow up; human; infant; male; middle aged; preschool child; retrospective study; young adult.
Disease diagnosis: demyelination; diagnostic imaging; disease association; disease course; electrophysiology; histopathology; magnetic resonance imaging; motor neuropathy; muscle action potential; muscle strength; nerve biopsy; nerve conduction; neurologic examination; neuropathy; neuropathology; neurosciences and neurology; pathophysiology; peripheral neuropathy; polyneuropathy; sensory dysfunction; sensory neuropathy; sural nerve; tendon reflex; treatment outcome.
Clinical feature: clinical feature; complication; disease severity; foot malformation; gait disorder; human tissue; limb weakness; muscle atrophy; muscle weakness; skeletal muscle; treatment outcome.
Cluster 3:Genetic analysis: allele; amino acid sequence; amino acid substitution; cohort analysis/study; connexin; DNA sequence; DNA sequence mutation; exon; gap junction protein; gene; gene deletion; gene duplication; gene frequency; gene mutation; genetic analysis; genetic association; genetic predisposition to disease; genetic screening; genetic variability; genetics; genotype; GJB1; heterozygote; high throughput sequencing; major clinical study; missense mutation; molecular genetics; molecular sequence data; mutation; myelin protein; nucleotide sequence; onset age; pedigree; phenotype; PMP22; polymerase chain reaction; priority journal; sanger sequence; sequence analysis; single nucleotide polymorphism; whole exon sequencing; mutation.
Figure 5 presents the co-occurrence network of the 124 high-frequency keywords. For instance, the top five highly co-occurred keywords were animal model (experiment/tissue) > controlled study > mouse > nonhuman > unclassified drug in Cluster 1, human > male > female > adult > child in Cluster 2, and mutation > genetics > gene mutation > phenotype > myelin protein in Cluster 3, respectively.
Fig. 5
Co-occurrence network of keywords. The figure was generated with the Java program VOSviewer. The top 124 high-frequency keywords were included in the network, which was grouped into three categories. Each color represented a specific cluster and the size of the circle represented the number of times the keyword appeared. The line between the two words indicates their co-occurrence
Strategic diagramBased on the clustering results, Fig. 6 presents the strategic diagram derived from the keyword co-occurrence matrix. Cluster 1 (cell and animal model studies, associated proteins, and neurological studies) was positioned in the 2nd quadrant, indicating a cluster of well-developed and isolated themes with high maturity. Cluster 2 (epidemiological distribution, disease diagnosis, and clinical features) was located in the 1st quadrant, suggesting its high maturity and relative independence from other research areas. Cluster 3 (genetic analysis) was positioned in the 4th quadrant, implying basic and transversal themes with low maturity and might evolve into a research hotspot or a future trend within the broader context of CMT studies.
Fig. 6
Strategic diagram of three clusters. Cluster 1, cell and animal model studies, associated proteins, and neurological studies. Cluster 2, epidemiological distribution, disease diagnosis, and clinical features. Cluster 3, genetic analysis. The diagram was drawn in Microsoft Excel. Centrality represented the closeness between each cluster and other clusters, and the larger the value, the closer the cluster was to the core of the discussion topic. Density represented the strength of the connections between keywords
Highly cited articlesBased on bibliometric data gained from WOS, information about 20 highly cited papers is presented in Supplementary Table 6 [11,12,13,14,15,16,17,18,19,20,21,22,23,24,25,26,27,28,29,30], illuminating focal points within researchers’ interests. As expected, the topics of highly cited papers were similar to our clustering results. Five of them were related to cohorts or families to identify associated mutations of CMT [14, 16, 18, 25, 27], which echoed keywords like “cohort” and “family/family history” in Cluster 2 or 3. In addition, articles about the establishment of animal models have also received a high frequency of citations [19, 22], which matched keywords like “animal cell” and “animal model (experiment/tissue)” in Cluster 1. Additionally, six highly cited papers were related to mitochondrial fusion proteins and their related genes, which matched keywords like “protein function” and “mitofusin 2” in Cluster 1 and “genetic analysis” in Cluster 3.
留言 (0)