Bioinformatics analysis
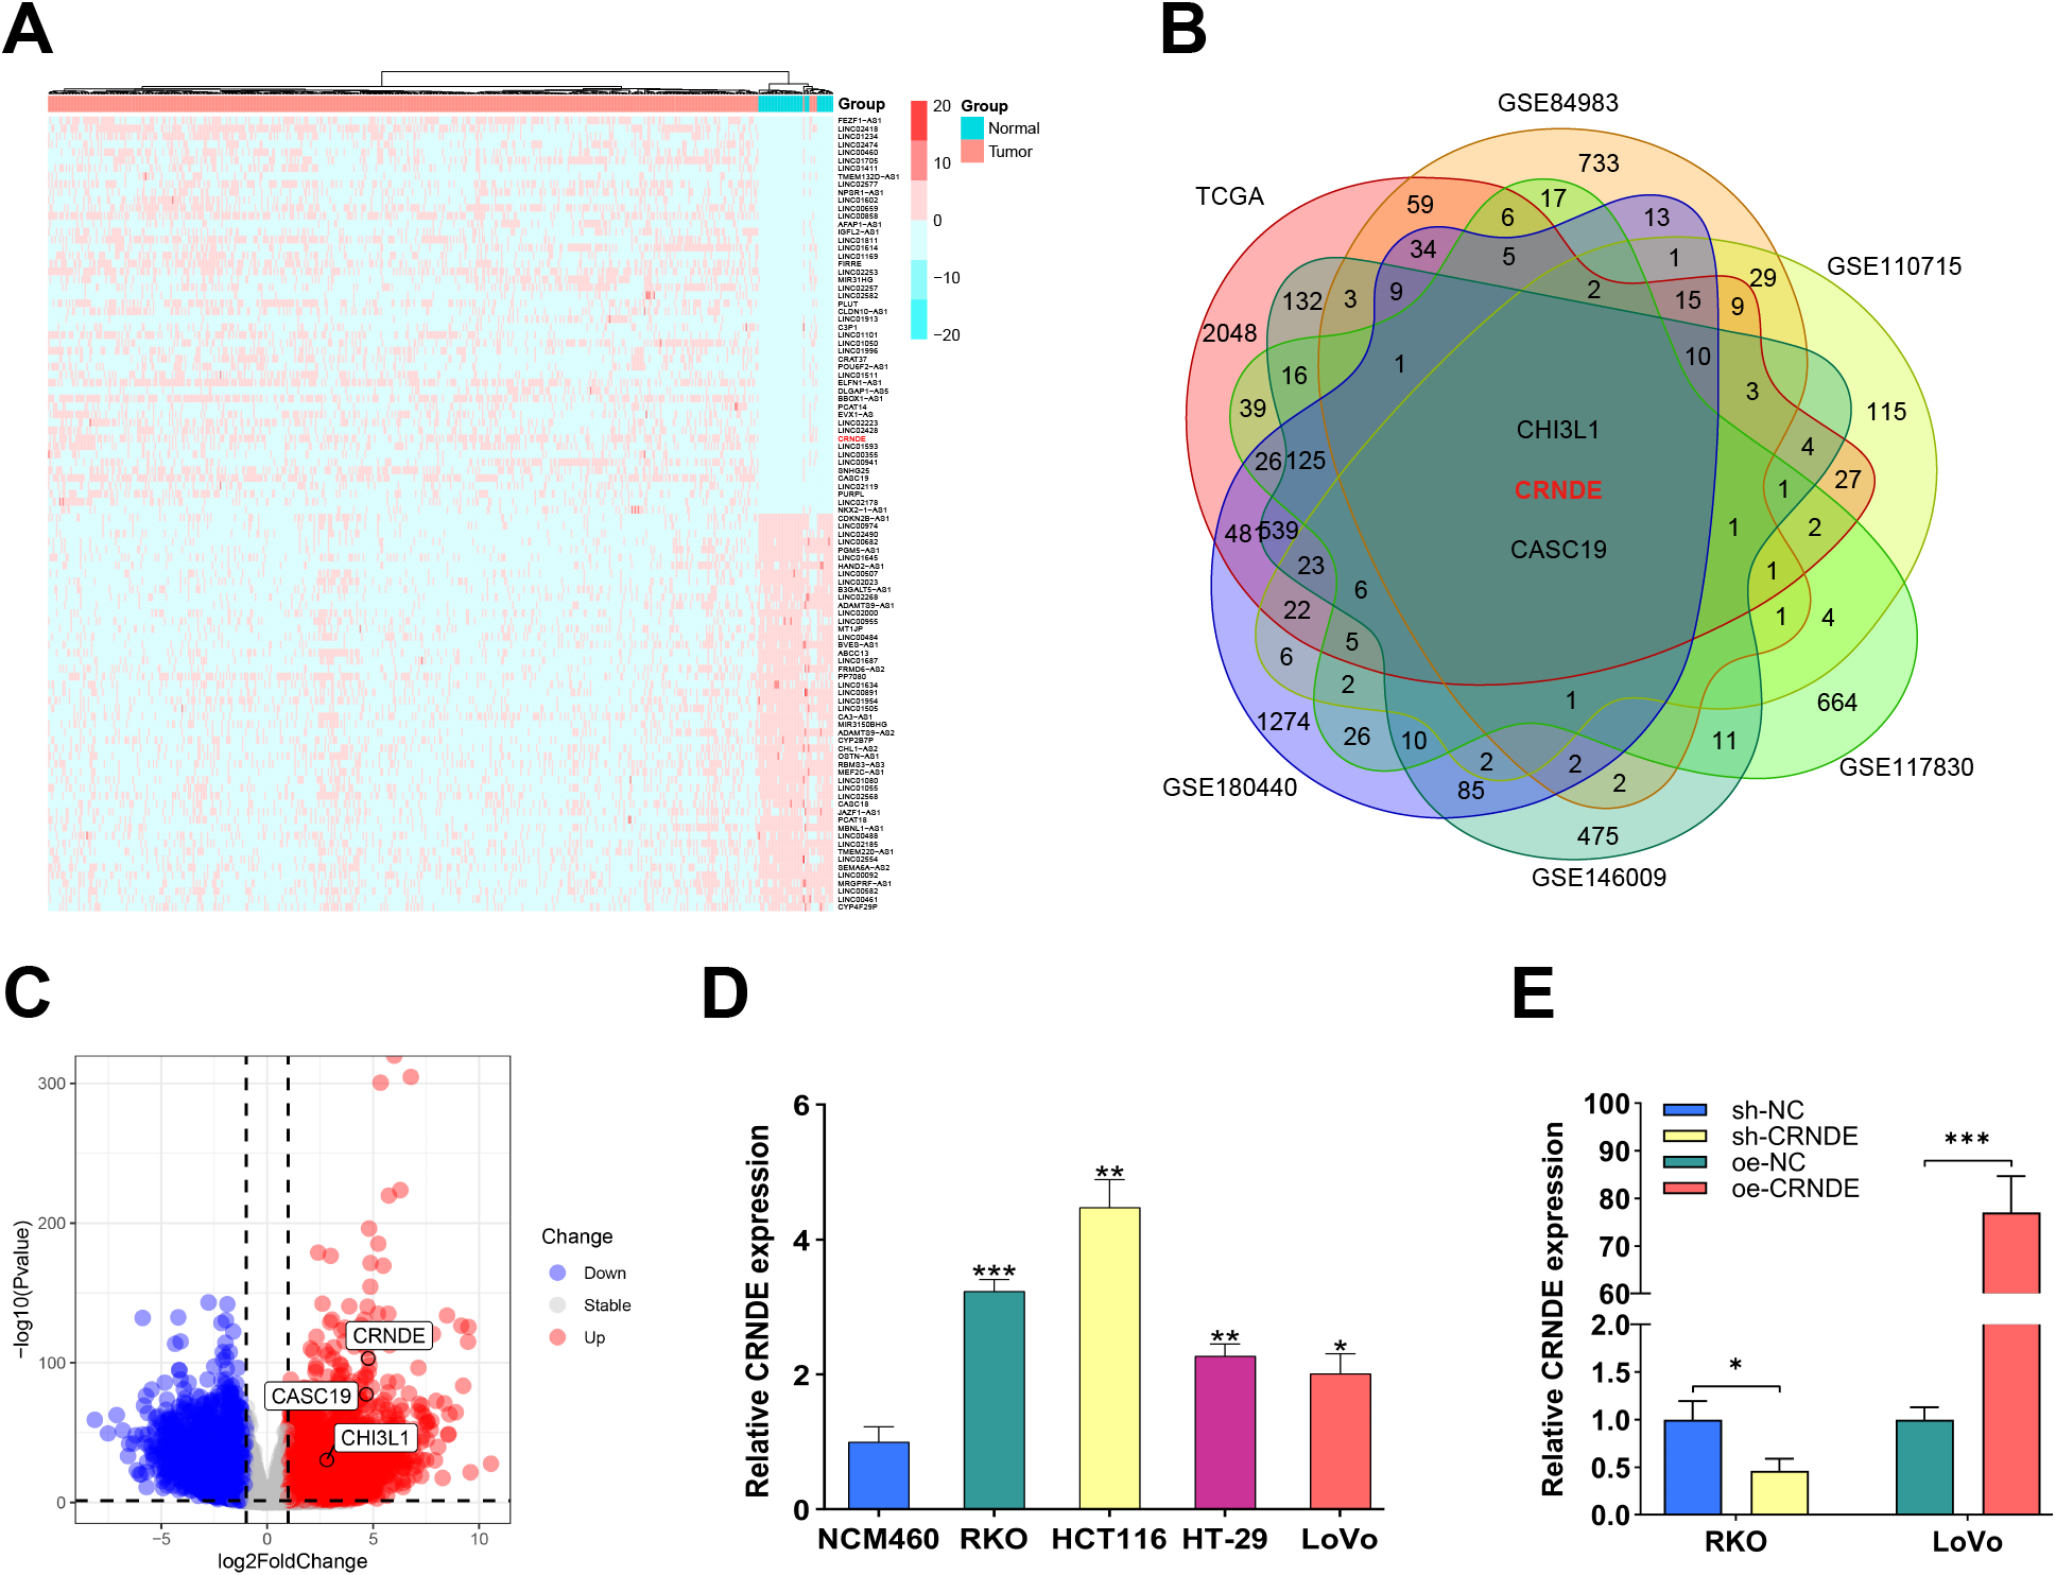
We utilized datasets including TCGA-COAD, GSE84983, GSE110715, GSE117830, GSE146009, and GSE180440 to conduct comprehensive bioinformatics analysis to explore the molecular characteristics of CC. First, the RNA-seq data were normalized, and differential expression analysis was carried out. The core genes were visualized through Venn diagrams, heatmaps, and volcano diagrams. To further investigate the role of CRNDE in regulating CC development, we classified patients into high- and low-expression groups based on the median expression level of CRNDE. We then identified dysfunctional signaling pathways in CC through gene set enrichment analysis (GSEA) and utilized R language packages, including Pathview and Circos, to visualize the corresponding data. For the upstream regulatory mechanism of CRNDE, we used databases such as UCSC (https://genome.ucsc.edu/) and JASPAR (https://jaspar.elixir.no/) to predict potential transcription factors for CRNDE.
Cell culture and transfection
RKO and LoVo were stored in our laboratory. Cells were cultured in complete medium containing 10% fetal bovine serum (FBS) and maintained at 37 °C and 5% CO₂ with regular media changes. RKO and LoVo cells were respectively transfected with shRNA and the CRNDE overexpression plasmid (Invitrogen, USA) respectively. The cells were seeded in 6-well plates on the day prior to transfection to ensure a cell density of 70–80%. For shRNA transfection, the plasmid was first diluted proportionally with Lipofectamine 2000 (Invitrogen) in serum-free medium then incubated to form complexes. After transfection, qRT-PCR was used to detect transfection efficiency. The transfection method of the overexpression plasmid was the same as above, all operations were performed under sterile conditions, and cells were used at fewer than six passages to ensure the reliability of the experimental results. The detailed sequences are presented in the supplementary Table 1.
Quantitative real-time polymerase chain reaction assay
Total RNA was extracted via TRIzol (Invitrogen) following the manufacturer’s protocol, and the RNA concentration and purity were measured by a NanoDrop 2000 spectrophotometer (Thermo, USA). Then, 1 µg of total RNA was reversed to cDNA. The qRT-PCR reaction was performed in a 10 µl system consisting of 5 µl of 2x SYBR Green PCR Master Mix (Seven, China), 0.5 µl of 10 µM forward primer, 0.5 µl of 10 µM reverse primer, 1 µl of cDNA template, and 3 µl of nuclease-free water. The relative gene expression was calculated using the 2−ΔΔCt method. U6 and GAPDH were used as the reference genes.
Transwell assay
For the invasion assays, the bottom of the upper chamber was coated with Matrigel (Corning, USA). Transfected cells were washed twice with PBS, and seeded into the upper chamber with the serum-free medium. The lower chamber was filled with complete medium, which served as the chemoattractant. The chambers were then incubated at 37 °C with 5% CO₂ for 48 h. After incubation, non-invading cells on the upper side of the membrane were carefully removed, and the cells that had traversed the membrane were fixed with 4% paraformaldehyde (Beyotime, China) and stained with crystal violet (Beyotime) for 15 min. The migration assay followed a similar protocol but without Matrigel coating on the bottom of chambers. Finally, the chambers were imaged under a microscope (Olympus, Japan), and the number of invasive cells on the bottom surface of each chamber was determined using ImageJ software.
Cell proliferation assay
To assess the proliferative capacity of tumor cells, EdU incorporation and colony formation assays were performed. For EdU assay, cells were seeded into 24-well plates and incubated with EdU working solution (Invitrogen) at 37 °C for 2 h. After incubation, the cells were washed with PBS, fixed, permeabilized, and then incubated with the reaction mixture at room temperature in the dark for 30 min. Nuclei were stained with Hoechst. EdU-labeled cells were observed and imaged using a fluorescence microscope, and the percentage of EdU-positive cells in each sample was quantified using ImageJ software. For the colony formation assay, cells were digested into a single-cell suspension and seeded into 6-well plates. Tumor cells were cultured at 37 °C in a 5% CO₂ incubator until visible colonies formed. Cells were then washed with PBS, fixed, and stained. Images were captured, and colonies with a diameter greater than 1 mm were counted.
CCK-8 assay
The CCK-8 assay was used to assess the drug sensitivity of RKO and LoVo cells to 5-FU (MCE, China). Tumor cells were reseeded in 96-well plates and incubated with 100 µl of complete medium for 24 h. Subsequently, 100 µl of 5-FU solutions at varying concentrations were added to each well, with three replicate wells for each concentration. After 48 h of drug treatment, 10 µl of CCK-8 reagent (Beyotime) was added to each well and incubated at 37 °C for 1 h according to the manufacturer’s instructions, and the absorbance values were determined at 450 nm using microplate reader. 5-FU concentration vs. tumor cells viability were visualized using GraphPad Prism 9.0 (GraphPad Software, USA) and the half-inhibitory concentration (IC50) was calculated.
Western blot analysis
Total proteins from tumor cells were extracted and diluted with RIPA buffer to ensure equal protein concentrations across all samples. The proteins were then separated by vertical electrophoresis using a 10% SDS-PAGE (Epizyme, China), followed by transfer onto PVDF membranes (Millipore, USA). The membranes were blocked with QuickBlock (Servicebio, China) for 10 min, and subsequently incubated overnight at 4 °C with specific primary antibodies. The following day, the membranes were incubated with HRP-conjugated secondary antibodies for 1 h at room temperature. Signal detection was performed using a chemiluminescent substrate (Beyotime), and images were captured via a Bio-Rad imaging system.
Animals
To explore the in vivo effects of CRNDE, tumor xenografts were established in 6-week-old female BALB/c nude mice obtained from Vital River (China). Tumor cells were administered to mice via subcutaneous injection. On day 25, surgical excision of the xenograft tumors was performed, during which tumor weights and volumes were measured. All the animals were kept in a specific pathogen-free environment. No unexpected mortality occurred among the mice during the experiment. The protocols were pre-approved and conducted under the policies of the Ethics Committee of Harbin Medical University Cancer Hospital.
Flow cytometry assay
Apoptosis was assessed via Annexin V-FITC Apoptosis Detection Kit (Beyotime). The cells were incubated with 5 µl Annexin V and 10 µl PI at room temperature in the dark for 15 min. The fluorescence of Annexin V and PI was then analyzed by flow cytometry, allowing for the distinction between early apoptotic cells and late apoptotic or necrotic cells. The data were analyzed using FlowJo software, and apoptosis rates were compared before and after transfection to evaluate the impact of gene silencing and overexpression.
Immunofluorescence assay
Tumor cells were seeded into 12-well plates and incubated for 24 h. The cells were then treated with 5-FU for 48 h. Following treatment, the cells were fixed with 4% paraformaldehyde for 30 min and washed three times with PBS. Permeabilization was achieved by treating the cells with 0.1% Triton X-100 for 15 min. After additional washes with PBS, the cells were blocked with 5% BSA at 37 °C for 2 h. Immunostaining was performed using a primary antibody against GSDMD, followed by incubation with a corresponding fluorescence-conjugated secondary antibody at 37 °C in the dark for 1 h. Nuclei were stained with DAPI. After washing, images were captured using a fluorescence microscope. The fluorescence intensity was analyzed and compared with that of control groups to assess pyroptosis in tumor cells.
RNA pull-down assay
The RNA pull-down assay was employed to investigate the direct interaction between CRNDE RNA and RIPK3 protein. Cells were then lysed and the lysates were subjected to ultracentrifugation to remove cell debris. Biotin-labeled CRNDE RNA probes were incubated with the cell lysates, allowing the formation of RNA-protein complexes. Magnetic beads were then added to capture the RNA-protein complexes, followed by magnetic separation and extensive washing to eliminate non-specific binding. The complexes were eluted using SDS-PAGE, and the interaction between CRNDE and RIPK3 was confirmed and quantified via Western blot analysis using RIPK3-specific antibodies. The antisense RNA probe was used as the negative control to ensure the specificity of the interaction.
Fluorescence in situ hybridization assay
To determine the subcellular localization of CRNDE and RIPK3, FISH was performed. CC cells were first fixed with 4% paraformaldehyde for 15 min and permeabilized with 0.5% Triton X-100 for 10 min. Then, cells were respectively hybridized with the probes for CRNDE, followed by counterstaining with DAPI, according to the manufacturer’s protocols (Ribobio, China). Moreover, the cellular localization of RIPK3 in tumor cells was detected by IF. A confocal laser scanning microscope (Zeiss, Germany) was utilized to observe the relative positions of probes in tumor cells.
Co-immunoprecipitation assay
Tumor cells were meticulously washed with ice-cold PBS and lysed with Non-Denaturing Lysis Buffer (Abbkine, China). The resulting lysates were subjected to centrifugation for debris removal. Immunoprecipitation was subsequently conducted by incubating the pre-cleared lysates with Protein A/G Magnetic Beads (Abbkine) coated with RIPK3 primary antibody, and the incubation was carried out overnight at 4 °C. After the binding process, the bead-protein complexes were subjected to thorough washing to eliminate any unbound proteins and contaminants, utilizing Wash Buffer (Abbkine). Elution of the immunoprecipitated protein complexes was achieved by adding SDS-PAGE Loading Buffer (Seven). Subsequent Western blot analysis was employed to discern the interacting partners of RIPK3.
Chromatin immunoprecipitation assay
The tumor cells were resuspended in PBS containing 1% formaldehyde and cross-linked at 37 °C for 10 min, followed by washing with PBS containing 1 mM PMSF and quenching with 1.375 M glycine and centrifugation to collect the cells. For nuclear preparation, cells were lysed using Lysis Buffer (BersinBio, China), and chromatin was sheared by sonication to fragments of 200–800 bp. The supernatant was collected, and DNA fragment size was assessed by agarose gel electrophoresis. Samples were then divided into IP, IgG, and input groups, with antibodies added for incubation at 4 °C for 12–16 h. Immunoprecipitation was performed using Protein A/G magnetic beads. Following elution, decrosslinking, and precipitation, enriched DNA was obtained, and the enrichment efficiency was validated by qRT-PCR.
Luciferase reporter assay
To assess the impact of TFAP2A on CRNDE promoter activity, a luciferase reporter assay was conducted. Cells were cultured to 60–70% confluence, and transfection mixtures were prepared. Wild- and mutant-type luciferase reporter plasmids were separately transfected into the cells, followed by incubation at 37 °C for 24 h. After incubation, cells were collected, washed with ice-cold PBS, and lysed according to the instructions of the luciferase assay kit to obtain cell lysates. The cell lysates were then added to a 96-well plate along with the luciferase substrate, and luciferase activity was immediately measured using a microplate reader.
Statistics
Statistical analysis was conducted using SPSS software (IBM SPSS, USA). For data conforming to the Gaussian distribution, independent samples t-test or ANOVA was applied, whereas for non-normally distributed data, the Mann-Whitney U test or Kruskal-Wallis test was used. Graphical representations were generated using GraphPad Prism 9.0 (USA) to visually portray data distribution and research outcomes. Results are presented as mean ± standard deviation, and p-value less than 0.05 were considered statistically significant.


留言 (0)