
記住我
The evolution of behavioral tasks in Neuroscience, from traditional mazes to touchscreen paradigms, has yielded profound insights about the dynamic interplay between brain and behavior. The development and refinement of rodent touchscreen chambers, as well as the wide variety of tasks developed for this platform over the years, has been remarkably successful in evaluating different cognitive skills in both wild-type and genetically modified rodent strains, as well as in the ability to investigate potential behavioral and neurophysiological changes resulting from pharmacological interventions (Bussey et al., 1994; Bussey et al., 1997; Bussey et al., 2001; Talpos et al., 2009; Horner et al., 2013; Mar et al., 2013; Hvoslef-Eide et al., 2016; Nilsson et al., 2016).
Ever since Skinner’s groundbreaking work in the context of reflexive physiology introduced automated training in the 1930’s, researchers have uncovered a plethora of tools for understanding learning processes (Skinner, 1937, 1986; Staddon and Cerutti, 2003). The development of operant conditioning boxes allowed for the precise manipulation of contextual contingencies and the measurement of behavior over a specified period of time, and significantly reduced the interaction between the experimenters and the animal subjects (Ferster, 1953; Weiss, 1972; Wetzel, 1986; Staddon and Cerutti, 2003; Mar et al., 2013; Sakagami and Lattal, 2016; Pinkston, 2022). By using levers or buttons the animals can press or peck in order to obtain a reinforcement (e.g., water, food pellets among others), the involvement of the experimenter during training is minimized, in favor of an auto-shaping process whereby the animals can learn the desired behaviors independently.
These operant conditioning apparatuses continued to evolve, and over time researchers started to incorporate computer screens where different images were displayed, and eventually touchscreen systems, which allowed the animals to directly interact with the displayed images in order to make a choice. The touchscreen chambers, which were initially developed to be used with pigeons, as well as human and non-human primates, were eventually adapted for rodents in the mid-nineties, and have become an invaluable tool in cognitive and behavioral neuroscience research since then (Wright et al., 1988; Bussey et al., 1994; Markham et al., 1996; Bussey et al., 2001; Izquierdo et al., 2006; Bussey et al., 2008; Winters et al., 2008; Mar et al., 2013; Nithianantharajah et al., 2015; Nilsson et al., 2016; Sakagami and Lattal, 2016; Phillips et al., 2017; Sullivan, 2022). In comparison to more traditional approaches to rodent phenotyping methods, which require multiple tests in different environments such as open-fields, mazes or conventional operant conditioning boxes, the touchscreen technology offers a controlled setting that closely mimics human cognitive assessment. This allows not only for more accurate data collection, but also for a significantly less stressful experience for the animals (O’Leary et al., 2018; Dumont et al., 2021; Sullivan, 2022).
Over the years, researchers have developed multiple tasks that cover a wide range of cognitive functions, such as visual discrimination, object-location paired-associations, visual-category learning, working memory, rule-switching, or pattern separation tasks (Hvoslef-Eide et al., 2015, 2016; Kim et al., 2015, 2016; Kwak et al., 2015, 2016; Creighton et al., 2019; Barnard et al., 2021; Wang et al., 2022). In addition, the touchscreen chamber enables high throughput testing by allowing multiple animals to be tested simultaneously; effectively streamlining the efficiency of the experimental procedures and allowing experiments to be conducted as required. With its high degree of automation, similarities to human-based cognitive assessments, and the standardization of touchscreen tasks, this behavioral apparatus has enhanced the translatability of preclinical models, leading to its widespread adoption across multiple research institutions. These include universities, biotechnological firms, and pharmaceutical companies, particularly as mice have become the preferred model organism in basic and preclinical research, due to the widespread availability of transgenic lines and the continuous refinement of genetic and molecular tools that enable in vivo recordings and circuit labeling (Dickson et al., 2013; Horner et al., 2013; Hvoslef-Eide et al., 2016; Dumont et al., 2021).
Among the different applications of this technology, reversal learning tasks have emerged as an important tool for assessing cognitive flexibility. These tasks require multiple executive functions such as attention, working memory or response inhibition, and depend on the subjects’ adaptability to changing rewards or feedback (Fowler, 1980; Cools et al., 2002; Dickson et al., 2013; Bryce and Howland, 2015; Izquierdo et al., 2017; Marquardt et al., 2017; Van den Broeck et al., 2019; Odland et al., 2021). Serial reversal paradigms further test the ability to learn, maintain, and then re-learn behavioral rules over multiple iterations, as each change requires the suppression of previously reinforced behaviors and the subsequent adaptation to new rules, thus engaging executive functions such as inhibitory control, cognitive flexibility and attentional processes to an even greater extent (Boulougouris et al., 2007; Castañé Anna et al., 2010; Kosaki and Watanabe, 2012; Dickson et al., 2013; Izquierdo et al., 2017).
Reversal learning studies were among the first to adopt touchscreen technology for both human and non-human primates, whereas rodent studies typically relied on either spatial or non-visual cues - a discrepancy that stemmed from automation challenges and difficulties in standardizing experiments across species. However, touchscreen technology has bridged this gap and enabled standardized tasks that could be adapted and used across various species, while maintaining the underlying focus on adaptive responses and rule switching (Bussey et al., 1997; Bussey et al., 2001; Talpos et al., 2009; Hvoslef-Eide et al., 2015, 2016; Nithianantharajah et al., 2015; Nilsson et al., 2016).
Despite its longstanding use, reversal learning remains an important behavioral paradigm, especially when it comes to identifying learning and cognitive flexibility deficits in neuropsychiatric disorders, such as schizophrenia, obsessive-compulsive disorder (OCD), depression, autism, Parkinson’s, and Alzheimer’s disease (Lafleche and Albert, 1995; Valerius et al., 2008; Wobrock et al., 2009; Marazziti et al., 2010; Millan et al., 2012; D’Cruz et al., 2013; Gruner and Pittenger, 2017; Guarino et al., 2019; Jara-Rizzo et al., 2020; Monni et al., 2023). Concurrently, cross-species studies have also highlighted the role of the prefrontal cortex - specifically, the orbitofrontal (OFC) and medial prefrontal (mPFC) cortices – as well as subcortical regions such as the dorsal striatum and amygdala, in facilitating these tasks (Dias et al., 1996; Cools et al., 2002; Chudasama and Robbins, 2003; Hornak et al., 2004; Hampshire and Owen, 2006; Izquierdo et al., 2006, 2017; Clatworthy et al., 2009; Brigman et al., 2010; Graybeal et al., 2011; Izquierdo and Jentsch, 2012; Lucantonio et al., 2014; Alsiö et al., 2015).
While the benefits of touchscreen-based tasks for assessing cognitive and behavioral skills in rodents, and more specifically mice, are clear, especially in bridging the gap between species through standardized procedures, the adoption of these technologies is not without its challenges. Despite its numerous advantages, the main concern regarding the adoption of rodent touchscreen chambers has remained relatively unchanged over the years, and that is the considerable financial investment required. The expenses associated with acquiring even a single exemplar of these touchscreen chambers can be prohibitively high, which effectively hinders an even more widespread adoption and a swifter integration into the arsenal of behavioral assessment tools in basic research. Even though this technology has become progressively less expensive, the large financial outlay has led different research groups to develop their own alternatives to circumvent this issue (Pineño, 2014; O’Leary et al., 2018; Wiesbrock et al., 2022; Eleftheriou et al., 2023). This is particularly notable considering the accessibility of modern touchscreens as well as the different components required for the assembly and functioning of a similar product, which allow for the development and programming of various touchscreen-based tasks tailored to specific research needs.
Driven by the evolving demands of cognitive and behavioral neuroscience for automated and adaptable experimental tools, alongside the practical challenges of high equipment costs, and the need to collect behaviorally relevant data on both wild-type and Alzheimer’s disease mouse models, we set out to develop a custom touchscreen apparatus for mice. To validate this approach, we designed and implemented two distinct touchscreen tasks with a specific focus on cognitive flexibility: a visual discrimination serial-reversal task, and a location discrimination serial-reversal task.
Our efforts reflect a need to develop versatile and accessible technologies to advance research in rodent cognitive flexibility, and ultimately contribute to a broader comprehension of both normal and pathological brain functions.
2 Materials and methods 2.1 HardwareThe touchscreen apparatus was designed using computer-aided design software (SOLIDWORKS 2023 SP 3.0, Dassault Systèmes) and was adapted from specifications detailed in prior studies (Horner et al., 2013), as seen in Figures 1A, B. The inner chamber featured a trapezoidal behavioral area, or more accurately, a triangle with rounded corners, optimized to focus on both the touchscreen and the reward area. Specific dimensions were 80 mm wide at the reward area, 260 mm wide at the screen, and a trapezoidal length of 240 mm, with a working area height of 190 mm and wall thicknesses of 10 mm. The walls were 3D printed using black PLA to minimize external light interference and enhance visual contrast during experiments. The lid and floor of the chamber were constructed from 6.5 mm thick black plexiglass to facilitate cleaning and maintain durability.

Figure 1. Custom-built touchscreen chamber for mouse behavioral studies. The tree-quarter (A) and side profile (B) views of the touchscreen chamber, highlighting the integrated design features and structural components. (C) Interior view of the chamber during a pre-training session of the location discrimination serial-reversal task, with a blinking cue on the right side of the screen.
For the touchscreen interface we selected a Samsung Galaxy Tab A 8.0 SM-T350 (Samsung Electronics Co., Ltd.), with a resolution of 1,024 × 768 pixels, mounted horizontally opposite the reward area and accessed through a 163 × 125 mm aperture. This tablet not only recorded touch interactions but also managed the experimental flow, communicating with a Raspberry Pi (RPi) 4 Model B (8 GB RAM). The Raspberry Pi was enclosed in a custom 3D-printed case attached to the touchscreen wall, designed with apertures for cable management and component interconnection.
Reward delivery was managed using a 5V solenoid valve connected to medical-grade silicone tubing (HelixMark Standard Silicone Tubing, Freudenberg Medical), which extended to a metal tube. This tube, protruding 10 mm from the wall, was 3 mm in diameter and dispensed approximately 2.5 μl of 10% sucrose water. The sucrose solution was stored in a 60 ml syringe, functioning as the reservoir for the system. The availability of the reward was signaled by a blue LED visible through a 3 mm round aperture, positioned 10 mm above the reward tube, and auditory cues that varied by the type of response were emitted through the tablet’s speakers.
Videos were recorded by a small camera (Raspberry Pi Camera Module 2), positioned on top of the lid, to capture detailed activity within the chamber, and enhanced by an array of infrared LEDs for consistent illumination under low lighting conditions (Figure 1C). This setup not only allowed the videos to be recorded locally on the RPi for later analysis, but also enabled the hosting of a local live stream from inside the chamber as soon as the trial software started. This annotated live stream allowed experimenters to supervise real-time activity within the chamber and address any issues that might interfere with the flow of the experiment.
2.2 SoftwareTo give researchers the ability to create and control task parameters, we used an XML schema to define each experiment’s specifications. An XML configuration file for an experiment is structured with tags that define different functions and sections of the experiment. Each function or parameter is enclosed in and may have various attributes. The general outline of a configuration file is shown in Figure 2.
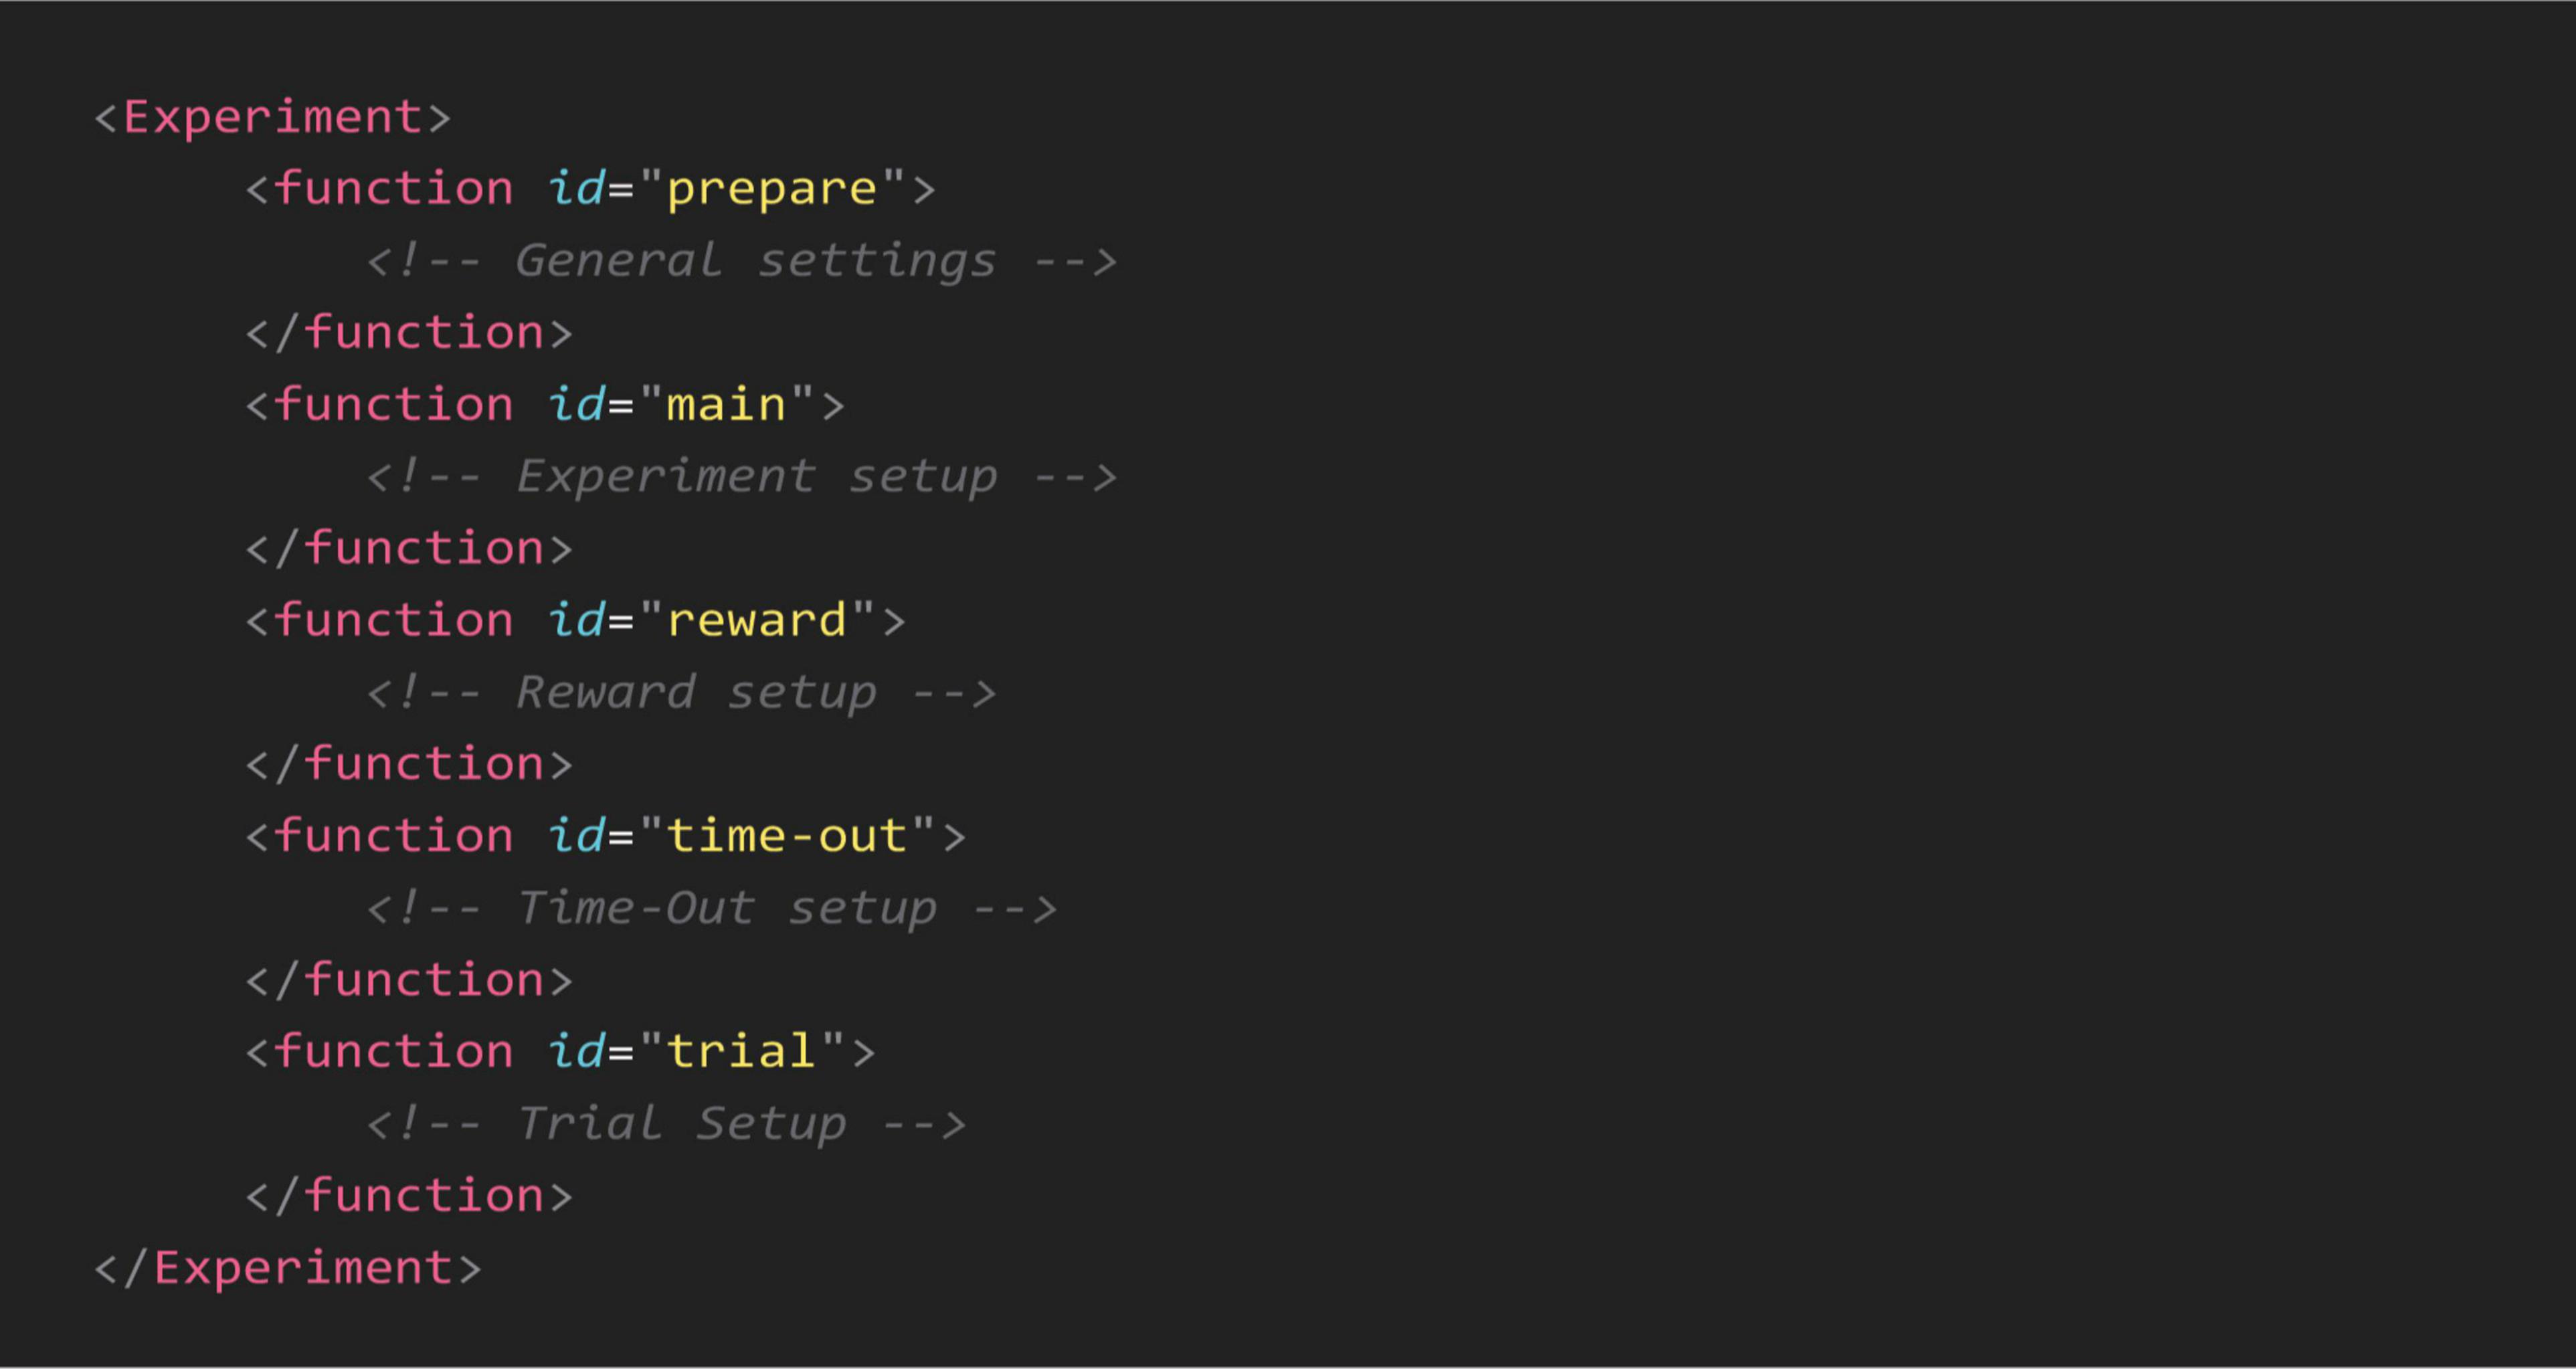
Figure 2. General outline of an XML configuration file. Each configuration file is divided into sections, enclosed within specific “function” tags, to control task parameters. The “prepare” function defines general settings, including session duration, screen sections, initial rewards, and pre-loaded images or virtual objects. The “main” function sets the trial loop by specifying the number of trials per session. Task outcomes are adjusted by the “reward” and “time-out” functions, which configure audio-visual feedback and reward delivery based on the animal’s responses. The “trial” function specifies trial parameters, such as visual cues, object dimensions and valence for each learning stage. All parameters are fully customizable to meet experimental requirements.
There are five main functions within each configuration file for setting up the experimental environment. The prepare function allows experimenters to specify key parameters: (1) overall duration, which dictates that the experiment continues until either completion or the specified duration elapses; (2) background color, which defines the visual setting of the experiment; (3) number and size of sections, determining whether the active touching area is divided into two or four sections; (4) section dividers, specifying both the presence and color of dividers between sections; (5) initial reward cues, including the presence, number, and timing interval between these cues; (6) touch time-out, setting the duration before a time-out is triggered when the wrong image/3D object or side of the screen is touched; (7) image pre-loading, which minimizes the image/3D object load times during the experiment.
Within the main function, experimenters can specify the number of trials, setting it to a predetermined amount based on their experimental design. In the reward function, users can specify a text for logging in the final reports whenever the reward is triggered, adjust the frequency and duration of the tone played, and control the opening and closing durations of the solenoid valve. Similar to the reward function, the time-out function allows for the display of a time-out alert by filling the entire screen with a bright color for a specified duration. Users can also determine the sections where the correct and incorrect images appear; if not specified, experimenters can choose to randomize the location for each trial.
Finally, in the trial function, experimenters can define each trial’s parameters. For visual discrimination tasks, they can select a single image or 3D virtual object or allow a random choice from a series of images for both rewarded (S+) and unrewarded (S-) categories. In location discrimination tasks, the settings allow for a cue to be set to static or blinking, with adjustable frequency. This configuration syntax enables experimenters to create a diverse range of touchscreen tasks tailored to their research needs.
The software deployed on the Samsung tablet is a Unity application developed with Unity Game Engine (Unity Technologies, 2024). Through Unity, we could easily develop the logic of the software and, using its tools for building Graphical User Interface (GUI), create the interface that best suits the experimenter’s needs. To communicate with the RPi and to be able to control the hardware modules, we implemented a socket communication system so the tablet can send commands to the RPi through a wireless network. RPi’s built-in GPIO4 and Picamera5 libraries were used for communication with the hardware. The software is developed as a state machine with main components working in their own evet loops. An overall view of the software components is shown in Figure 3.
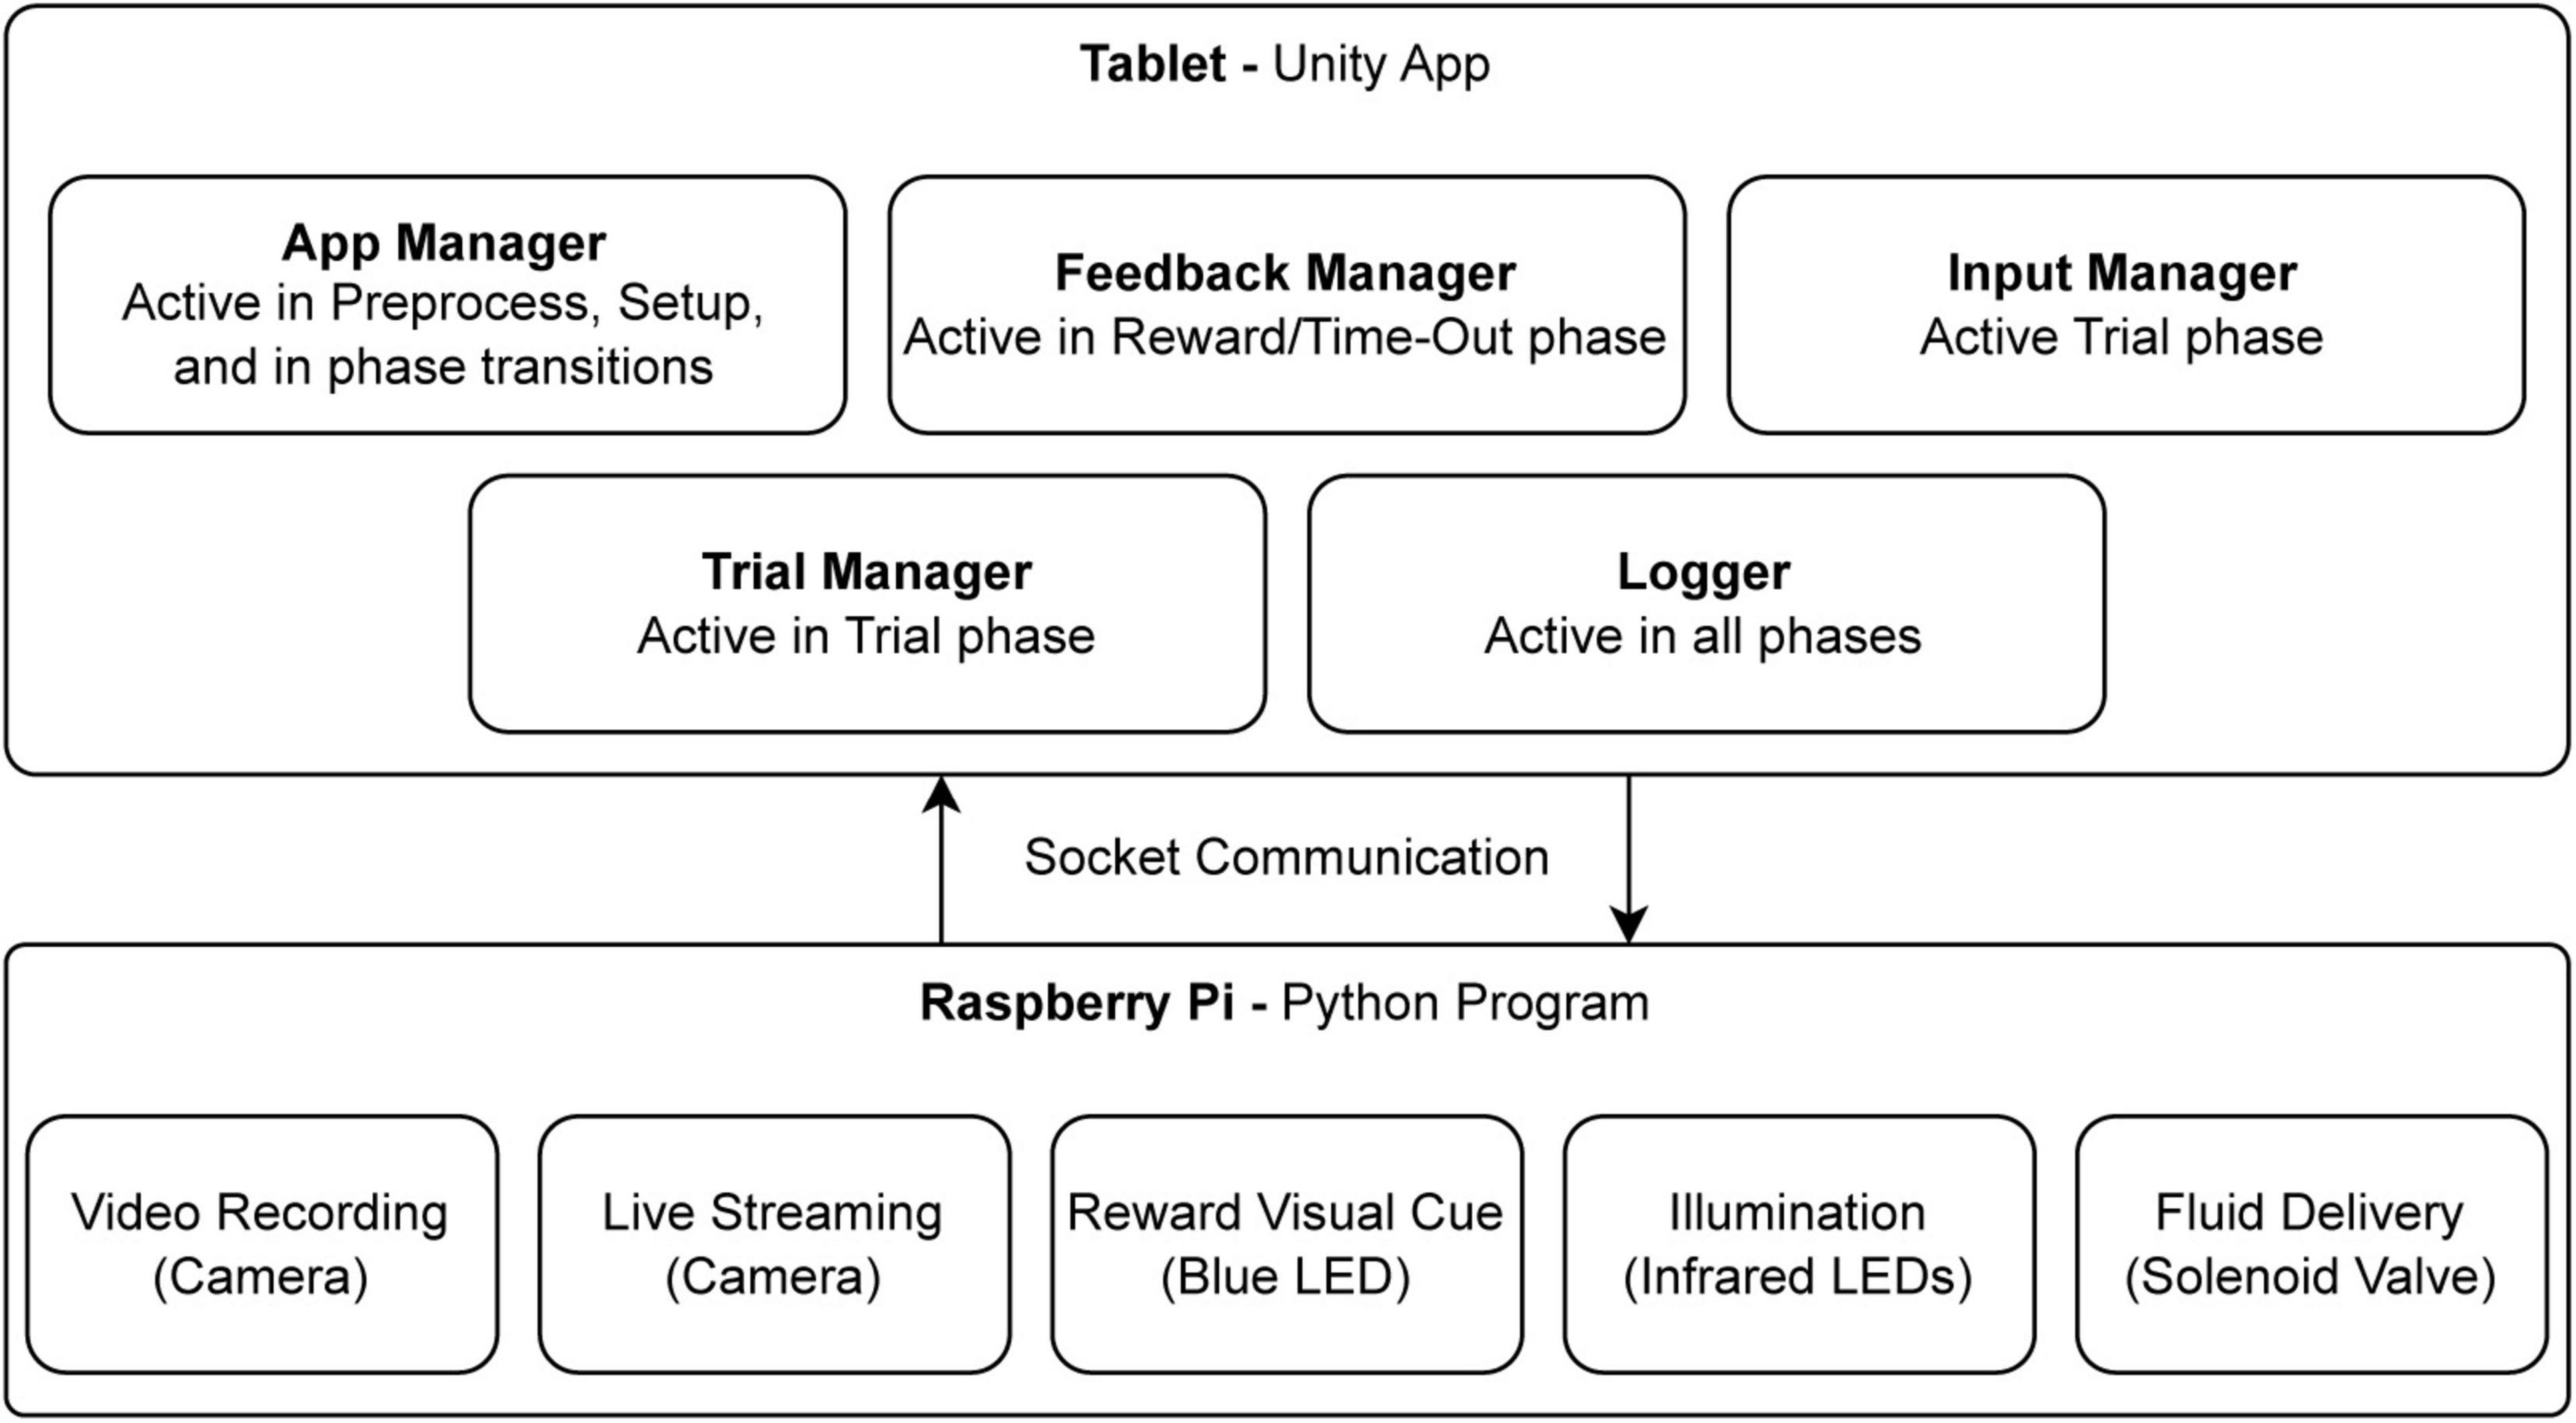
Figure 3. The main software and hardware components. The diagram illustrates the interaction between software components, running on a tablet via Unity, and hardware components controlled by a Python program on a Raspberry Pi. The Unity application comprises several modules, each operating in distinct event loops during specific trials phases: the App Manager (preprocessing, setup, and transitions), Feedback Manager (reward and time-out phases), Input Manager (trial phase), Trial Manager (trial control), and Logger (data recording across all phases). Communication between software modules and hardware is achieved through socket communication. The Raspberry Pi program manages video recording, live streaming, visual cues (blue LED for rewards), infrared illumination, and fluid delivery via a solenoid valve.
The software running on the RPi is a python program that hosts a socket server and accepts connections from the tablet running the Unity app. Through this socket communication, commands from the tablet are sent with minimum delay to control hardware components connected to the RPi. For example, when the socket server receives the command “reward,” it turns on the blue LED and opens the Solenoid Valve for a split second to deliver reward fluid.
Screenshots from the Unity app can be found in Figure 4. The source code for the software part of this project can be found on our GitHub page.

Figure 4. Screenshots of the software. (A) Main menu of the program, where the user gets to choose the configuration file (learning stage) for the experiment. Configuring a connection to the RPi controller is also established in this page; the user inputs the network address of the RPi and initiates the connection. (B) Screenshot of a 2-section visual discrimination task. (C) Screenshot of a 2-section location task during pre-training, where a blinking cue appears on the screen to signal the S+ location.
2.3 Experimental flowThe experiments performed with this software follow a general pattern. Each experiment starts with initial reward deliveries to give some satiation to the animals before the actual trials start. One can select multiple or no initial rewards. Then the program proceeds to execute the trials as defined by the user; they can be any kind of trial explainable by the options provided in XML configuration files.
To enhance engagement and ensure variety, object and cue placements during each trial are randomized using the System Random library in C#. This method pseudo-randomly shuffles indices representing positions, ensuring objects appear in different locations across trials. The random generator avoids using a fixed seed value to prevent the sessions from becoming repetitive. Additionally, a safeguard is implemented to limit repetitive placement patterns to no more than three consecutive trials. This measure minimizes the emergence of patterns that could inadvertently bias behavior while maintaining a balance between randomness and controlled variety across learning stages.
All the activities of the subject are recorded from this point, any interaction with trial objects that results in a feedback response, will be logged in a .CSV report file, accessible at the end of the experiment. Furthermore, the video recording will capture all the ongoing events within the experiment box and contains timestamps of the screen interactions along with their respective outcomes (time-out or rewarded), as well as trial number. The flow of the experiment can be seen more clearly in Figure 5.
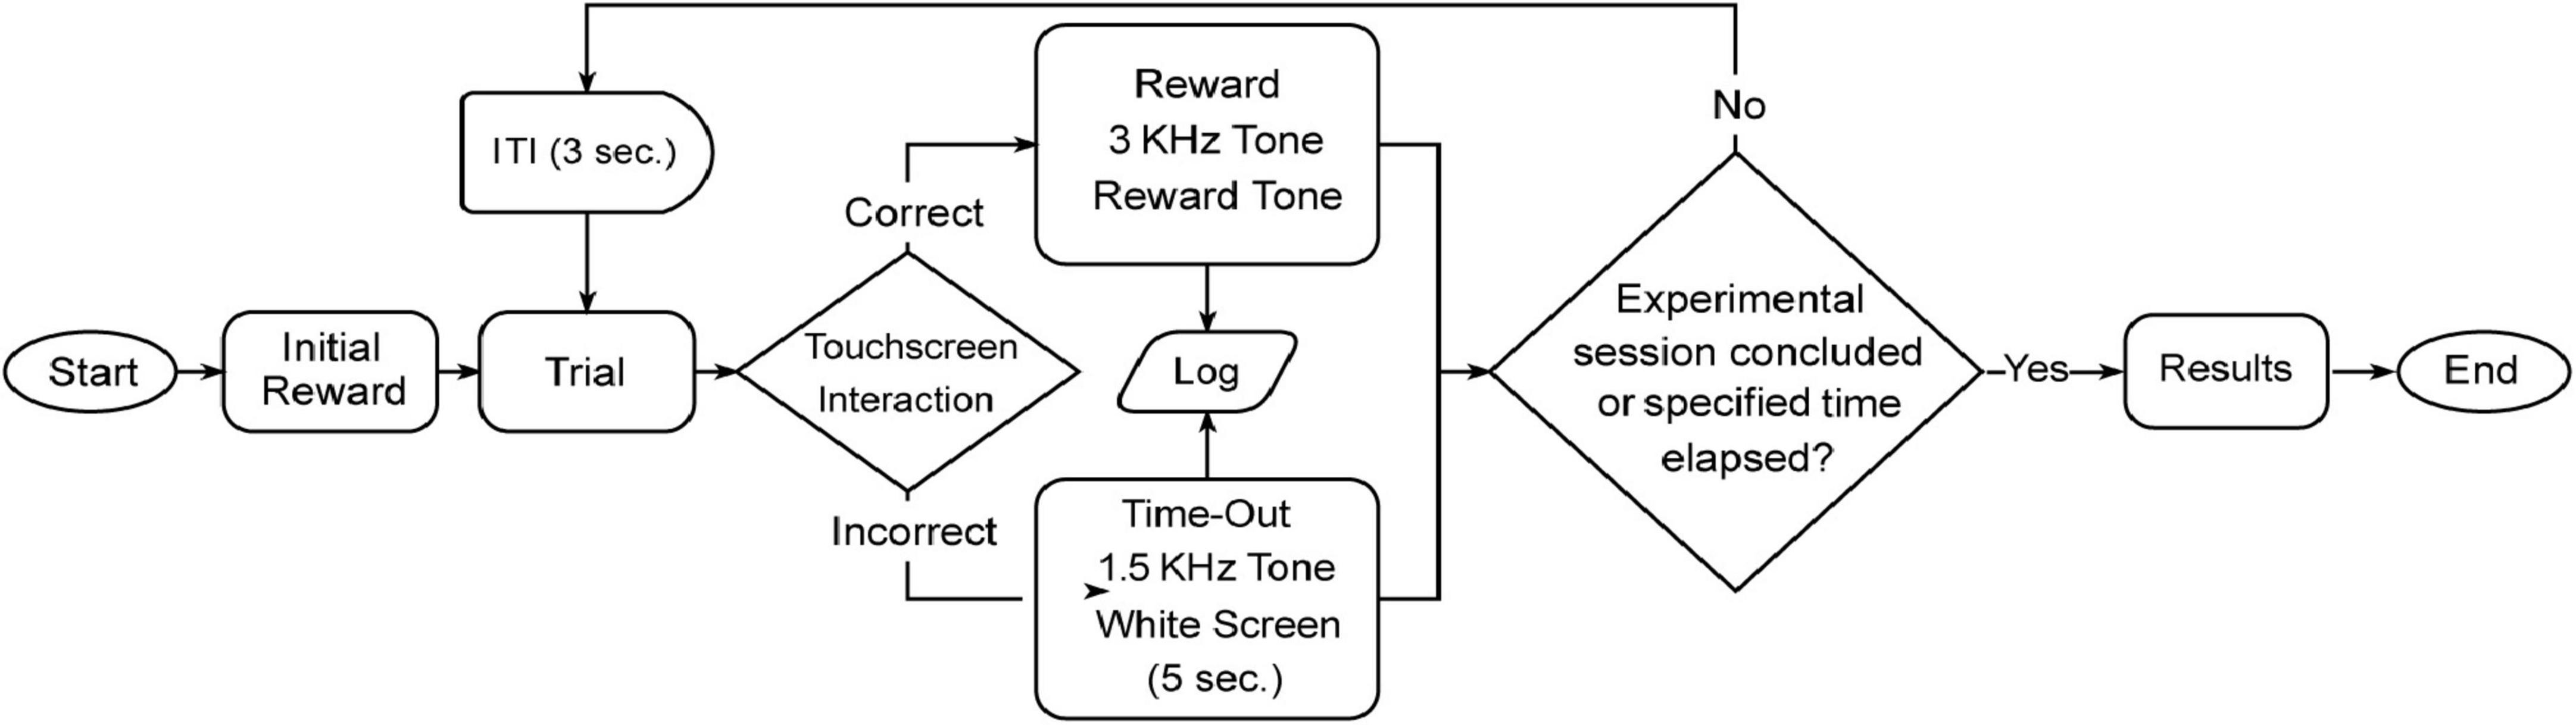
Figure 5. Overview of a typical experimental session. The flowchart depicts the sequence of events during an experimental session, starting from the initial reward to mark the beginning of the task for the animals. After an inter-trial interval (ITI) of 3 s, the mouse interacts with the touchscreen during the trial phase. Trial outcomes are determined by response accuracy: correct responses result in a reward paired with a 3 kHz tone, while incorrect responses trigger a time-out, signaled by a 1.5 kHz tone and a white screen displayed for 5 s. Each trial is logged, and the session continues until the predefined duration is reached or the experiment concludes. Upon completion, results are saved and displayed on the touchscreen, marking the end of the session.
2.4 SubjectsA total of 27 adult mice, bred in-house, were used in this study: 9 C57BL/6 mice (23–31 g, 6–8 months old, three males and six females) for the object reversal learning task, and 18 mice, comprising 9 C57BL/6 mice (26–31 g, 8–9 months old, four males and five females) and 9 AppNL−G−F knock-in mice (25–32 g, 8–10 months old, four males and five females) for the location-reversal task.
All animals were housed in groups of 2–4 individuals, in standard mouse cages. The room temperature was maintained at 24°C under a 12 h light/dark cycle with the lights on at 7:30 AM and free access to food and water before the beginning of the behavioral training. All procedures were in accordance with the guidelines established by the Canadian Council on Animal care and with the protocols approved by the Animal Welfare Committee of the University of Lethbridge.
Mice were water deprived throughout the duration of the behavioral training. During this period mice were given a daily ad libitum access to water for 30 min in their home cages 30 min after the last training session, and their weight was maintained to at least 85% of the baseline. All mice were carefully monitored daily to ensure their well-being. During the water restriction period, which spanned the duration of the experiment, mice were weighed twice daily, and no signs of distress were observed in any of the mice.
2.4.1 Alzheimer’s disease mouse modelAlzheimer’s Disease (AD) is the most prevalent form of dementia, and it is characterized by the progressive aggregation of amyloid-β (Aβ) and formation of neurofibrillary tangles, which lead to memory loss, cognitive impairments, and overall decline in quality of life (Braak and Braak, 1991; Ettcheto et al., 2018; Folch et al., 2018; Mehla et al., 2019; McAllister et al., 2020). Central to AD pathogenesis is the spread of Aβ, resulting in neuroinflammation, plaque deposition, and tau hyperphosphorylation, which eventually causes brain atrophy (Harper and Lansbury, 1997; Bloom, 2014; Walker et al., 2018).
The AppNL−G−F mouse model used in this study, incorporates humanized murine Aβ sequences with three specific mutations: Swedish (NL), Beyreuther/Iberian (F), and Arctic (G) (Nilsson et al., 2014; Saito et al., 2014). Unlike other App transgenic lines, the AppNL−G−F model avoids artifacts introduced by App overexpression by using a knock-in approach to express App at wild-type levels, thus ensuring that any observed pathologies are a direct result of pathogenic Aβ rather than App overexpression (Guardia-Laguarta et al., 2010; Shin et al., 2010; Saito et al., 2014). This mouse model expresses App with familial Alzheimer’s disease-associated mutations which promote Aβ toxicity, an increase in total Aβ production, the Aβ42/Aβ40 ratio, as well as promoting Aβ aggregation (Saito et al., 2014). In addition, this model reproduces several pathologies associated with AD including amyloid plaques, synaptic loss, and neuroinflammation - specifically microgliosis and astrocytosis around plaques - while also displaying age-associated cognitive impairments that can be observed as early as 6 months of age in some behavioral paradigms (Saito et al., 2014; Latif-Hernandez et al., 2019, 2020; Upîte et al., 2020; Lacoursiere et al., 2022; Mehla et al., 2023).
2.5 Experimental design 2.5.1 Visual discriminating serial-reversal taskThis task is based on the classic touchscreen pairwise discrimination task described in previous studies (Horner et al., 2013; Mar et al., 2013), with some slight modifications. Briefly, in this task mice need to choose between two images, or virtual objects, appearing on each side of the screen, by touching the surface of the touchscreen where the virtual objects are displayed. Before the pairwise discrimination takes place, the animals need to undergo some form of pretraining, where they learn the basic rules of the task in a progressive stepwise manner. The pre-training sessions were divided into four different stages: (1) Habituation, in which mice are introduced to the touchscreen chamber for 10 and 30 min, for two consecutive days, followed by two daily sessions of 60 min each, where the screen is OFF and the reward is delivered in 10 s intervals; (2) Image Presentation, where the rewarded (S+) image is introduced and paired with a tone and the reward delivery in 10 s intervals, for a total of 60 min; (3) Touchscreen Interaction, where the animals must learn to touch the area on the screen where the object appears in order to trigger the release of the reward for a total of 30 trials or 60 min duration; (4) Time-Out, where mice are introduced to a small time-out on commission of an error, if the screen is touched anywhere besides where the S+ image appears, with the passing criteria defined as 80% correct responses or 24 out of 30 trials for two consecutive sessions. Finally, in the Acquisition stage, the S- image is introduced, and mice must make a choice between the S+ and S- images which can appear on either the left or right side of the screen in a pseudo-random manner. After completing this stage, the reward contingencies are then reversed, and the S+ becomes the new S- and vice-versa. This cycle is then repeated five times, with an upper limit of 60 sessions per reversal.
To minimize the total time required to complete the task, mice were typically trained 2–3 times per day (once in the morning and 1–2 times in the afternoon). If a mouse demonstrated slower progress or lower motivation during the second session of the day, we limited training to 2 sessions to avoid overburdening the animals. Most mice, however, performed well with 3 sessions per day, which ensured consistent task exposure while maintaining welfare standards.
2.5.2 Location discrimination serial-reversal taskThe location discrimination reversal task we developed differs from the one used in previous studies (Kim et al., 2015; Saifullah et al., 2020), in the sense that it essentially functions as the mirror image of the visual discrimination task. Instead of using a two-phase task with low and high degrees of separation between stimuli comprised of bright squares, we decided to take advantage of the animals’ tendency to persevere after a correct choice. In other words, instead of having several within-session location-reversals, we opted for having a reversal-learning scheme across sessions, where we allowed mice to essentially become “sided” and then once the passing criteria is reached (> 80% correct responses), we reverse the contingency, making the previously unrewarded side of the screen (S-), the new S+. In this task we also used the same images used in the visual discrimination task, but now they serve as distractors which mice need to ignore and focus only on the side of the screen that correspond to the S+. The pretraining sessions followed a similar structure to the the visual discrimination task, with a few notable differences.
The task starts with the (1) Habituation stage, which follows the same parameters described in the visual discrimination task. In the (2) Cue Presentation stage, a blinking cue (1x per second) appears on either the left or right side of the screen (depending on the starting location determined a priori by the experimenter) signaling the S+ location. The following pre-training stages – Touchscreen Interaction (3) and Time-Out (4) – follow the exact same criteria outlined in the previous task. In the 4th and the last stage of pre-training (Pre-acquisition), the blinking cue is eliminated, and we introduce two distractor images, the same ones used in the visual discrimination task, but here, only one of them can appear in a pseudo-random fashion, on each trial. The animals must ignore the distractor image and continue to touch the same side of the screen to obtain the reward. Finally, in the Acquisition stage, both distractor images are presented on either side of the screen in a pseudo-random manner across trials. The objective is for the animals to consistently select the S+ side of the screen. The contingencies are then reversed five times, with the S+ and S- switching between the right and left side of the screen at each reversal, with the passing criteria remaining at 80% correct responses.
Mice were trained twice daily, once in the morning and once in the afternoon, on a consistent schedule that supported task acquisition while sustaining their motivation and overall condition.
2.6 Data analysisBehavioral performance was monitored through post-session video analysis. The data from each session were automatically saved as .CSV files, organized in Microsoft Excel (Office 2021), analyzed using GraphPad Prism (GraphPad Software Inc. Version 10.2.3), and the figures prepared using Adobe Illustrator (Adobe Systems Inc. Version 27.8.1).
Statistical analyses were conducted using ANOVAs, with a significance threshold set at p < 0.05. Paired t-tests were used to compare error types within each reversal of the visual discrimination serial-reversal task. For the analysis of error types in the first reversal of the location discrimination task, a mixed-effects model (REML) was employed, with Fisher’s LSD test used for post hoc comparisons.
3 Results 3.1 Visual discrimination taskThe visual discrimination serial-reversal task proved to be a demanding cognitive challenge for C57 mice, with completion time showing notable variability across subjects. On average, mice required M = 64.77 days (SD = 13.30) to achieve task proficiency, with completion times ranging from 48 to 89 days.
3.1.1 Average number of sessionsThe number of sessions required to complete the experiment varied across learning stages (Figure 6A), with means and standard deviations as follows: Acquisition (Acq.) phase had M = 21.44 (SD = 10.13), while Reversal 1 (R1) increased to M = 40.44 (SD = 10.30), with subsequent learning stages (R2 through R5) showing a gradual decrease in session counts. Specifically, R2 had an M = 32.11 (SD = 7.39), R3 an M = 24.89 (SD = 11.24), R4 an M = 22.67 (SD = 9.08), and R5 an M = 20.22 (SD = 8.45).
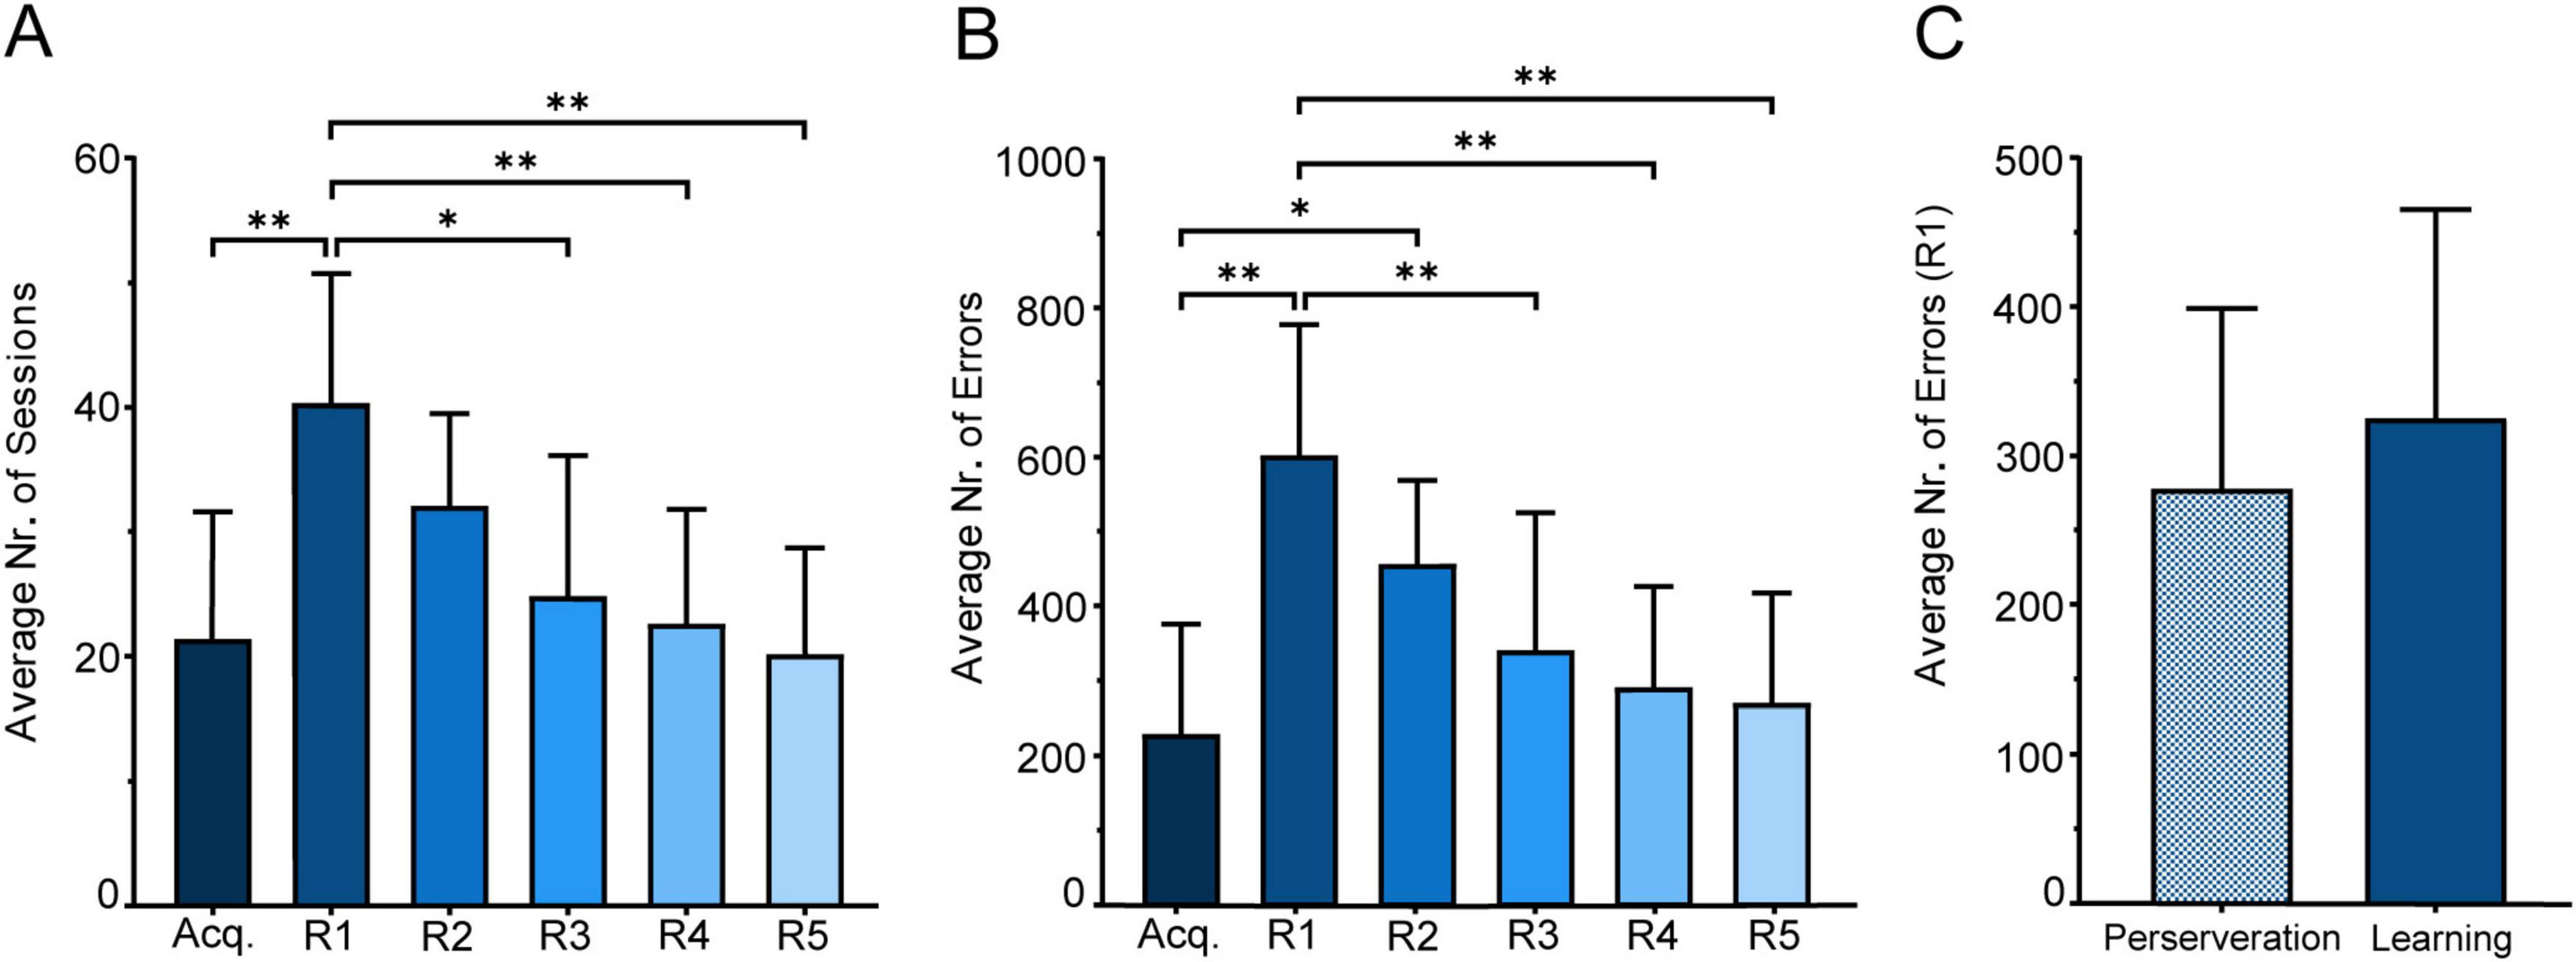
Figure 6. Performance in the visual discrimination serial-reversal task. (A) Average number of sessions across all learning stages. (B) Average number of errors across all learning stages. (C) Comparison between perseverance errors (sessions with ≤ 45% correct responses) and learning errors (errors in sessions with performance above 45%) in R1. Mean (M) ± SD in each learning stage. Statistical significance indicated as *p < 0.05, **p < 0.001.
In order to assess performance differences across stages, a Repeated Measures One-Way ANOVA with Geisser-Greenhouse correction (ε = 0.6690), revealed significant variability among the session means, F(3.345, 26.76) = 7.942, p < 0.001. Tukey’s multiple comparison test further identified significant differences between the Acquisition phase (Acq) and the first Reversal stage (R1), p = 0.008, and between R1 and R3 (p = 0.021), R4 (p = 0.007), and R5 (p = .008). All other comparisons between stages did not show significant differences (p > 0.05).
3.1.2 Average number of errorsWhen examining the average number of errors across the different learning stages (Figure 6B), a clear trend of decreasing errors also emerged: Acq. (M = 230, SD = 145.2), followed by a peak at R1 (M = 603.6, SD = 174), with subsequent reductions seen in R2 (M = 456.8, SD = 111), R3 (M = 341.7, SD = 183.2), R4 (M = 291.7, SD = 134.1), and R5 (M = 270.8, SD = 146.3). A Repeated Measures ANOVA, conducted without assuming sphericity (ε = 0.6932), showed significant differences in the average number of errors across learning stages, F(3.466, 27.73) = 10.49, p < 0.0001; Post hoc comparisons identified significant variations between Acq. and R1 (p = 0.001), and less pronounced yet significant differences between R1 and R3 (p = 0.008), R1 and R4 (p = 0.006), and R1 and R5 (p = 0.007). All other comparisons did not yield any significant differences between errors across different learning stages (p > 0.05).
3.1.3 Type of errorWe decided to conduct a focused analysis on errors during sessions where mice followed the response rule from the previous learning stage. Reversal 1 (R1) was selected as the primary stage for this examination due to its high incidence of response errors (Figure 6C).
Our approach to classifying perseverative versus learning errors was based on the methodology of Dickson et al. (2013), who used a 40% correct response cutoff to distinguish these error types. Errors in sessions with ≤ 40% correct responses were categorized as perseverative, reflecting adherence to the prior learning stage’s response rule, while errors in sessions with performance between 41 and 80% were classified as learning errors (Dickson et al., 2013).
However, in our study, behavior consistent with perseveration was observed even when performance exceeded 40%. This observation, derived from tracking behavioral performance across sessions, suggested that the 40% threshold underestimated perseverative behavior in our task. To address this, we established a cutoff of 45% correct responses to categorize the errors: those occurring in sessions with ≤ 45% correct responses were classified as perseverance errors, and errors in sessions with performance above 45% (46–100%) were classified as learning errors. We also extended the classification of learning errors to include sessions with performance above 80%, as these sessions often reflected behaviors consistent with gradual acquisition and refinement of the new response rule. Additionally, this classification accounts for errors made in sessions where mice adopted a “win-stay, lose-switch” strategy, which typically occur around 50% correct responses.
A paired t-test revealed no significant difference between perseveration errors (M = 277.9, SD = 120.9) and learning errors (M = 325.7, SD = 139.5) in the first reversal stage, despite a slight increase in learning errors, as observed in Figure 6C [t(8) = 0.7368, p = 0.4823].
A similar pattern was observed across subsequent reversals (R2–R5), although the total number of errors decreased compared to R1. In R2, a paired t-test revealed significantly fewer perseveration errors (M = 192.7, SD = 36.35) than learning errors [M = 264.1, SD = 87.91; t(8) = 2.821, p = 0.0225]. For R3, no significant difference was found between the two error types [perseveration: M = 152.2, SD = 144.0; learning: M = 189.4, SD = 62.19; t(8) = 0.8927, p = 0.3981]. In R4, perseveration (M = 99.00, SD = 67.92) remained significantly lower than learning errors [M = 192.7, SD = 97.46; t(8) = 2.777, p = 0.0240]. A similar result was observed in R5, with perseveration (M = 88.11, SD = 98.82) significantly lower than learning errors [M = 182.7, SD = 76.18; t(8) = 2.875, p = 0.0207].
3.2 Location discrimination taskAll mice used in this study were able to learn the location discrimination serial-reversal task. This paradigm demonstrated faster acquisition and completion times compared to the visual discrimination task, though performance differences were observed between C57 and AppNL−G−Fmice. The C57 mice completed the task efficiently, averaging M = 8.5 days (SD = 0.52), with individual completion times ranging from 8 to 9 days. In contrast, AppNL−G−F mice required more time (M = 10.22 days, SD = 1.64) and displayed greater variability, with completion times ranging from 8 to 12 days.
3.2.1 Average number of sessionsEven though there were individual as well as group differences in the amount of time necessary for the animals to complete the task, the general tendency was to converge toward the minimum number of sessions required to pass each stage - two consecutive sessions as seen in Figure 7A. A Two-Way Repeated Measures ANOVA indicated a significant interaction between Learning Stage and Genotype on the number of sessions to reach the passing criteria (≥ 80% correct responses in two consecutive sessions), F(5, 80) = 4.935, p < 0.001. Additionally, we found a significant main effect of Learning Stage, [F(2.994, 47.90) = 50.78, p < 0.001; ε = 0.5988], and Genotype [F(1, 16) = 7.806, p = 0.013]. No significant variability was attributed to individual differences among subjects, [F(16, 80) = 1.218, p = 0.273].
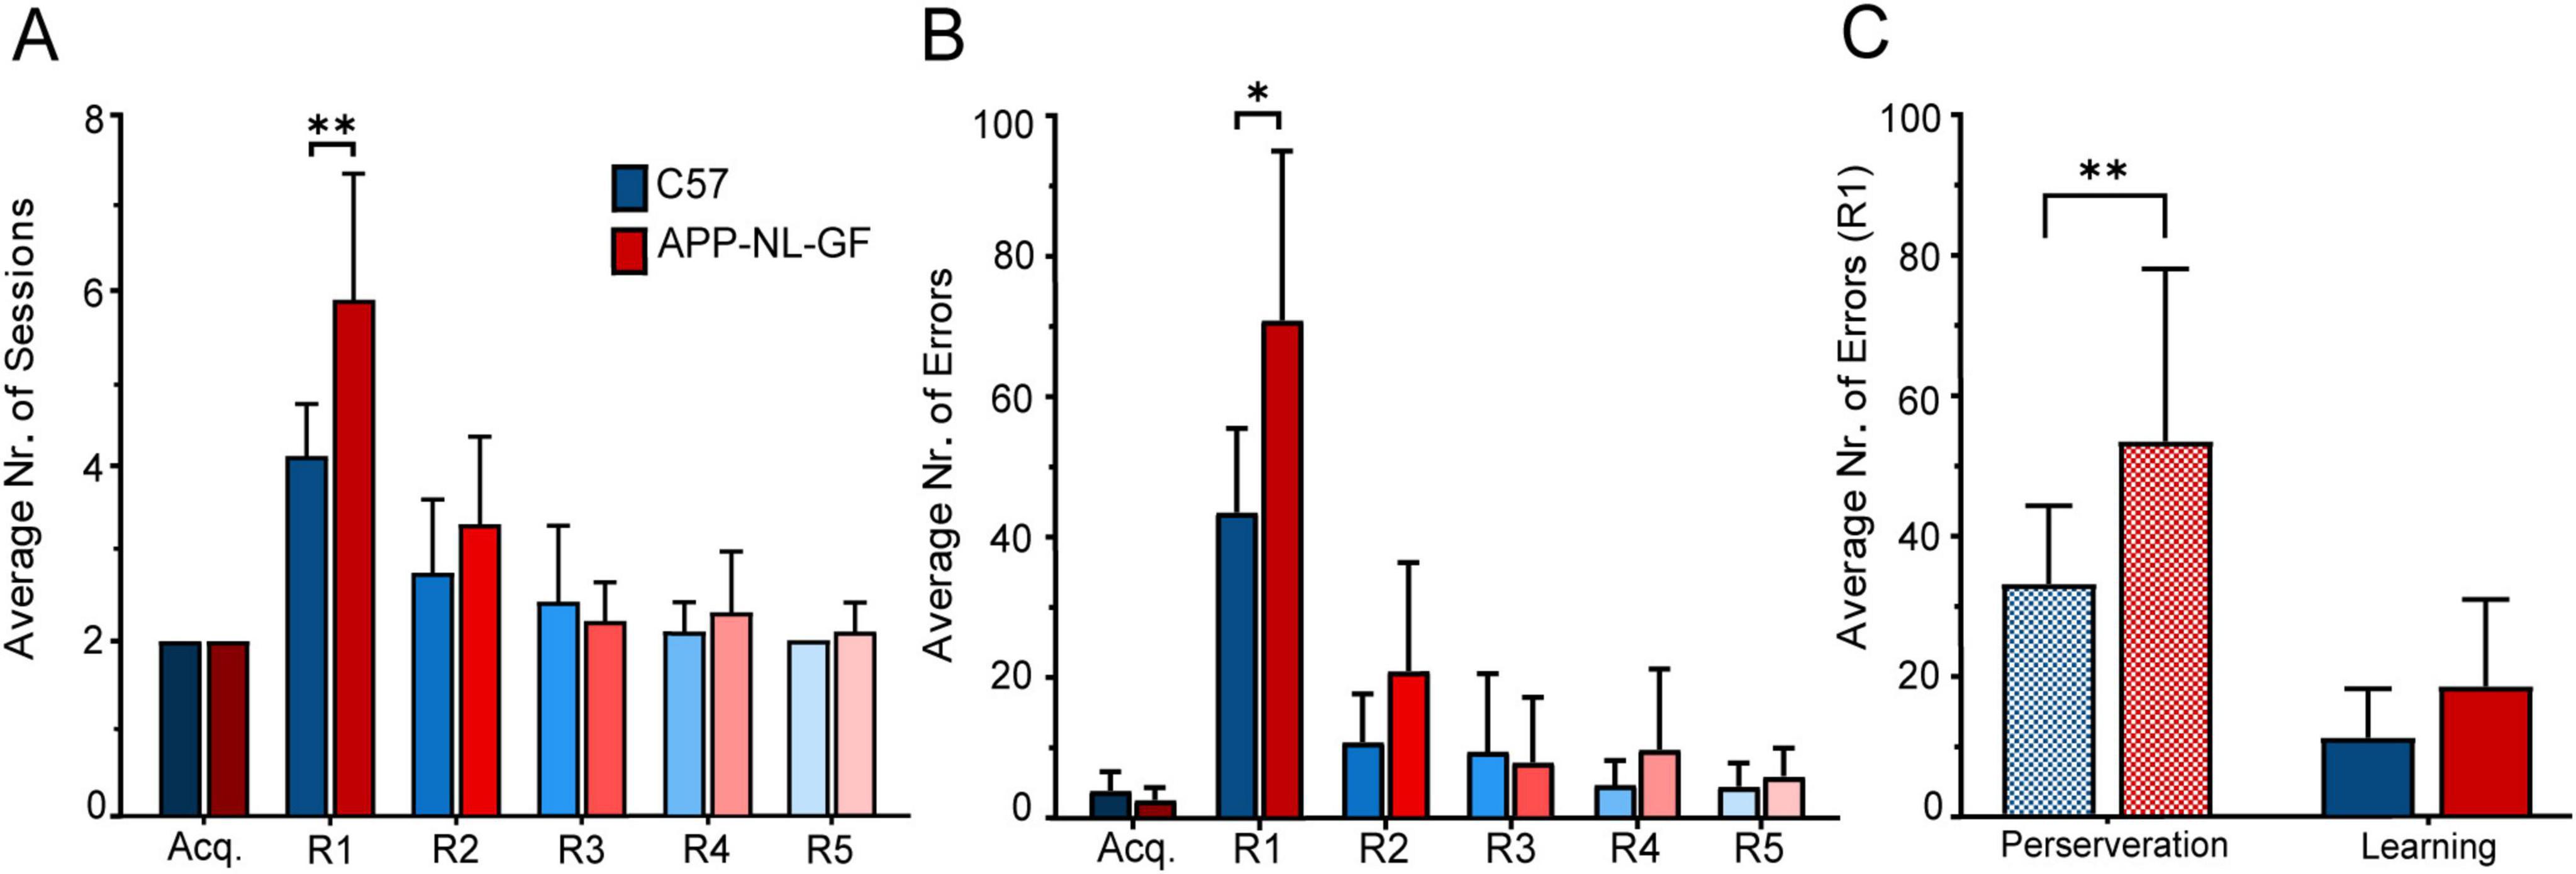
Figure 7. Performance in the location discrimination serial-reversal task. (A) Average number of sessions across all learning stages. (B) Average number of errors across all learning stages. (C) Comparison of perseverance errors and learning errors in R1. Mean (M) ± SD in each learning stage. Statistical significance indicated as *p < 0.05, **p < 0.001.
Post hoc comparisons revealed a significant difference between C57 and AppNL−G−Fmice in the first Reversal stage (R1), with C57 mice showing a mean (M) of 4.11 sessions (Standard Deviation, SD = 0.60) compared to AppNL−G−F mice (M = 5.88, SD = 1.453), p = 0.006. No significant differences were observed in other stages, including the Acquisition phase (Acq) where both C57 and APP mice completed the task with M = 2 sessions (SD = 0). Similarly, no significant differences were found in subsequent reversal stages: R2 (C57: M = 2.77, SD = 0.83; APP: M = 3.33, SD = 1), R3 (C57: M = 2.44, SD = 0.88; APP: M = 2.22, SD = 0.44), R4 (C57: M = 2.11, SD = 0.33; APP: M = 2.33, SD = 0.70), and R5 (C57: M = 2, SD = 0; APP: M = 2.11, SD = 0.33), all yielding p > 0.05.
Within-group analysis revealed distinct patterns of significant differences in the average number of sessions spent across learning stages for both C57 and AppNL−G−Fmice. For C57 mice, comparisons between R1 and all other stages, except R2, showed significant differences: R1 vs Acq. (p < 0.001), R1 vs. R3 (p = 0.017), R1 vs. R4 (p = 0.001), and R1 vs. R5 (p < 0.001). In contrast, the comparison between R1 and R2 only approached significance (p = 0.055), suggesting a less pronounced difference between these reversal stages.
In the AppNL−G−Fgroup, R1 showed significant differences when compared to all other learning stages, highlighting a consistent pattern: R1 vs. Acq. (p < 0.001), R1 vs. R2 (p = 0.008), R1 vs. R3 (p < 0.001), R1 vs. R4 (p = 0.001), and R1 vs. R5 (p = 0.001). Additionally, statistical analysis also identified significant differences between R2 and Acq. (p = 0.032), and between R2 and R5 (p = 0.043).
3.2.2 Average number of errorsA similar trend was observed in terms of the average number of errors between C57 and AppNL−G−Fmice across the different learning stages (Figure 7B). A Two-way Repeated Measures ANOVA highlighted significant effects for the interaction between Learning Stage and Genotype, [F(5, 80) = 5.405, p < .001]. Significant main effects were observed for Learning Stage, [F(2.309, 36.95) = 75.72, p < .001; ε = 0.461], and for Genotype, [F(1, 16) = 7.037, p = 0.017]. Additionally, variability attributed to individual mice was also significant, [F(16, 80) = 1.803, p = 0.045]. The only statistically significant difference between groups, was once again observed in R1 (C57: M = 43.77, SD = 11.98; APP: M = 71.33, SD = 24.28; p = 0.010).
Conversely, the comparisons revealed no significant differences in the Acquisition stage (C57: M = 3.88, SD = 2.47; APP: M = 2.55, SD = 1.74, p = 0.206) R2 (C57: M = 10.88, SD = 6.86; APP: M = 21.11, SD = 15.22, p = 0.093) R3 (C57: M = 9.55, SD = 10.86; APP: M = 8, SD = 9.02, p = 0.746) R4 (C57: M = 4.66, SD = 3.27; APP: M = 9.77, SD = 11.23, p = 0.221) and R5 (C57: M = 4.44, SD = 3.12; APP: M = 5.88, SD = 3.75, p = 0.389).
Within group comparisons showed once again, differences between R1 and every other learning stage for control mice (R1 vs. Acq.: p < 0.001; R1 vs. R2: p < 0.001; R1 vs. R3: p < 0.001; R1 vs. R4: p < 0.001; R1 vs. R5: p < 0.001), whereas for AppNL−G−Fmice differences were found between Acq. and R2 (p = 0.031), and R1 versus the remaining learning stages (R1 vs. Acq.: p < 0.001; R1 vs. R2: p = 0.001; R1 vs. R3: p < 0.001; R1 vs. R4: p = 0.002; R1 vs. R5: p < 0.001).
3.2.3 Type of errorTo further investigate error types, we focused our analysis on R1 (Figure 7C), where the incidence of errors was highest. Subsequent reversals were excluded from analysis, as perseverative behavior was limited to just three AppNL−G−F mice, each displaying it in a single session during R2, with one of these mice also demonstrating perseveration in a single session during R3.
A Mixed-Effects Model (REML) revealed no significant interaction between Error Type and Genotype [F(1, 32) = 1.667, p = 0.206]. However, significant main effects were observed for both Error Type [F(1, 32) = 31.14, p < 0.001] and individual mice [F(1, 32) = 7.362, p = 0.011], indicating that variability across individual mice contributed significantly to the model. Post hoc analysis using Fisher’s LSD revealed a statistically significant difference in perseverative errors between C57 and AppNL−G−F groups (C57: M = 32.78, SD = 11.13; APP: M = 53.11, SD = 24.55; p = 0.008), but not in learning errors (C57: M = 11.00, SD = 6.946; APP: M = 18.22, SD = 12.35; p = 0.322). Statistically significant within-group differences in error type were also observed in both groups (C57: p = 0.005; APP: p < 0.001).
4 Discussion 4.1 Behavioral tasksIn the visual discrimination task, the C57BL/6 mice displayed a trend in the average number of errors across learning stages, which was also reflected in the average number of sessions, revealing a progressive improvement in performance over time. The lack of significant differences between R1 and R2, and among subsequent reversal stages, suggests that despite the initial struggle mice gradually adapt to the new reward contingencies. And although there was a slight increase in the average number of learning errors in comparison with perseveration errors, the difference was not statistically significant.
The AppNL−G−F mice were not included in the visual discrimination serial-reversal task due to its inherent difficulty, even for C57 mice. Tasks requiring multiple reversals are cognitively demanding, as they rely heavily on cognitive flexibility. Given the progressive cognitive decline in AppNL−G−F mice by 8–10 months, we anticipated that the pathology would severely interfere with task completion (Mehla et al., 2019). Touchscreen paradigms are highly sensitive to subtle cognitive impairments, as early-stage AppNL−G−F mice (4–6 months) have been shown to complete simple visual discrimination tasks but perform poorly on more demanding paired-associate learning and location-based tasks. Indeed, Van den Broeck et al. (2019) reported that in APPPS1-21 mice, cognitive flexibility impairments emerge at early stages of pathology, with transgenic animals requiring more sessions than controls to complete a single reversal (Van den Broeck et al., 2019). Given these challenges, we did not expect AppNL−G−F mice to consistently complete tasks with 5 reversals, as most would likely fail beyond the first reversal.
On the other hand, in the location discrimination serial-reversal task, despite the considerable gap in terms of both the average number of sessions and average number of errors across the different learning stages, both wild-type and AppNL−G−Fmice showed a clear progression toward asymptotic performance. Mirroring the performance of the C57 mice in the visual discrimination task, both groups experienced significant challenges when first adjusting to reversed reward contingencies, reflecting the difficulty in overriding previously learned associations.
Both C57 and AppNL−G−F mice revealed significant differences in terms of both average number of sessions and errors, particularly in R1. This suggests a stark contrast in cognitive flexibility between genotypes and better adaptability, with C57 mice adjusting more quickly to the reversals and making fewer mistakes compared to the AppNL−G−F cohort. Furthermore, when examining the specific type of errors (perseverative versus learning errors), significant differences emerged between the genotypes, with AppNL−G−F mice generally committing more perseverative errors. These findings underscore potential genotype-specific challenges in shifting strategies after rule changes, and overall cognitive flexibility, which could reflect broader implications in neurological or cognitive research, particularly in understanding conditions such as Alzheimer’s disease (Braak and Braak, 1991; Allegri et al., 2000; Llinas and Moreno, 2017; Walker et al., 2018; Guarino et al., 2019; McAllister et al., 2020; Knopman et al., 2021; Sasaguri et al., 2022).
The accessibility of the location discrimination task was essential for enabling AppNL−G−F mice to perform a serial-reversal learning paradigm, given the amyloid burden, gliosis, and cholinergic deficits reported in 8–10 months-old animals (Shah et al., 2018; Latif-Hernandez et al., 2019, 2020; Mehla et al., 2019). These cognitive impairments align with the findings of Sutoko et al. (2021), who utilized machine learning methods to identify preclinical AD risk in AppNL−G−F mice, highlighting significant behavioral changes within the 8–12 months age window, when cognitive symptoms become increasingly apparent (Sutoko et al., 2021). These impairments reflect the early vulnerability of hippocampal circuits, which are central to the location-discrimination task (Ettcheto et al., 2018; McAllister et al., 2020; Knopman et al., 2021)
The discrepancies observed in these tasks might stem from the extended time needed to establish and reverse the association between specific visual inputs, such as virtual objects or images, and a reward. Although the number of sessions required for the animals to learn the new reward contingency in the visual discrimination task decreased over time, perseverative behavior persisted until the fifth reversal. In contrast, in the location discrimination task, such behavior was mostly observed in R1, and rarely displayed in subsequent reversals.. By the fourth reversal, almost all mice had reached a performance asymptote, typically requiring just two sessions to meet the passing criterion.
Our findings suggest that further research is needed to fully understand the behavioral dynamics between these two tasks. Our version of the location discrimination task, differing from those reported in previous studies by employing “across session” instead of “within-session” reversals, presents unique challenges in terms of overwriting the previously acquired rules. This is not only due to the considerable number of individual trials required to meet the passing criterion, which strengthens the association between the rules and outcomes, but also due to the presence of distractor images that could influence decision-making. Interestingly, animals in the location discrimination task tended to ignore the visual cues and consistently choose a specific side, suggesting that in this context, visual stimuli do not significantly impact their behavior.
One possible explanation for this behavior is the evolutionary bias of rodents toward spatial strategies, which are vital for survival behaviors like foraging, burrowing, and predator avoidance, using landmarks and shortcuts to minimize predation risks (Shettleworth, 2009; Wang et al., 2021; Khalil, 2024; Lai et al., 2024). This evolutionary bias seems to reflect the rodent brain’s specialization for spatial processing, a capability that is further enhanced by repeated exposure to spatial tasks. The location discrimination task may engage brain regions involved in spatial navigation, such as the hippocampal formation and cortical areas including the entorhinal and retrosplenial co
留言 (0)