
記住我
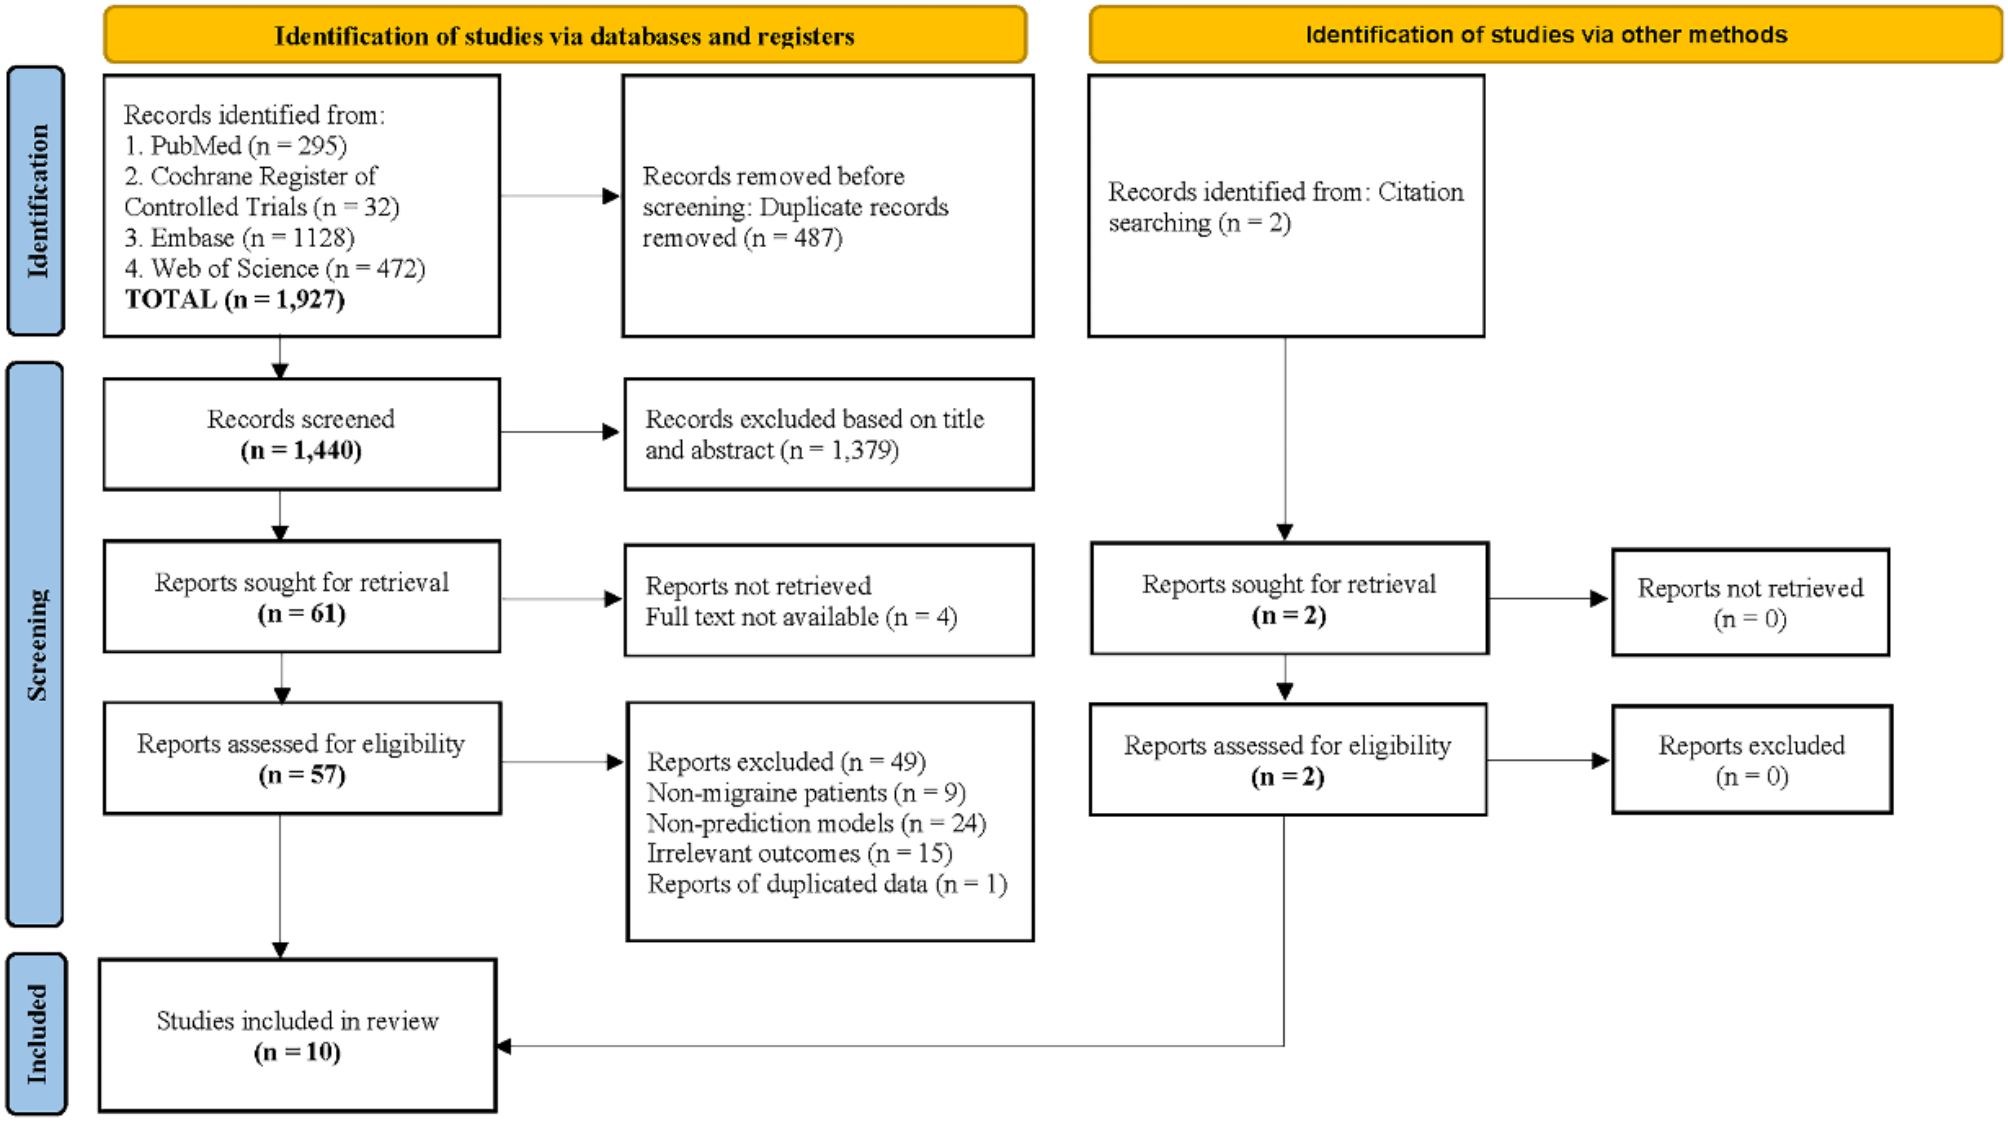

Figure 1 shows the Preferred Reporting Items for Systematic reviews and Meta-Analyses (PRISMA) 2020 flowchart depicting the comprehensive search process and results [36]. The initial search identified 1,927 indexed records. After removing 487 duplicates across all databases, 1,440 titles and abstracts were screened for eligibility. Of these, 61 studies underwent full-text screening. During this process, four studies were excluded due to the unavailability of full texts. Additionally, nine studies were excluded because they did not align with the target population of the review, twenty-four studies were excluded for failing to develop prediction models, fifteen studies were excluded due to irrelevant outcomes, and one study was excluded as duplicated data. A manual search of references and citations resulted in the inclusion of two additional articles. Ultimately, ten studies were included in this review.
Fig. 1
Flow diagram of the literature screening process and results
Study characteristicsTable 1 summarizes the characteristics of ten studies published between 2019 and 2024, focusing on the application of machine learning methods to migraine treatment and prediction. Six studies focused on patients with migraine without aura (MwoA) [12, 14, 23, 37,38,39], one study targeted both MwoA and migraine with aura (MwA) [40], and one study addressed chronic migraine (CM) as well as MwoA and MwA [24]. Additionally, two studies included unspecified migraine types [16, 25]. The sample sizes ranged from 41 to 712 participants, with varied study durations between 4 and 48 weeks.
Table 1 Main characteristics and results of the included studiesThe machine learning models employed in the studies were diverse, indicating a broad exploration of potential predictive algorithms. Four studies applied SVM [25, 37,38,39], while two used support vector regression (SVR) [14, 23]. RF were utilized in two studies [16, 24], and linear SVM appeared in one study [12]. A broader approach was evident in the study by including LR, decision trees (DT), and multilayer perceptron (MLP) [25].
Treatment interventions also varied across the included studies. Six studies implemented pharmacological treatments, including nonsteroidal anti-inflammatory drugs (NSAIDs), sumatriptan, and anti-calcitonin gene related peptide (CGRP) monoclonal antibodies [16, 24, 25, 37, 38, 40]. Three studies investigated acupuncture as an intervention [12, 14, 39], while one study employed transcutaneous auricular vagus nerve stimulation (taVNS) [23]. Outcome measures typically assessed treatment efficacy in terms of symptom improvement, such as reductions in Visual Analog Scale (VAS) score [16, 23, 25, 37, 38] or decrease in the number of migraine days [12, 39].
Included predictors in prediction modelsThe details of the predictive factors and the rationale behind the selection of predictors used in the included studies are summarized in Supplementary Table S1. Three studies explicitly utilized clinical data as predictive factors. One study specifically mentioned using monthly migraine days (MMDs), monthly headache day (MHD), and headache impact test (HIT-6) to predict treatment efficacy [24]. The second study provided a description, considering disease duration, VAS, frequency, Generalized Anxiety Disorder-7 item, Patient Health Questionnaire-9 item, and Pittsburgh Sleep Quality Index as predictive factors [25]. The third study combined clinical data with rs-fMRI features of amygdala-specific functional connectivity differences, but did not detail the specific clinical features employed [37].
Neuroimaging modalities, including rs-fMRI, sMRI, and DTI, were also commonly used. Five studies applied rs-fMRI [14, 16, 23, 37, 38]. These studies identified differential brain regions by comparing rs-fMRI metrics between migraine patients and healthy controls, such as causal connectivity, amplitude of low frequency fluctuations (ALFF), and functional connectivity, and used these features to construct predictive models. Notably, two studies used ALFF or percent amplitude of fluctuation of the insula as a feature [14, 16]. Three studies employed sMRI, identifying brain regions with gray matter volume differences between migraine patients and healthy controls as features for predictive modeling [16, 39, 40]. Among these, two studies used gray matter volume differences in the precuneus (L) and superior frontal gyrus (R) as features [16, 39]. Additionally, one study applied DTI, using white matter microstructural features from the external capsule and fiber pathways of the anterior cingulate cortex (ACC)/medial prefrontal cortex (mPFC) to build the prediction model [12].
Models validationThe potential for a prediction to apply to individuals outside the model development group can be assessed by comparing the prediction accuracy between internal cross-validation and external validation, or through independent replication in new datasets. Among the included studies, all models were developed and internally validated, with no study conducting external validation using a dataset for migraine. The most common validation method was fold cross-validation (CV), employed in seven studies [14, 16, 23, 25, 37,38,39], while one study utilized leave-one-out cross-validation (LOOCV) [12].
Results of quality assessmentThe PROBAST assessment revealed that all included studies were generally considered to have a high risk of bias, with the primary issues concentrated in the analysis domain. (see Fig. 2; Table 2 and Supplementary Table S2)
Fig. 2
Risk of bias assessment using the PROBAST based on four domains
Table 2 Tabular presentation for the PROBAST assessment of included studiesIn the participant domain, one study was rated as high risk due to its retrospective design [40], and another study had an unclear risk of bias because of inadequate patient inclusion and exclusion criteria [25]. In the predictor domain, one study had an unclear risk of bias as it was a multicenter study that failed to report quality control measures to minimize bias [24]. Another study was rated as high risk because of its retrospective nature [40]. In the outcome domain, one study was deemed high risk due to the lack of definition of clinical outcomes [14], while another study was rated as unclear risk for providing vague outcome definitions [40].
In the analysis domain, all ten studies were identified as high risk. Regarding question 4.1, three studies met the recommended “events per variable” (EPV) threshold of greater than 20, indicating sufficient sample sizes [12, 25, 38]. The remaining seven studies were at high risk due to insufficient or unclear numbers of non-responders or prognostic factors, resulting in EPVs below the standard or an inability to accurately determine EPV [14, 16, 23, 24, 37, 39, 40]. Regarding question 4.3, one study mentioned excluding participants due to poor image quality, which was considered a low-risk action [37]. Since image quality is beyond the researchers’ control, excluding subjects for this reason is deemed low risk. However, direct exclusion of participants for other reasons was considered high risk. Regarding question 4.4, only one study reported how missing data were handled, but the method used was not recommended by PROBAST, leading to a potential risk of bias [24]. Regarding question 4.5, one study failed to avoid univariate analysis in the best-performing model [25], posing a potential bias risk. Regarding question 4.6, no studies provided information on data complexity. Regarding question 4.7, only one study conducted a comprehensive assessment of its prediction model’s performance [16], and two studies did not specify their model evaluation methods [14, 23]. Regarding question 4.8, one study used an osteoarthritis dataset for validation, which does not qualify as strict external validation [16], while another study had unclear external validation due to conflicting participant groupings [40]. The remaining studies did not address model overfitting, underfitting, or optimism in performance metrics. Regarding question 4.9, just one study report
留言 (0)