Study animals
For the electrophysiology studies, we collected 12 solifuges (Eremobates pallipes) near the visitor center of the Rocky Mountain Arsenal National Wildlife Refuge, Colorado, USA (39°50’4.23” N, 104°50’21.52” W) between July 24–26, 2021. We initially housed each individual in a small Tupperware container with paper towel bedding that we replaced every day. Solifuges were exposed to natural day/night cycles, and we fed them 1–2 small live crickets (purchased from PetSmart) daily. Immediately prior to the electrophysiology experiments, we sent the solifuges overnight to the University of Oklahoma, Norman, OK, USA. Animals arrived on August 3, 2021, and we conducted experiments from August 4–8, 2021. During this time, we housed the solifuges in small plastic containers (diameter: 11 cm, height: 10 cm) with mesh lids. We filled the containers about halfway with sand and added a few small rocks. We fed each solifuge one ~ 1.3 cm live cricket (Gryllodes sigillatus from Ghann’s Cricket Farm) each day. Solifuges have poor survival in captivity (Cushing et al. 2014) and when the animals naturally expired, we put them in 70% ethanol. We retained the preserved specimens in the collection of the Hebets’ laboratory at the University of Nebraska-Lincoln following laboratory policy in the absence of any national or University-wide regulations for working with arachnids.
We used extracellular electrophysiology to record the electrical signature of cells at the base of individual sensilla and the responses of the solifuges to various stimuli. Out of the 12 available animals, we collected reliable data for air particle movement and air pressure stimuli from five (Table 1). We have shown two sets of representative data for each experiment in this study. As electrical signals vary amongst different cells of an animal and between animals, we have not combined the recording data from different animals or different sensilla.
Table 1 Biology of solifuges used in electrophysiological recordings and their recording details. The table contains Animal ID, sex, weight (mg), and cephalothorax width (mm) along with the type of stimuli used, # of recordings, and in which figures the data are visualized. The acronyms used for stimuli are APM (Air Particle Movement stimuli), AP (Air Pressure stimuli), and PB (Passive Breath stimuli). The acronyms used for the location of the sensilla on the 4th pair of legs are LT (Left Tibia), RT (Right Tibia), LF (Left Femur), and RF (Right Femur)To analyze the elongated sensilla deflection and behavioral responses to different stimuli, we collected two solifuges (Eremobatidae, species unknown due to immaturity), from Cedar Point Biological Station in Ogallala, Nebraska, USA (41°12’30.7"N, 101°38’45.7"W, 967 masl) between July 20 - August 5, 2022, using pitfall traps with bright lights (Cushing and González-Santillán 2018). We note that these immature solifuges did not display notable differences in their elongated sensilla as compared to the mature Eremobates pallipes used in the electrophysiology studies. We used these animals to observe (i) elongated sensilla deflections with a high-speed video camera and (ii) individual behavioral responses to stimuli. We conducted these observations at Cedar Point Biological Station immediately following the capture of the solifuges. After the experiments, we placed the individuals in 70% alcohol and deposited them in the collection of the Hebets’ laboratory at the University of Nebraska-Lincoln.
Elongate sensilla deflection
To examine the potential mechanical response of the elongated sensilla on the 4th leg to different frequencies of air particle movement, we subjected each solifuge to a cooling period in a glass vial for 3–5 min by placing them in a refrigerator (-20ºC). Once the solifuge was immobilized, we positioned it on a microscope slide with modeling clay to secure and immobilize the animal while exposing its left 4th leg. Subsequently, we placed the solifuge on a granite surface to prevent the transmission of surface-borne vibrations. The stimuli were produced following the same methodology as the electrophysiology study. We employed a high-speed camera (Photron Fastcam1024PCI, Model: 100 K) to observe the sensilla movement in real-time with a computer set-up. We recorded the movement of the sensilla with the camera operating at 5000 fps with a shutter speed of 1/5000 s in all the experimental frequencies (10–1000 Hz).
Air particle movement stimuli. The speaker was positioned 10 cm from the individual, and we played progressively increasing frequencies 10 to 1000 Hz (at 10 Hz increments until 300 Hz and then at 50 Hz increments to 1000 Hz) at different amplitudes (low: 70–80 dB, medium: 81–96 dB, high: 100–105 dB). Moreover, we played each frequency for 3 s and observed whether the elongated sensilla exhibited any movement.
Air pressure stimuli. We (author FC) applied “forceful breaths” 20 cm from the immobilized individual narrowing our lips to almost a point and letting out a short burst of air (less than one second) at different intervals (following the air pressure stimuli protocol in the Electrophysiology study) to observe the potential deflection of the elongated sensilla to a single prolonged burst lasting 5–6 s. In addition, we generated a “forced airflow” with a syringe (by activating the syringe of 20 cc and pressing gently for a duration of 5–6 s) also 20 cm from the immobilized individual.
Electrophysiology of sensillaExperimental setup
The experimental setup was arranged inside a Faraday cage placed on a vibration-dampening table (Technical Manufacturing Corporation, Peabody, MA, USA, SI. 1a). We placed a dissecting stereoscope (Nikon Olympus, 105478) inside the cage, with a micromanipulator (World Precision Instruments, M3301L) to hold the animal on the left side and another micromanipulator (Leitz, 100894) to position the electrode on the right side (SI. 1a). We used an amplifier (World Precision Instruments, DAM 80) to amplify the signals 1000 times over a bandwidth of 300–3000 Hz, displayed them on an oscilloscope (Tektronix, 5A18N), and relayed the signals through an analog-to-digital converter (CED, Micro3 1401) to a computer. We recorded all electrophysiological responses using Spike2 version 8 (CED).
To prepare a solifuge for electrophysiology, we put the animal in the freezer (~ -17.8ºC) in a glass vial for 3–5 min so that it became immobile. Following inactivity, we placed the animal on a slide with double-sided tape to affix its abdomen and fourth pair of legs (SI. 1b). Then, we used modeling clay to keep the front of the body in place and prevent escape (SI. 1b). We used additional double-sided tape as needed to restrain the animal from moving its legs during the experiment.
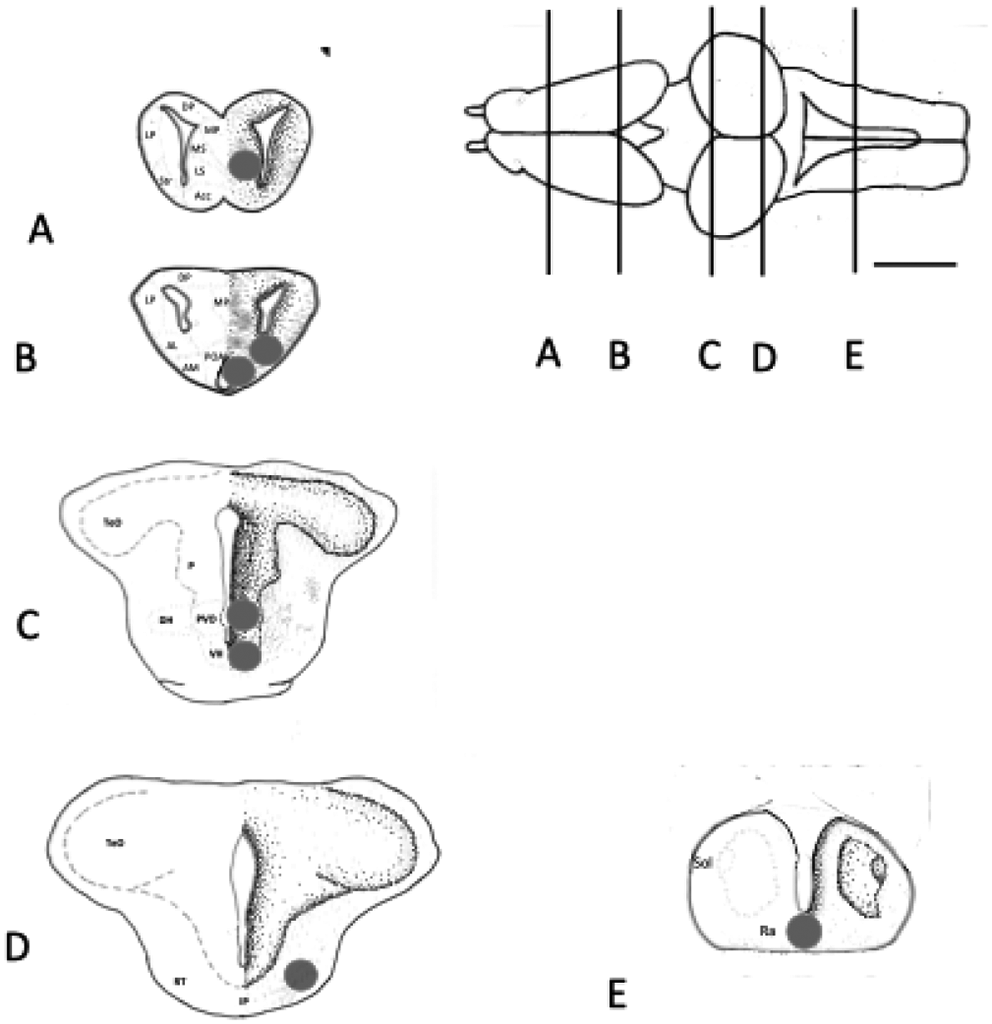
We affixed the slide with the solifuge to the first micromanipulator. We positioned the slide under the dissecting stereoscope inside the Faraday cage and focused the stereoscope on the base of an elongated sensilla on the femur and tibia of the left and right fourth pair of walking legs of the solifuges (Fig. 1). The sensilla were ~ 2.7–5.0 mm in length. We attached a tungsten recording electrode (that was electrolytically sharpened in a 1 M NaNO3 solution) to the Leitz micromanipulator. While observing the base of the sensillum under the stereoscope, we manipulated the recording electrode using the micromanipulator and pierced the base of the sensillum (SI. 1c). We also inserted a small piece of silver wire through the cuticle on the femur of either the left or right third walking leg to serve as the indifferent electrode to complete the circuit. We used the oscilloscope, the Spike2 computer record, and the sound of the signal (using a PYLE PTA2 Stereo Power Amplifier attached to a pair of small Realistic speakers) to search for consistent spikes (i.e. action potentials), which let us determine if the electrode was detecting extracellular neural activity from sensillar neurons. After the recordings were made, we released the animals back into their containers. All experimental animals were active and foraging after they were released.
Experimental stimuli
Air particle movement stimuli. We used speakers to introduce an air particle movement stimulus (i.e. near field sound) to deflect the elongated sensilla. The near field is determined as the area closest to the source of the sound, generally within less than one wavelength of the sound frequency. With the inverse relation between wavelength and frequency, and knowledge of the speed of sound (~ 34000 cm/s), we determined the wavelength of the frequencies that we used (10–1000 Hz). The wavelength of 10 Hz is ~ 3400 cm while the wavelength of 1000 Hz is ~ 34 cm. Thus, we placed our speaker (DD Audio, DB65A) ~ 10 cm away from the elongated sensilla ensuring near-field range for all frequencies used. We used an amplifier (Rolls, PA71plus MicroMix Power Amplifier) to connect the speaker to a laptop to play the sound files at 74dB, measured using a digital sound level (Brand: RadioShack, Model: Digital Sound Level Meter 33-2055). For the first animal (Table 1, Animal A), we used sound frequencies of 10 to 1000 Hz (at 10 Hz increments until 300 Hz and then at 50 Hz increments to 1000 Hz) to observe any response to air particle movement. In between each sound frequency stimulus, there was a gap of one to two minutes where no frequencies were played. These parts of the recordings were referred to as the “control”. In total, 4 of our solifuges produced a total of six clear sets of recordings during our air particle movement stimulations (Table 1). We also performed a preliminary behavioral trial (SI. 2) with similar parameters.
Air pressure stimuli. We (author PK) used “forceful breaths” to introduce an air pressure mechanosensory stimulus to deflect the focal elongated sensilla (SI. 3). Our choice of using “forceful breaths’’ was driven by reliable responses observed in our preliminary tests and the need to conduct experiments quickly before the animals expired. Time pressure and fragility of these understudied arachnids severely limited our experimental options and forced us to be creative with air pressure stimuli. To provide comparable stimuli across deliveries, a single experimenter (PK) repeatedly narrowed their lips to almost a point and let out a short burst of air (less than one second) at different intervals. We (author PK) also introduced a prolonged burst lasting 5–6 seconds. Given that the focus of this study was on the potential to detect stimuli and not on the relationship between stimulus characteristics and response, we only needed to be sure that our stimulus was indeed capable of stimulating our focal sensilla.
To ensure that our “forceful breaths” successfully moved the target sensillum, we captured a video (SI. 3) of the sensillum during our forceful breath stimuli and used a Python script to capture the deflection of the sensillum (see SI. 4). By using a frame-by-frame subtraction method coupled with a contour generating algorithm, we documented the moving sensillum within a cropped area of the video and visually represented the angle of deflection within each frame (see SI. 4). Finally, we generated a graph showing the angle of sensillum deflection for 10 stimuli extracted from the video (see SI. 5).
For some sensilla, we tested the presence/absence of responses to the forceful breath stimuli (Table 1, Animal B, Animal C, Animal E). For one animal (Table 1, Animal B), we systematically tested the response to forceful breath stimuli. For Animal B, we introduced the short bursts at intervals of three seconds (3s), two seconds (2s), and one second (1s). We introduced all stimuli from ~ 23 cm away. A complete set of air pressure stimuli included multiple short bursts of forceful breath (10–12) at 3s, 2s, and 1s intervals. In between the stimuli with different intervals, we administered rest periods of 15–30 s. We also performed a preliminary behavioral trial (SI. 6) with similar parameters.
We used prolonged forceful breath stimuli to determine the recovery of the cells. We collected three sets of systematic recordings of responses to forceful breath stimuli from two separate elongated sensilla in one solifuge (Table 1, Animal B). Since our breath stimuli also included humidity, temperature, and/or olfactory stimuli, we conducted a second stimulus set of ‘passive breaths’ to separate out the effects of those factors. This also acted as a control to the air pressure stimuli. For the passive breath stimuli, we opened our mouths wide and let out air in short bursts of around one second from ~ 23 cm away. We obtained three sets of recordings with the passive breath stimuli from one solifuge (Table 1, Animal B).
Analysis of electrophysiology recordings
To analyze our recordings using Spike 2 version 8 (CED), we first exported our data as smaller files focusing on each individual stimulus or set of stimuli. We then acquired the spike patterns from the software for all analyses. Based on the similarity in spike waveform shape, we color-coded the spikes for each experiment/animal. We sorted shorter and taller spikes (different in voltage range) separately (shown in the axes, Figs. 2b and 3b, SI. 7b, 8b) to capture all the spikes that may have changed shape through sensory adaptation. To determine if the solifuge sensilla could detect our artificial stimuli, we compared the spike patterns of the responses during stimulus presentations to the control periods (no stimuli present). We compared the ‘average number of spikes/s’ (calculated over 30s) between stimuli and control for the air particle movement stimuli.
For air pressure stimuli, we only showed the response spikes without the background spikes. We also performed autocorrelations (correlating the time series of an individual spike type against itself) and cross-correlations (correlating the time series from two different spikes against each other) for the responses to air pressure stimuli to explore whether the response might be from the same cell (Eggermont 1990) (Fig. 3c, SI. 8c). For air pressure stimuli at different intervals, we collected ‘number of spikes/s’ in 1-second bins at the beginning of each air pressure stimulus/response at the specified intervals. We considered the recording in between the sets of stimuli responses as a control (data not shown). For the prolonged air pressure stimulus, we collected the number of spikes/s for one second before the start of the stimulus to four seconds after the start of the stimulus (total 5 seconds in 100ms bins).
Statistical analysis
We analyzed the data using R version 4.1.2 (R Core Team 2021). We used the packages tidyverse, ggplot2, rstatix (function, pairwise_t_test) and zoo (function rollmean). We tested to see if there were any trends in the ‘average number of spikes/s’ for the control (no sound playing) and each of the sound frequency stimuli. We considered the ‘average number of spikes/s’ from 10 Hz to 1000 Hz and applied a linear regression trendline. We compared the ‘average number of spikes/s’ for the control and the frequency stimuli with a pairwise t-test.
With the ‘number of spike/s’ collected from Spike2 for the response to stimuli at different intervals, we performed combined pairwise t-tests to compare the responses to the different interval stimuli with the control and with each other. The p-values for the combined pairwise t-test were adjusted by the Holm method. We used a rolling average method (1 second bins) to plot the response to prolonged forceful breath stimuli. The rolling average method is used to find long-term trends that might be hidden by intermittent fluctuations. We also provided the response with the raw data (SI. 9).
Behavioral responses to mechanical stimuli
We placed the animal in a plastic circular arena on a granite surface (25 cm x 10 cm). At the beginning of each trial, we positioned the solifuge in the middle of the arena inside a smaller circular barrier (10 cm x 5 cm) and let it acclimatize for 30 min. We recorded the experiments in darkness with an infrared camera with a “night-shot” function (Sony DCR-TRV 351). The darkness and granite substrate removed the possibility of animals responding to visual or substrate-borne stimuli. The surface was cleaned in between trials with ethanol. We observed the occurrence and latency of response behavior after applying the stimuli. The behavior we scored included: (a) Flight behavior, the individual moves away from the stimulus; (b) Confrontation behavior, the individual moves or turns in the direction of the stimulus; (c) Freezing behavior, the individual is in motion and stops after the stimulus; (d) Startle behavior, the individual slightly moves one of its appendages (following prior research by Cloudsley-Thompson 1961; Punzo 1998). We conducted the behavioral response experiments on two consecutive days (1st and 2nd iterations) for each animal with ~ 24 h of rest to determine the consistency in their behavioral responses.
The air particle movement and air pressure stimuli were the same as in the elongated sensilla deflection protocol. We also used tactile stimuli where we (author FC) touched the elongated sensilla on the 4th leg directly using an entomological pin to observe the behavioral responses of the solifuge. We also touched other sensilla on the pedipalps as a control to compare the behavioral responses previously observed. We recorded all interactions with the individual solifuges to verify that the stimulus was applied correctly to the elongated sensilla.


留言 (0)