
記住我
Brain-Computer Interfaces (BCIs) are a rapidly evolving field situated at the convergence of neuroscience, signal processing, and artificial intelligence, providing transformative opportunities for human-computer interaction. BCIs capture brain signals through invasive or non-invasive devices and translate an individual's intentions into commands that control external systems, enabling direct communication between the brain and these systems (Arpaia et al., 2020; Li et al., 2023). This technology holds significant promise not only for patients with neurological disorders but also for individuals with motor impairments, offering them the ability to control external devices, such as prosthetics, wheelchairs, and robots, thereby enhancing their autonomy and quality of life (Zhang et al., 2023; Lu et al., 2020). Beyond assistive technologies, BCIs are also being explored in various other fields, including entertainment, communication, and neurorehabilitation, where they can facilitate tasks ranging from controlling video games and smart home devices to aiding in motor recovery post-stroke (Wu et al., 2022; Yao et al., 2020). In addition, with the rapid development of intelligent driving technology, BCIs is increasingly being applied within this field. Wang et al. (2018) and Xu et al. (2021) effectively utilized BCI technology to explore its potential applications in driving scenarios. Through the integration of BCI technology with advanced algorithmic models, they achieved precise monitoring and real-time alerting of driver fatigue.
Despite the substantial potential demonstrated by EEG-based Brain-Computer Interface (BCI) systems, their transition to everyday applications remains constrained by several factors. For instance, signal acquisition is typically conducted in low-interference laboratory environments, which, while ensuring high-quality data collection, are not practical for maintaining a consistently low-noise standard in real-world settings (Al-Fahoum and Al-Fraihat, 2014; Minguillon et al., 2017; Valentin et al., 2018). Additionally, many EEG-based BCI systems rely on numerous wet electrodes to capture the necessary brain signals. This method involves the use of conductive gel to maintain proper contact with the scalp, which, although it enhances signal quality, is complex, time-consuming, and impractical for everyday use (Xing et al., 2018; Wang et al., 2021; Mhapankar and Shah, 2022). Furthermore, the dependence on a large number of electrodes not only increases the complexity of the setup but also introduces challenges in signal processing. These limitations underscore the difficulties in transitioning BCI technology from experimental research to practical, user-friendly applications in daily life (Tam et al., 2011; Ramirez-Quintana et al., 2021).
To address the challenges associated with traditional EEG-based Brain-Computer Interface (BCI) systems, portable and wearable EEG devices have emerged as promising solutions. These devices offer significant advantages in terms of user convenience and practicality (He et al., 2023). For example, dry electrode systems eliminate the need for conductive gel, simplifying the setup process and enhancing user comfort (Li et al., 2020). Wang et al. skillfully employed a wireless dry-electrode EEG acquisition system (model HD-72, manufactured by Cognionics Inc., USA) to collect extensive EEG data from a large number of participants, establishing a robust dataset for their comprehensive studies in this domain. This data collection effort laid a solid foundation for their in-depth research into various aspects of EEG-based fatigue detection and cognitive state analysis, as demonstrated in their subsequent works (Wang et al., 2020a,c,b; Chen C. et al., 2023). Portable EEG devices, such as those developed by Emotiv EPOC+ (Chabin et al., 2020) and Muse headband (Krigolson et al., 2021), are designed to be lightweight and easy to use, making them suitable for real-world applications. These advancements have paved the way for more accessible and user-friendly BCI systems. However, despite their benefits, wearable EEG devices face limitations due to the constrained number of electrodes, which can lead to a decline in BCI performance (Li et al., 2024). Several studies have examined the impact of using a limited number of electrodes or non-feature region channels for intent classification in BCIs. Lan et al. (2021) demonstrated that combining non-occipital signals and reference points could yield an accuracy of around 80%. Hsu et al. (2015) showed that SSVEP signals from the frontal region could effectively support BCIs. In scenarios with limited occipital channels, Ge et al. (2021) achieved 76% accuracy with just three occipital channels. Likewise, Chen et al. (2017) obtained accuracies of 86.58% in simulations and 85.54% in real-world robot control using a single channel. These results suggest that non-feature region electrodes can be leveraged for intent classification when necessary.
Additionally, while mainstream BCI acquisition and analysis platforms, such as OpenBCI, EEGLab, and OpenVibe, perform well in EEG signal acquisition and processing, they lack integrated solutions for controlling external devices (Tonin et al., 2022; Beraldo et al., 2018). In recent years, several approaches have been proposed to drive external devices using the aforementioned BCI systems. For example, Casey et al. (2021) developed a BCI-based robotic arm control solution using the OpenBCI platform to assist in the rehabilitation of patients with neurological impairments. Similarly, An et al. (2024) introduced a robot control system based on OpenViBE to enhance the practicality of BCI applications. Shao et al. (2020) utilized the EEGLab toolbox to study and effectively control a wall-climbing cleaning robot. While these studies present control solutions for external devices based on specific BCI systems, their implementation requires developing customized underlying code for each external device, which limits their integration efficiency. However, despite these advancements, these platforms primarily focus on signal processing capabilities and still require significant development to achieve seamless integration with real-world applications, particularly in complex environments and robotic interactions. With the advancement of robotic technologies, the Robot Operating System (ROS) has become a widely adopted development tool (Quigley et al., 2009; Lee, 2021). Known for its high integrability with external devices, ROS provides a robust framework for seamlessly integrating diverse hardware and software components in robotics and automation. It facilitates efficient communication between sensors, actuators, and computational nodes, making it an ideal choice for controlling complex systems (Caldas et al., 2024).
To address the aforementioned issues, the main contributions of this study are as follows:
i. A ROS-based framework, Gaitech BCI, is proposed for BCI signal acquisition and analysis using the portable dry-electrode device H10C. The platform can be used to manage EEG experiments, create datasets, and export data in formats such as .mat, .fif, and .csv through a user interface;
ii. Three ROS packages were developed and integrated with the BCI system, providing a solution for controlling external devices through the BCI system;
iii. To address the issue of reduced BCI classification performance caused by the limited number of channels in portable EEG devices, a novel channel selection network based on SE attention and multi-scale convolution is proposed, which extracts both feature and non-feature channel information;
iv. The framework and network are validated through SSVEP data collection from ten subjects, including within-subject, cross-subject, and ablation experiments, as well as real-time testing, demonstrating their effectiveness.
The rest of this article is organized as follows: Section 2 describes the proposed system framework, classification model framework, and acquisition of experimental data, Section 3 describes experimental details and result analysis, and Section 4 summarizes our work and discusses it. The model code and 3 python packages can be obtained at https://github.com/chiwuan6/SEMSCS.
2 Materials and methodsIn this study, we developed an electroencephalography (EEG) acquisition and analysis system named Gaitech BCI using the H10C dry electrode portable BCI device. The design of this platform enables users to intuitively configure EEG-based BCI experiments and create datasets for both offline analysis and online experiments. The overall architecture of Gaitech BCI is illustrated in Figure 1. The Gaitech BCI system is composed of two main components: the upper layer, comprising the H10-EEG Headset and a Linux-based API, and the lower layer, consisting of Python-based ROS packages. The upper layer includes two key elements: the embedded firmware that drives the hardware device and the API interface responsible for device connectivity and data transmission. The lower layer consists of three custom-developed ROS packages. Raw signals are initially acquired by the hardware device, driven by the embedded firmware in the upper layer, and then transmitted via the API interface to the ROS environment in the lower layer. Within the ROS environment, these signals are exchanged among the ROS packages through topics and services, enabling seamless integration and data flow. The three packages in the lower layer will be described in detail later, and the following is an overview of the three functional packages:
• gaitech_bci_bringup: As the core package of the framework, this package contains all the necessary services and topics for managing the device and acquiring raw EEG data from it;
• gaitech_bci_tools: This package serves as the system's tool management package, integrating various functionalities. Through ROS nodes, users can invoke corresponding tools to assist with experiments. Additionally, it includes a graphical user interface (GUI) that provides access to the required functions.
• gaitech_bci_teleop: This package acts as the interface between the system and external devices, allowing users to configure experiments for online or simulation validation. Users can publish image topics in ROS to receive visualized images or interfaces as needed.
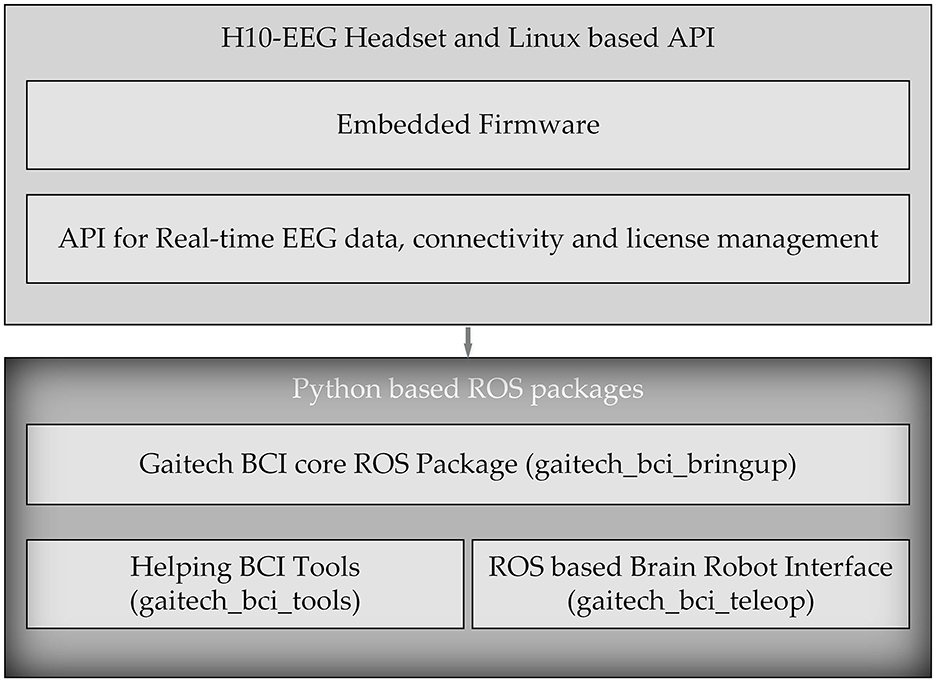
Figure 1. Overall architecture of Gaitech BCI.
2.1 DeviceThe signal acquisition device used in the proposed Gaitech BCI system is the Avertus H10C EEG headset. The H10C has been reasonably designed for functionality and comfort. Its lightweight, ergonomic design allows for multiple hours of comfortable use. Foam electrodes are used on FP1, FP2, and FPz to provide comfort where there is no hair. Compared to traditional wet electrodes, foam electrodes eliminate the need for conductive gel, reducing preparation time and the inconvenience associated with cleaning (Liao et al., 2012; Searle and Kirkup, 2000). Unlike dry electrodes, which may suffer from inconsistent signal quality due to varying scalp impedance, foam electrodes offer a balance of comfort and reliable signal acquisition, especially in areas without hair (Chi et al., 2011). However, foam electrodes may not provide the same signal accuracy as wet electrodes in certain high-precision applications (Yeung et al., 2015). Spring-loaded, gold-plated electrodes at FCz, F7, F8, T3, T4, T5, T6, O1, and O2 are designed for hair penetration, ensuring comfort and delivering high-quality EEG signals. Both the foam and spring-loaded electrodes are removable for easy cleaning and replacement when needed. The H10C is adjustable with easy-to-use Velcro straps because of its ability to conform to most head shapes and sizes. The characteristics of H10C are shown in Figure 2.
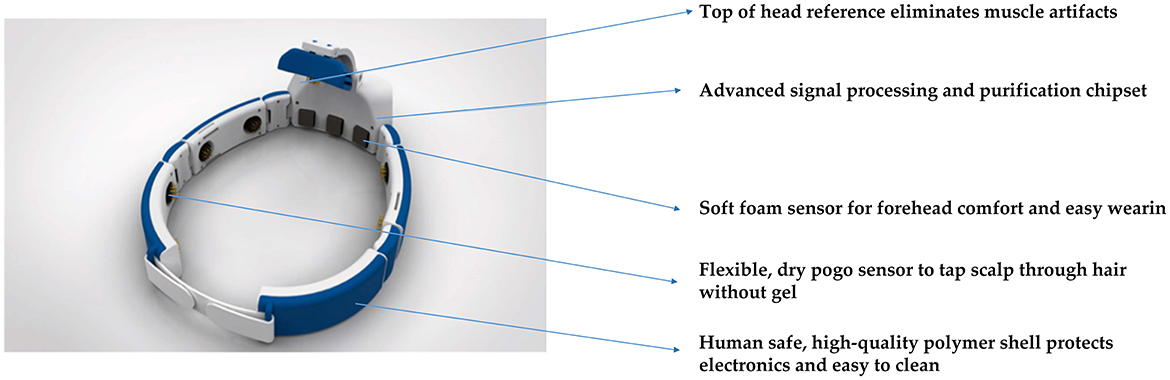
Figure 2. Several characteristics of the Avertus H10C EEG Headset.
2.2 Core packages 2.2.1 gaitech_bci_bringupIn this study, the gaitech_bci_bringup ROS package was utilized for the comprehensive processing of BCI data. Specifically designed for BCI applications, this package encapsulates a complete workflow for data acquisition, preprocessing, and state monitoring, facilitating seamless integration into ROS-based research environments. A detailed explanation of the package is provided in Figure 3. An itemized description of the functionalities included in this package is provided in the following:
• Data acquisition: The gaitech_bci_bringup package establishes a communication interface with BCI devices, enabling the subscription and aggregation of raw data streams, including EEG signals and device status information. This feature ensures the timely capture of BCI data. The support for different devices can also be expanded by users based on the communication methods of their devices;
• Data preprocessing: By incorporating classical filtering algorithms, such as high-pass, low-pass, and notch filters, gaitech_bci_bringup allows researchers to tailor the data to their specific analysis requirements. Additionally, it supports the conversion of raw data into various reference formats (e.g., Average Reference, Common Reference, Longitudinal Bipolar, and Transverse Bipolar) (Acharya and Acharya, 2019);
• State monitoring and services: The package incorporates a state monitoring system, which continuously tracks the status of BCI devices and filters. Through ROS services and topics, gaitech_bci_bringup provides researchers with real-time access to device connectivity status, filter configurations, and other pertinent information (Koubâa et al., 2017);
• Configuration and deployment: To facilitate ease of use and reproducibility, allowing researchers to configure the package to their specific needs. Furthermore, the inclusion of launch files simplifies the deployment process (Koubâa et al., 2017), enabling researchers to quickly bring up the entire BCI data processing environment with a single command.
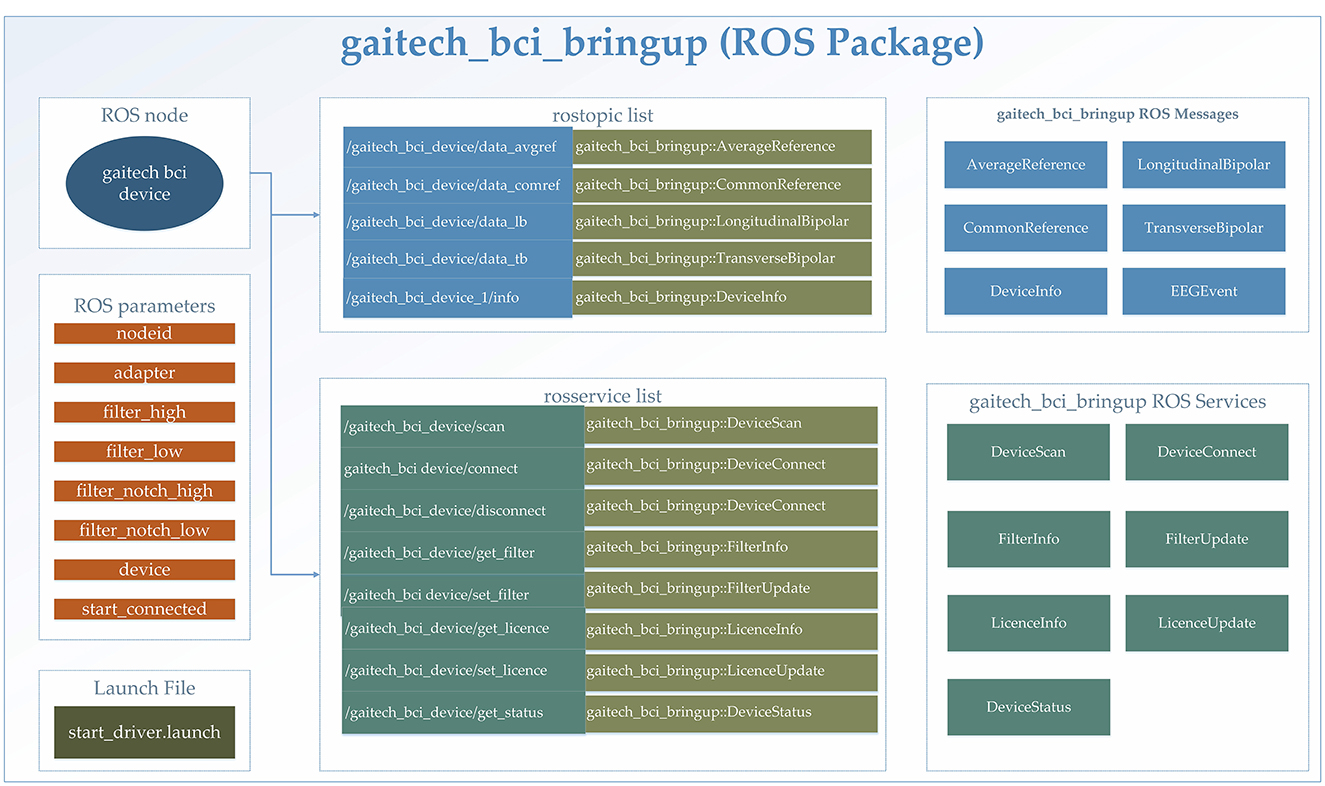
Figure 3. Detailed description of the gaitech_bci_bringup ROS package.
2.2.2 gaitech_bci_toolsThe gaitech_bci_tools package facilitates EEG experiments and analysis within a ROS framework, providing tools for real-time monitoring, data processing, and device management. These functionalities, along with integration with gaitech_bci_bringup for device setup, are accessible through a graphical user interface (GUI). The structural overview of the package is presented in Figure 4, with specific details outlined as follows:
• User interface: The gaitech_bci_tools package provides a user interface for managing EEG devices. Users can view bio data and bio events in real-time, facilitating monitoring and debugging during experiments. Additionally, the package includes a view_bci_data tool, which creates EEG datasets for BCI experiments, allowing researchers to access and analyze recorded data;
• Data conversion tools: A key feature of the gaitech_bci_tools package is its suite of data processing and conversion tools. These tools enable researchers to convert recorded EEG datasets from ROS bag files into various formats, including MNE (.fif), MATLAB (.mat), and CSV (.csv), thereby enhancing the interoperability of EEG data with other analysis software;
• ROS services for EEG device management: The package incorporates ROS services that facilitate the management of EEG devices (Koubâa et al., 2017). For instance, the view_psd service enables researchers to visualize the power spectral density of EEG signals, providing insights into the frequency content of the recorded data. Additionally, the video_experiment_builder tool simplifies the process of annotating videos and collecting labeled EEG datasets, while the make_experiment service converts EEG experiment protocols (in CSV format) into executable experiment configurations;
• Integration with gaitech_bci_bringup: The gaitech_bci_tools package seamlessly integrates with the gaitech_bci_bringup ROS package, which handles the initial setup and configuration of EEG devices. This integration ensures that researchers can quickly bring up their EEG data processing environment, from device connection to data visualization and analysis, within a unified ROS-based framework.

Figure 4. Detailed description of gaitech_bci_tools.
2.2.3 gaitech_bci_teleopThis package serves as a communication interface between the system and external devices, leveraging the ROS capability of cross-language and cross-version communication, enabling the flexible deployment of signal recognition algorithms and establishing a bridge for interactions between the system and external peripherals (Koubâa et al., 2017; Fairchild and Harman, 2016). The structural organization of the package is illustrated in Figure 5, and its main features are as follows:
• EEG signal transmission: The EEG signals are captured through the gaitech_bci_device hardware interface, and these signals along with device information are transmitted within the ROS network in the form of ROS topics. This approach facilitates seamless data flow and integration with the ROS ecosystem (Koubâa et al., 2017; Fairchild and Harman, 2016);
• Robot control command generation: Based on the analytical outcomes of the EEG signals, corresponding robot control commands are generated and dispatched to the robot via ROS standard topics (e.g., /cmd_vel) (Koubâa et al., 2017; Fairchild and Harman, 2016), thereby directing its movements. This mechanism allows for dynamic and responsive control strategies based on brain-computer interaction;
• ROS interface design: Through the modular architecture of ROS nodes and services, this package offers interfaces that simplify integration and extension with other ROS packages or system components (Koubâa et al., 2017; Fairchild and Harman, 2016).

Figure 5. Detailed description of gaitech_bci_teleop ROS package.
Overall, the interaction and data flow between the three core ROS packages are as follows. The data flow begins with signals transmitted from upper level BCI devices, which are received and processed by gaitech_bci_bringup. This package is responsible for raw EEG signal acquisition and preprocessing, including filtering and formatting the data for subsequent analysis.
The preprocessed data is then passed to gaitech_bci_tools, which offers a graphical interface for real-time monitoring, dataset creation, and visualization. This interface also enables users to interactively modify the preprocessing parameters of gaitech_bci_bringup, facilitating system customization and adaptability to specific experimental requirements.
Finally, the processed datasets and outputs from gaitech_bci_tools are utilized by gaitech_bci_teleop to generate robot control commands. These commands, based on EEG signal interpretations, are transmitted through the ROS network to execute robot actions. This hierarchical data flow and modular integration establish a pipeline from signal acquisition to real-world application, with each package contributing a distinct but interconnected layer of functionality, thereby supporting a ROS-based BCI research framework. The above description is shown in Figure 6.
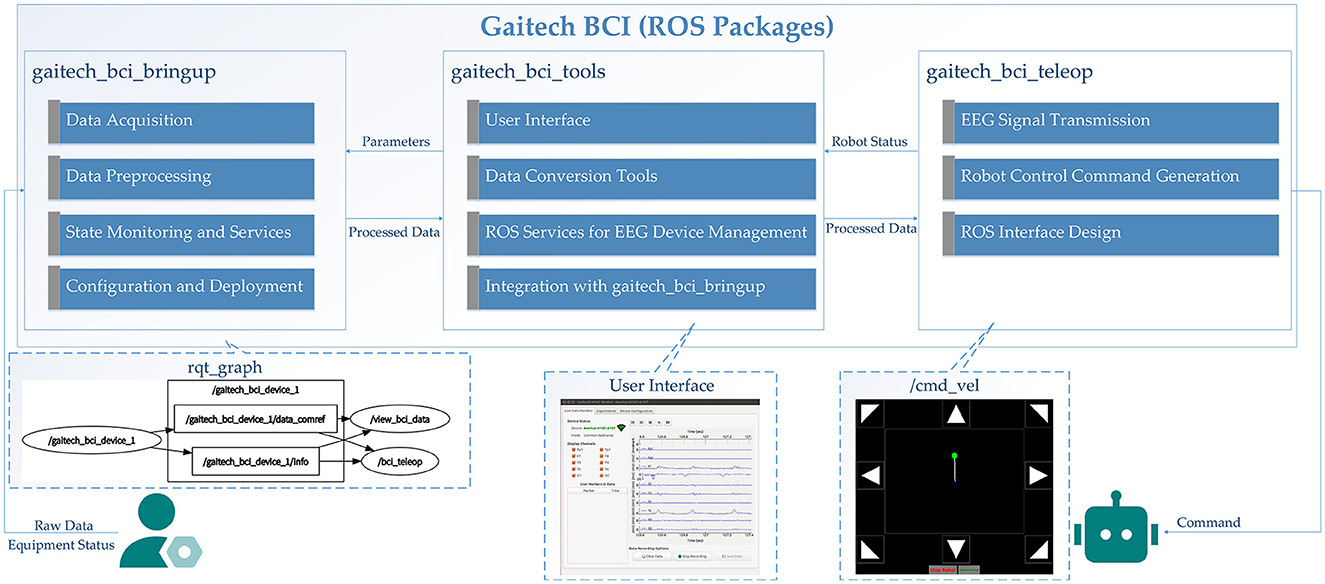
Figure 6. Data flow and interaction between core ROS packages in the Gaitech BCI framework.
2.3 Network structureIn this research, we introduce a neural network architecture called SEMSCS, which integrates the SE attention mechanism (Hu et al., 2018; Li et al., 2021) with multi-scale convolution (Ko et al., 2021; Liu et al., 2022). This architecture leverages both channel attention and multi-scale convolution techniques to extract features from the complete set of channels with limited electrode data. The SEMSCS model is depicted in Figure 7. The design draws inspiration from EEGNet (Lawhern et al., 2018), incorporating elements of channel attention and multi-scale convolution for improved feature extraction.
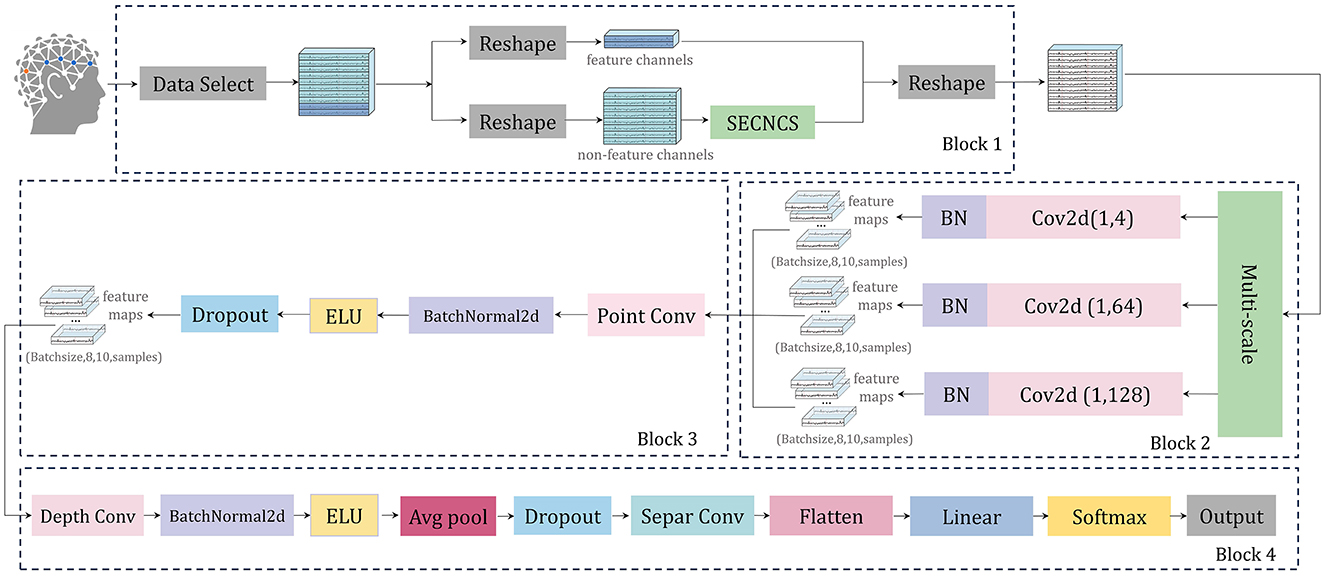
Figure 7. The architecture of SEMSCS, consisting of four main blocks: (1) an improved SE attention mechanism (Block 1), (2) a multi-scale convolutional layer (Block 2), (3) a pointwise convolutional layer (Block 3), and (4) a block combining deep convolutional and separable convolutional layers (Block 4).
The SEMSCS model is composed of four key components: a channel selection and attention block based on an improved SE block, a multi-scale convolution block, a pointwise convolution block, and a final processing layer consisting of depthwise and separable convolutions. Initially, the raw EEG data is reshaped into two parts: paradigm-related feature channel data and non-feature channel data. This study employs the SSVEP paradigm to experimentally evaluate the network and system. The feature channels are electrodes located in the occipital region. For the dry electrode device H10C, which contains 10 channels, the data is divided into two parts accordingly: the non-feature channels correspond to the 8 electrodes in non-occipital regions, while the feature channels correspond to the 2 electrodes in the occipital region (O1, O2). This configuration was selected to align with the experimental paradigm in this study and to adapt to the electrode layout of the device used. Importantly, the proposed network is adaptable and allows flexible feature channel selection during initialization, accommodating different devices and electrode distributions based on specific experimental requirements. Next, latent features from the non-feature channels are extracted using the improved SE block (SECNCS).
The structural overview of the SECNCS is presented in Figure 8. The input data for SECNCS is denoted as X, X ∈ ℝB×C×S, where B is the batch size, C is the number of channels, and S is the length of the time series. Then, X flows into two branches. In the first branche, the global information of each channel is obtained primarily by aggregating data across the time dimension. This process can be formulated as z=1s∑s=1sXc,s. Subsequently, two linear transformations are applied. The former transformation, with weight matrix W1∈ℝC×C/r, compresses thechannel dimension. Meanwhile, a nonlinear activation function σ1 (relu) is adopted to enhance the model's attention for the important features. Further, the later linear transformation with W2∈ℝC/r×C, restores the original channel dimension after applying activation function σ2 (sigmoid). This process generates the attention weights a, which reflect the importance of each channel. The attention weights are then multiplied with the input data channel-wise to produce the output features X1 of the first branch. In the second branch, channel data are processed along the time dimension using local weighted summation, similar to a convolution operation. Specifically, a filter weight vector Wfilter is applied to compute the weighted sum across segments of the time series, producing the filtered data y. This filtered result is then aggregated along the time dimension and acts as a one-dimensional mean pooling operation that enhances the contrast of feature information to obtain the features Zfilter of the second branch. In the end, a learnable weight vector ω ∈ ℝC is introduced to combine the results from the two branches. We stress that value of ω is constrained between 0 and 1 by using the sigmoid function. This weight controls the combination ratio of the features from the two branches. Consequently, the fusion feature weight can be obtained as:
f(X)=ω⊙X1+(1-ω)⊙Zfilter (1)where: ⊙ represents element-wise (Hadamard) multiplication, a = σ2(W2σ1(W1z)), X1 = a ⊙ X, Zfilter=1S∑i=1Syc,s, yc,s=∑i=14Wfilter,iXc,i:i+s-1 and in this study r = 8.
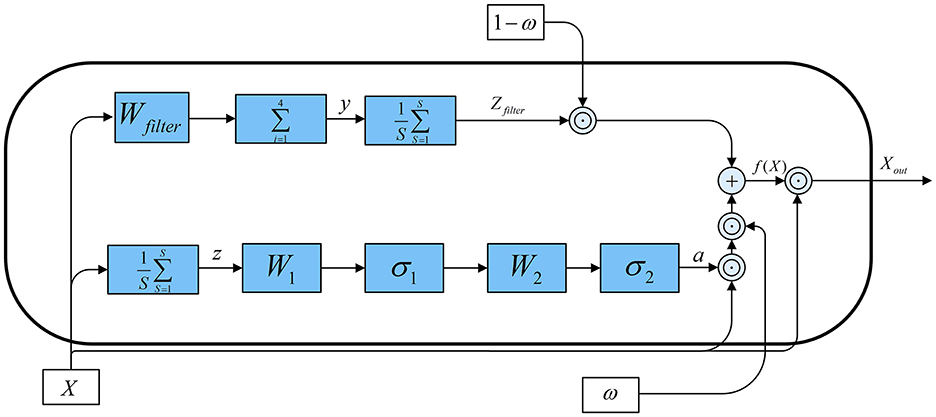
Figure 8. The architecture of the improved SE block (SECNCS).
Finally, the fused features are multiplied element-wise with the original input data to produce the final output Xout, given by:
The processed non-feature channel data, along with the original feature channel data, are merged along the channel dimension to restore the original data shape before being fed into the multi-scale convolution layer. This layer contains three parallel convolution operations: one with a kernel size of (1, 4) to capture short-range dependencies, another with a kernel size of (1, 64) to extract mid-range dependencies, and a third with a kernel size of (1, 128) to capture long-range dependencies (Tao et al., 2023). Batch normalization is applied after each convolution to ensure a stable learning process. The outputs from these convolutions are concatenated along the feature map dimension to create a unified feature map.
Subsequently, the unified feature map is processed through a pointwise convolution layer, employing a 1 × 1 convolution to integrate the three sets of feature maps from the previous multi-scale layer into one. This step reduces the dimensionality of the combined feature maps to match the number of input channels (Ko et al., 2021), followed by batch normalization and ELU activation, which contribute to maintaining network stability and effective regularization.
The final layers consist of a depthwise convolution, where a channel-wise operation is performed, followed by batch normalization, ELU activation, average pooling, and dropout. The separable convolution layer further refines the feature map through depthwise and pointwise convolutions, again followed by batch normalization, ELU activation, average pooling, and dropout. Ultimately, the processed feature map is flattened and passed through a fully connected layer for classification, with the output probabilities calculated via a softmax function (Lawhern et al., 2018).
2.4 Signal acquisitionIn this study, we conducted an SSVEP-based experiment using a custom-designed Gaitech BCI system to record EEG signals. Visual stimuli were presented on a 21.5-inch LCD monitor with a resolution of 1,920 × 1,080 pixels and a refresh rate of 60 Hz. Eight visual targets, arranged in a 3 × 3 matrix with the center target removed, were displayed to participants. To ensure precise modulation of the flickering stimuli, we employed a joint frequency-phase modulation (JFPM) method to control the sinusoidal flicker of each target. This approach allowed for accurate manipulation of both frequency and phase for the generation of SSVEP (Wang et al., 2016; Pan et al., 2022).
Ci(t)=sin(2πfit+ϕi) (3)where Ci(t) represents the contrast of the i-th target at time t, fi is the flickering frequency of the i-th target, and ϕi denotes its phase offset. The target frequencies were set at 7, 8, 9, 10, 11, 12, 13, and 15 Hz, with corresponding phase shifts ϕi distributed from 0 to 7π/4. The stimulus interface is shown in Figure 9. The following formulas represent the frequency and phase of the stimulus square at position (i, j) (Li et al., 2024).
{f1(i,j)=7+3i+j, (i,j)=(0,0),(0,1),(0,2),(1,0),(2,2)f2(i,j)=6+3i+j, (i,j)=(1,2),(2,0),(2,1)ϕ1(i,j)=π4(3i+j), (i,j)=(0,0),(0,1),(0,2),(1,0)ϕ2(i,j)=π4(3i+j-1), (i,j)=(1,2),(2,0),(2,1),(2,2) (4)
Figure 9. SSVEP experiment stimulation interface.
The participants were seated at a fixed distance of 70 cm from the monitor, ensuring optimal visibility without strain. A total of 10 healthy volunteers with normal or corrected-to-normal vision participated in the experiment (4 females and 6 males, aged between 22 and 28 years, with a mean age of 24.1 years) (Wang et al., 2016; Karas et al., 2023). Each participant had prior experience with similar experiments and provided informed consent before participation and the protocol was approved by the Biomedical Ethics Committee of Qufu Normal University (2024-126).
During the experiment, participants were required to fixate their gaze on a cued target, indicated by a static highlight for 0.5 seconds before the flickering began. Following the cue, all eight targets flickered simultaneously for 5 seconds, after which the screen was blank for 0.5 seconds before the next trial. Each trial lasted 6 seconds, and participants were instructed to avoid blinking during the 5-second stimulation period. To minimize fatigue, participants were allowed to take breaks between blocks. The sampling frequency was set to 1,000 Hz, and the data were filtered using filters from the gaitech_bci_tools package. The filtering process included a high-pass filter at 6.5 Hz, a notch filter between 47–53 Hz (remove power frequency noise), and a low-pass filter at 65 Hz. After filtering, all data were downsampled to 250 Hz. A total of 40 trials were conducted for each target. The data acquisition interface is presented in Figure 10, with two subfigures included: the parameter setting interface is shown in Figure 10A, while the experiment data preview interface is illustrated in Figure 10B.
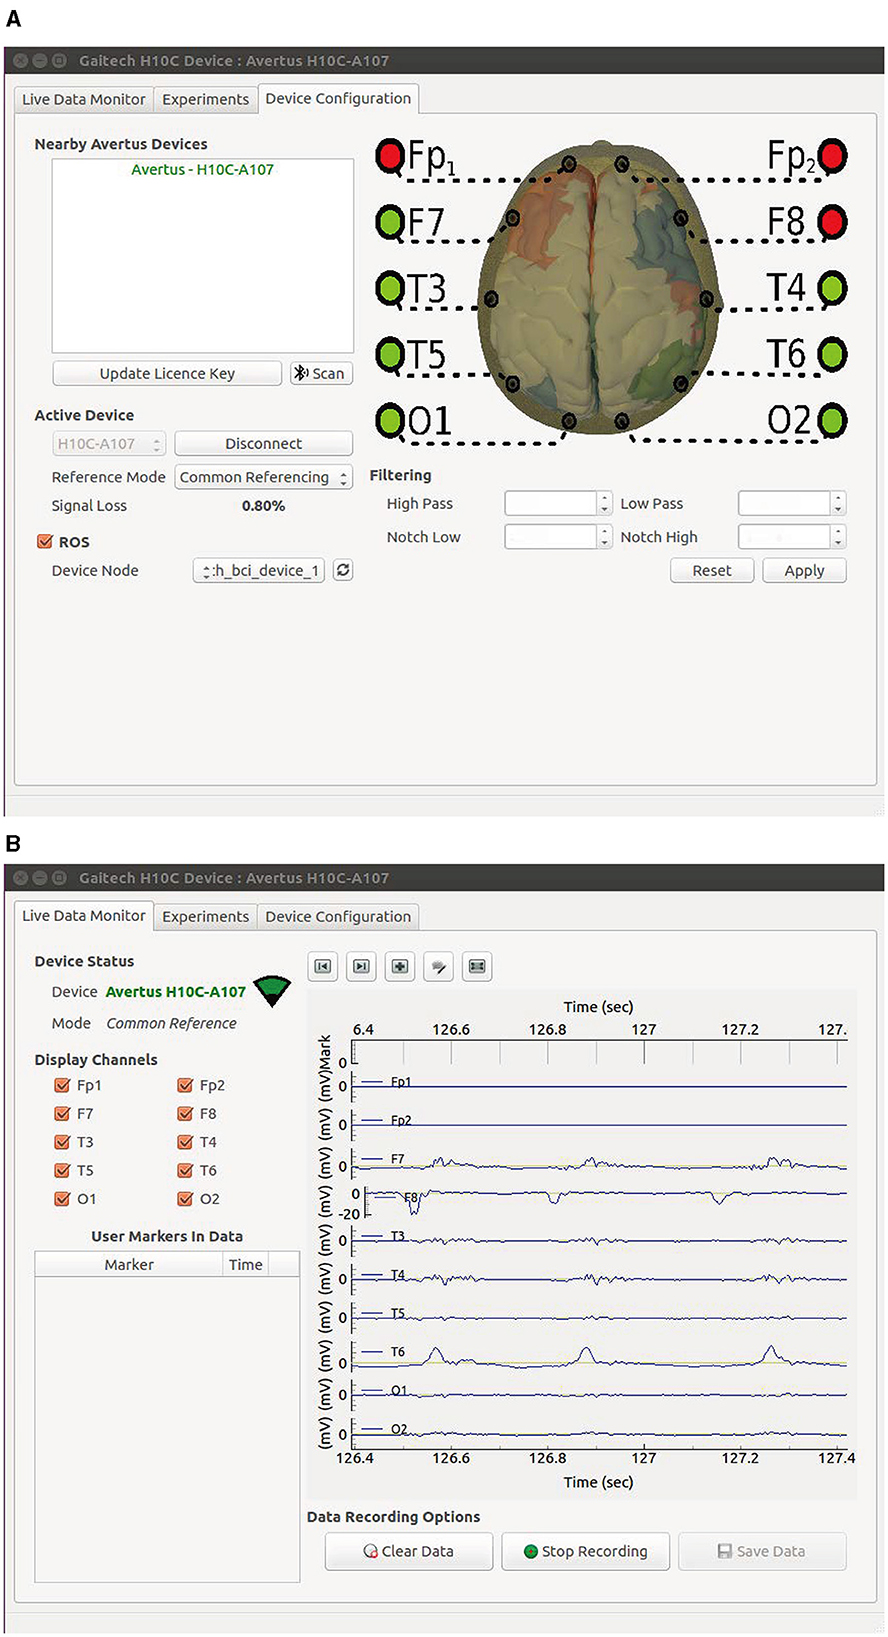
Figure 10. GUI of the Gaitech BCI system. (A) Data acquisition parameter setting interface. (B) Experiment data preview interface.
In this study, we processed each subject's data through weighted averaging. First, we computed the average of all 40 time series for each frequency file, then aggregated the results across 8 frequencies. Finally, the average of these aggregated results was calculated to obtain the subject's final time series (Wang et al., 2016). This process is represented by the following formula:
Di(t)=18∑f=18140∑n=140di,f,n(t) (5)where di,f,n(t) denotes the data at time t for the n
留言 (0)