Insects
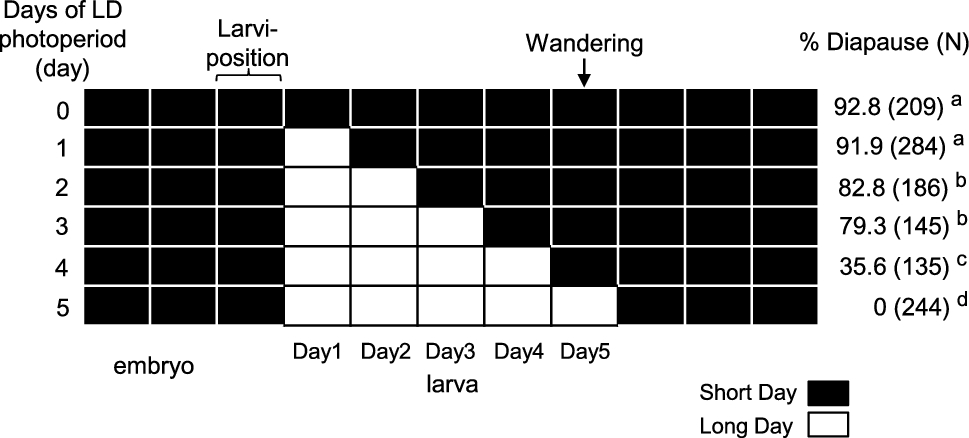
Stock cultures of S. similis originating from adults captured at the Toyonaka campus of the University of Osaka Japan (34.80° N, 135.45° E) were used. All experiments and breeding were performed at 20 ± 1.0 °C. Newly emerged adult males and females under LD (16 h light: 8 h dark) were transferred to SD (12 h light: 12 h dark) conditions on the day of adult eclosion and provisioned with water, sugar, and a piece of chicken liver. White-fluorescent bulb (4.4–7.7 Wm−2, FL15W; NEC Lighting, Tokyo, Japan) or white LED bulb (5.3–7.5 Wm−2, LT-N300N-YS; OHM ELECTRIC, Tokyo, Japan) were used for the light period. Females larviposited 14 d after liver feeding. Deposited larvae were set on a piece of chicken liver under LD or SD conditions one day after larviposition (Day1). Most larvae ceased feeding 5 d after larviposition (Day5) at the third-instar stage and left their food.
The diapause status of the pupae was determined 10 d after puparium formation. After removal of the puparium head capsule, diapause and non-diapause pupae were distinguished according to compound eye color. When a red color was detected in the eye region, the pupae were determined to be non-diapause. Those without a red color were determined to be diapause pupae (Fraenkel and Hsiao 1968).
For the hematoxylin-eosin staining, double labeling of PDF and PER immunohistochemistry, double labeling of PDF immunohistochemistry and backfills, and electrophysiology larvae deposited by females reared under LD conditions at 20 °C were used on Day5 under LD conditions.
Hematoxylin–Eosin staining
The anterior larval body, including the central nervous system (CNS; brain and thoraco-abdominal ganglia), was fixed for 24 h with an aqueous Bouin fixative at room temperature (RT: 23–28 °C). After three rinses with 70% ethanol at RT, the body was dehydrated using an ethanol series and embedded in paraffin. Paraffin blocks were cut into 8-µm sections. After deparaffinization, sections were incubated in Mayer’s hematoxylin solution (Sakura Finetek Japan, Tokyo, Japan) for 5 min at RT. After washing with tap water and DW, the sections were incubated in eosin solution (Sakura Finetek, Japan) for 3 min at RT. After washing with DW, the sections were dehydrated using an ethanol series and mounted in xylene.
Immunohistochemistry
For double labeling with PDF and PER antisera, the CNS was removed at Zeitgeber Time (ZT) 0–2 (ZT0: onset of photophase). The CNS was fixed for overnight (about 10 h) in 4% paraformaldehyde (PFA) at 4 °C. After washing with 0.1 M phosphate-buffered saline containing 0.5% Triton X-100 (PBST, pH 7.4), the CNS was incubated with 5% normal donkey serum (NDS; IHR-8135, ImmunoBioScience, Washington, USA) in PBST at RT for 3 h to block non-specific antisera binding. The CNS was incubated with goat anti-PER antiserum (1: 100, sc-398462, Santa Cruz Biotechnology, Texas, USA) and rabbit anti-PDF antiserum (1: 5,000, RRID:AB_2916037, a gift from Dr. Tomioka) as the primary antisera in 5% NDS in PBST at 4 °C for 8 d. After washing with PBST for 3 d, the CNS was incubated with 5% NDS for 1 h at RT followed by incubation with biotinylated donkey anti-goat IgG (1: 200) antiserum (705–067-003, Jackson ImmunoResearch Laboratories, Pennsylvania, USA) at 4 °C for 4 d. After washing with PBST, the CNS was processed for the amplification of PER signal using avidin–biotin complex (PK-4000, Vector Lab., California, USA) for 3 d at 4 °C. Then the CNS was incubated with streptavidin Alexa fluor 647 (1:200, S21374, Thermo Fisher Scientific, Fisher Scientific, Waltham, MA, USA) and TIRITC-labeled donkey anti rabbit IgG (1:200, A-16028, Invitrogen, Carlsbad, CA, USA) for overnight at 4 °C. After three rinses with PBST, the CNS were dehydrated using an ethanol series and cleared using methyl salicylate.
To count the PDF-ir varicosities, we sampled the CNS every 4 h from Day5 ZT12 to Day6 ZT 8 under LD and SD conditions. During the dark period the CNS was dissected under a red LED light (M-BL-E26-7W-660 nm, MS-system, Utsunomiya; approximately 390 lx). We simultaneously dissected five CNSs from SD larvae and five from LD larvae at the same time at ZT12, ZT16, ZT20, ZT24 (Day5), ZT4, and ZT8 (Day6). SD and LD CNSs were fixed with 4% PFA at RT for 4 h. The CNS was removed during the dark period and kept in the dark during fixation. After fixation, the CNSs were washed in 0.1 M PBST and kept at 4 °C until use. All samples (N = 60) collected from Day5 ZT12 to Day6 ZT 8 were processed at the same time for immunohistochemistry, from blocking before primary antibody incubation to the final step. The CNS was blocked in 5% NDS for 1 h at RT, and incubated in mouse anti-PDF antibody (1:100, RRID:AB_760350, PDF C7, DSHB, Iowa, USA) for 3 d at 4 °C. After primary antibody incubation, the CNS was washed in 0.1 M PBST and kept in the final wash at 4 °C overnight. After one wash at RT for 1 h, the CNS was blocked with 5% NDS for 1 h at RT and incubated with Alexa Fluor 488 labeled goat anti-mouse IgG (1:200, A11001, Thermo Fisher Scientific), in 5% NDS in PBST at 4 °C for 2 d. After three rinses with PBST, the CNS was dehydrated using an ethanol series and cleared using methyl salicylate.
Backfills followed by PDF immunohistochemistry
The ring gland was severed one-third from the distal end with micro-scissors, and 20 mM neurobiotin (SP-1120, Vector Lab.) was introduced through the cut end using a sharpened pipette for a unilateral backfill. Using this labeling, contralateral pars lateralis (PL-c) neurons and ipsilateral PL (PL-i) neurons were labeled unilaterally. The pipette was made from borosilicate glass capillaries (GD-1.5; Narishige, Tokyo, Japan) using a flaming/brown micropipette puller (P-97; Sutter Instruments, Novato, California, USA). Backfilling was performed for 2–3 h at RT. After backfills, the CNS was fixed with 4% PFA overnight, rinsed 3 times with 0.1 M PBST, and incubated in mouse anti-PDF antibody (1:100, RRID:AB_760350, PDF C7, DSHB) for 3 d at 4 °C. The CNS was then incubated with Alexa Fluor 488 labeled goat anti-mouse IgG (1:200, A11001, Thermo Fisher Scientific) and an avidin–biotin complex (PK-4000, Vector Lab.) at 4 °C for 1 d followed by streptavidin Alexa fluor 647 (1: 200, S21374, Thermo Fisher Scientific) for overnight at 4 °C, and then processed for dehydrated with an ethanol series and cleared with methyl salicylate.
Single-cell reverse transcription nested PCR
Single-cell reverse transcription nested PCR was performed as described by Hasebe and Shiga (2021a). We first labeled the PL-c cells of Day5 larvae under LD and SD conditions by backfills using Alexa Fluor 488 with dextran 3000 MW (D34682, Thermo Fisher Scientific) for 2–3 h at RT. PL-c cells were specified as cells stained in the brain hemisphere contralateral to the dye-filled side of the RG. Pipettes for cell collection were prepared from borosilicate glass capillaries (GD-1.5; Narishige, Tokyo, Japan) using the flaming/brown micropipette puller (P-97). Cells labeled with Alexa Fluor 488 were isolated using a pipette between ZT6 and ZT8 under an upright microscope (ECLIPSE FN1; Nikon, Tokyo, Japan) equipped with an ORCA-spark digital CMOS camera (C11440-36U; Hamamatsu Photonics, Shizuoka, Japan). A single collected cell was placed in a mixture of 4 μL of reverse transcriptase (FastGene Scriptase II cDNA Synthesis 5 × ReadyMix; NIPPON Genetics, Tokyo, Japan) and 16 μL of pure water, and reverse transcription PCR (RT-PCR) was performed to synthesize cDNA by TaKaRa PCR Thermal Cycler Dice (Takara Bio, Shiga, Japan). PCR mix solution was prepared with 1 μL of template cDNA, 12.5 μL KAPATaq Extra Hot Start ReadyMix with dye (Kapa Biosystems-Roche, Basel, Switzerland), 0.25 μL forward primers (20 μM), 0.25 μL reverse primers (20 μM) and 11 μL pure water, and then PCR was performed. The primary and secondary PCRs were performed by an initial heat denaturation at 95 °C for 3 min and 35 cycles of denaturation at 95 °C for 30 s, 48 °C for 30 s, and 72 °C for 40 s. One microliter of the reverse transcription reaction solution was used as template cDNA in the primary PCR. One microliter of the primary PCR solution was used as the template DNA in the secondary PCR. After the nested PCR, electrophoresis was performed on 1.5% agarose gel using submarine electrophoresis device MARINE23ST (FUJIFILM Wako Pure Chemical Corporation, Osaka, Japan). For electrophoresis, a 50 bp DNA ladder (NE-MWD50, Nippon Genetics) was used to measure the length of the PCR products. Agarose gels were incubated in Midori Green Advance solution (NE-MG04; Nippon Genetics) for at least 60 min. Using the Gel Documentation System AE-6932GXCF with a CCD camera Controller AE-6905CF (ATTO Corporation, Tokyo, Japan), we photographed the PCR product bands in the agarose gels. Target gene sequences were searched in the S. similis RNA-Seq database using tBLASTn (https://blast.ncbi.nlm.nih.gov/Blast.cgi?PROGRAM=tblastn&PAGE_TYPE=BlastSearch&LINK_LOC=blasthome) and ORF Finder (https://www.ncbi.nlm.nih.gov/orffinder/) using D. melanogaster amino acid sequences (Table 1). Primer3 (https://primer3.ut.ee/) and ApE-A plasmid Editor v2.0.61 (Davis and Jorgensen 2022) were used to create primer sets for primary and secondary reverse transcription nested PCR (Table 2).
Table 1 The contig list of Sarcophaga similisTable 2 The primer list for reverse transcription nested PCRElectrophysiological analysis of neurotransmitter perfusion effects on PL-c neuronal activities
We recorded the electrophysiological activity of PL-c neurons. After fluorescently labeling the PL-c neurons with backfill, the larvae were dissected at ZT8. The whole brain was carefully moved into a handmade recording chamber (Hasebe & Shiga 2021b). The recording chamber was filled with a fly extracellular solution (ion components: 101 mM NaCl, 3.0 mM KCl, 1.0 mM CaCl2, 4.0 mM MgCl2・6 H2O, 5.0 mM glucose, 1.25 mM NaH2PO4・2 H2O, and 20.7 mM NaHCO3, pH was adjusted to approximately 7.2 with NaOH) (Flourakis et al. 2015). Recording pipettes were made from borosilicate glass capillaries (GD-1.5, Narishige) using the flaming/brown micropipette puller (P-97, Sutter Instruments). Recording pipettes were filled with a normal intracellular pipette solution (ion components:130 mM K+-gluconate, 4.0 mM NaCl, 1.0 mM MgCl2∙6 H2O, 0.5 mM CaCl2, 10 mM EGTA, and 10 mM HEPES, pH 7.2, adjusted with KOH) (Hasebe and Shiga 2022, 2021a), and tip resistance of recording pipettes was approximately 5–11 MΩ. PL-c neurons labeled with Dextran Alexa Fluor 488; 3,000 MW (D34682, Thermo Fisher Scientific) were detected under an upright microscope with a mercury lamp fluorescence irradiation device (ECLIPSE FN1, Nikon) and an ORCA-spark digital CMOS camera (C11440-36U, Hamamatsu Photonics). The recording pipette approached the fluorescently labeled PL-c cells. We formed a giga seal by applying negative pressure and then broke the cell membrane using a zap voltage pulse in the whole-cell patch clamp mode. We recorded the spontaneous firing of PL-c neurons in a current clamp mode. Electrophysiological recordings were performed using an Axopatch 200 B, Digidata 1550 B, and pCLAMP 11.0.3 software (Molecular Devices, Sunnyvale, CA, USA).
Perfusion of each neurotransmitter was performed using a Peristaltic Pump/MINIPULS 3 (M&S Instruments Inc., Osaka, Japan). After 6 min or more baseline recording, we perfused 1 µM PDF peptide NSELINSLLSLPKNMNDA-NH2 (APREST88038, MERCK, Darmstadt, Germany) or 1 µM short-neuropeptide F (sNPF1) AQRSPSLRLRF-NH2 (GenScript, Tokyo, Japan), the sequence of which corresponds to the predicted S. similis PDF or S. similis sNPF (Table 1), or 1 mM L-glutamic acid monosodium salt hydrate solution (L-glutamate, G1626, Sigma-Aldrich, St. Louis, MO, USA) for 2 min. The perfusion concentration for PDF was based on Gestrich et al. (2018). Subsequently, the normal fly extracellular solution was perfused for washout. We calculated the instantaneous frequency and number of firing at 0.5 min to 2.0 min before the neurotransmitter perfusion as “Before.” The instantaneous frequency and number of firing at 0.5 min to 2.0 min after the PDF, sNPF1 and L-glutamate perfusion were calculated as “PDF”, “sNPF1” and “L-Glutamate,” respectively, and those at 8.5 min to 10 min after the start of wash-out were calculated as “Wash-out.” Electrophysiological data were analyzed using the Clampfit software version 10.7 (Molecular Devices, Sunnyvale, CA, USA).
Microscopy
Fluorescent images were acquired using a confocal laser scanning microscope (LSM 710; Carl Zeiss, Oberkochen, Germany) equipped with an objective lens (EC Plan-Neofluar 20 × /0.50 M27 and Plan-Apochromat 63 × /1.4 oil DIC M27, Carl Zeiss). Alexa Fluor 488 and TRITC were excited using an argon laser (488 nm) and Alexa Fluor 647 was excited using a red HeNe laser (633 nm). The emission wavelengths were set at 523 nm for Alexa 488, 562 nm for TRITC, and 697 nm for Alexa 647. Optical sections were reconstructed using an image processing software (Zen 3.5, Carl Zeiss). For three-dimensional reconstruction, laser scanning microscopy images were processed using image-processing software (Amira 2019, Thermo Fisher Scientific). Double labeled processes of the two types of neurons were manually segmented. The generated surface and surface views were used for the 3D reconstruction.
Counting of PDF-immunoreactive varicosities
We examined the number of varicosities using the multi-point tool in ImageJ software (Wayne Rasband, National Institute of Health, Bethesda, MD, USA). First, the labeled samples were named randomly such that the inspector was blinded to the ZT and photoperiodic conditions of the sample. The inspector counted the varicosities in each slice of the sample. To avoid double counting of the same varicosity, each counted varicosity was labeled with a dot with a number. The same investigator conducted blind counting twice for each sample. If there was a difference in the number between the first and second counts of more than 10% of the first count, the third count was performed. When the difference between the third and first counts was less than 10% of the first count, or the difference between the third and second was less than 10% of the second count, we stopped counting. The average number of the two counts with 10% or less difference was calculated. With this method, there was no fourth count.
Statistical analysis
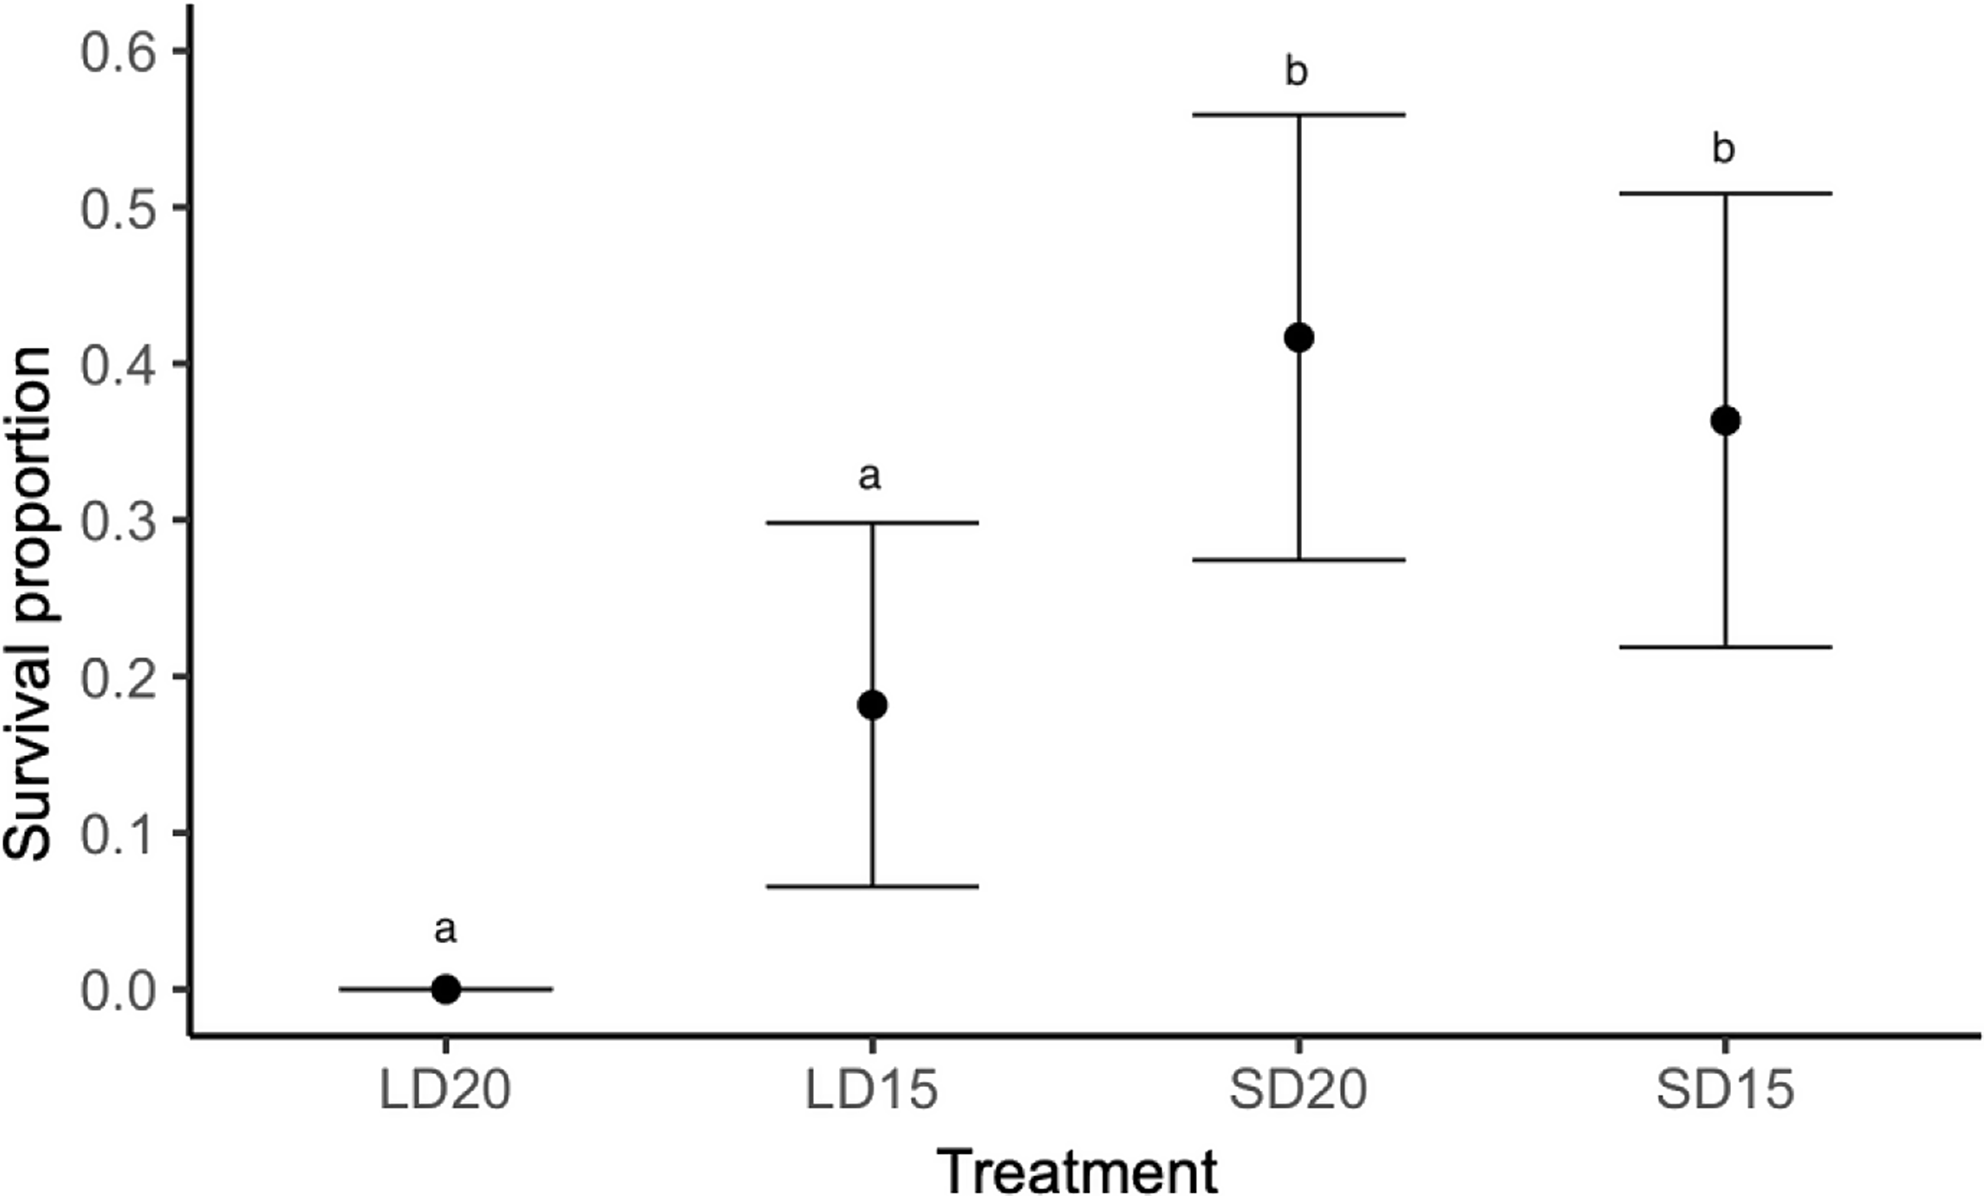
For comparison of diapause incidences, we performed Tukey’s multiple comparisons for proportions using Excel TOUKEI ver.7 (ESUMI Co., Ltd., Tokyo, Japan). For electrophysiological data analyses, we used Kyplot 6 software (KyensLab, Tokyo, Japan). We first checked whether the data was normally distributed by Shapiro–Wilk test. Then, for comparisons between multiple groups where the data are normally distributed, Tukey test was performed. For data comparisons that were not normally distributed, Steel–Dwass test was performed. For Comparison of varicosity numbers, we performed two-way ANOVA with Student’s t-test with Holm correction by Excel TOUKEI ver.7. P < 0.05 was set as statistically significant.


留言 (0)