Leishmaniasis, a vector-borne disease caused by protozoan parasites of the genus Leishmania, can lead to a spectrum of severe immunopathologies ranging from self-healing cutaneous leishmaniasis (CL) to fatal visceral leishmaniasis (VL). The severity of the disease depends on the parasite and vector species as well as host traits. CL is the most common form, with an estimated 0.6 to 1 million new cases annually (Ruiz-Postigo et al., 2021). Combating the disease is challenging due to the complex and interactive factors involved in the transmission cycle of the parasite in human hosts, vectors, and reservoirs (Bañuls et al., 2011). A holistic approach, such as transcriptome analysis, may offer valuable insights into understanding the complexity of CL in different human populations (Masoudzadeh et al., 2020a). Although transcriptome profiles of CL patients infected by species such as L. braziliensis (Amorim et al., 2019), L. amazonensis (Christensen et al., 2019), and L. tropica (Masoudzadeh et al., 2020b) have been reported, the precise molecular mechanism involved in the regulatory network of human CL has not yet been fully elucidated.
Long non-coding RNAs (lncRNAs) are emerging as a new regulator of mammalian immune responses during host–pathogen interactions (Zhang et al., 2019; Statello et al., 2021). They are a heterogeneous class of non-coding RNA molecules with a length greater than 200 base pairs (Mattick et al., 2023), which can modulate gene expression by acting as decoys, guides, scaffolds, or sponges (Wang and Chang, 2011). The tissue-specific expression patterns of most lncRNA genes suggest that their expression is highly regulated during development and pathogenesis. Moreover, dysregulated lncRNA signatures have been found to be involved in the pathogenesis of various diseases (DiStefano, 2018; Kopp and Mendell, 2018). More recent evidence has also suggested a potential role of lncRNAs in the development and progression of leishmaniasis caused by different Leishmania species (Fernandes et al., 2022; Maruyama et al., 2022; Almeida et al., 2023). However, the involvement of lncRNAs in the regulation of human skin response to CL caused by L. tropica has not been thoroughly investigated.
In the current study, a co-expression network of lncRNA and mRNA genes [retrieved from our RNA sequencing (RNA-seq) dataset] was constructed by the weighted gene correlation network analysis (WGCNA) algorithm (Langfelder and Horvath, 2008) to infer the potential role of lncRNAs in the skin lesions of CL caused by L. tropica. The WGCNA of integrated coding and non-coding gene data linked lncRNAs with unknown functions to biological processes through determining correlated lncRNA and mRNA pairs. Using quantitative real-time polymerase chain reaction (qRT-PCR), we validated several identified potential hub genes specifically associated with CL. These results unveil new insights into the integrated regulatory networks (lncRNAs–mRNAs) involved in the transcriptional alterations induced by L. tropica in human skin and can inform the identification of novel potential targets for effective intervention strategies.
2 Materials and methods2.1 Data collectionWe utilized our previously published RNA-seq data from CL patients infected with L. tropica. The data are available on the NCBI Gene Expression Omnibus (GEO) database under accession number GSE216638 (Masoudzadeh et al., 2020b). Briefly, skin biopsy samples were collected from 6 healthy volunteers and 16 L. tropica-infected CL patients dermatologically classified into two groups: 7 ulcerative CLs (UCLs) and 9 non-ulcerated CLs (NUCLs).
2.2 RNA−seq data analysisRNA-seq data from UCL and NUCL patients were analyzed as described previously (Masoudzadeh et al., 2020b). To summarize, the clean reads (FASTQ) data were aligned to the human genome (hg19/GRCh38) using the Star tool (Dobin et al., 2013). Then, to determine the mRNA and lncRNA genes in the included RNA-seq data, human gene transfer format (GTF) files downloaded from Ensembl (http://asia.ensembl.org) were used to annotate genes in each sample by HTSeq (Anders et al., 2015). The R package DESeq2 (Love et al., 2014) was used to find the differentially expressed lncRNA gene list between patients and the healthy groups. The adjusted p-value <0.05 was considered statistically significant. Up- and downregulated differentially expressed genes (DEGs) were defined by the criteria of log2 |fold change (FC)| > 1.
To identify the shared and specific lncRNA and mRNA genes, a Venn diagram was generated using the VennDiagram (v.1.7.3) package in R (v 4.1.1, https://www.r-project.org/) (Team R and Team RC, 2018). To show significantly expressed lncRNA and mRNA genes, volcano plots were generated by ggplot2 (v 3.3.5) and ggrepel (v 0.9.1) packages.
2.3 Weighted gene correlation network analysisWGCNA was used to explore network modules highly associated with our clinical traits. For WGCNA analysis, we screened mRNA and lncRNA gene lists by focusing only on statistically significant genes (adjusted p-value < 0.05). Subsequently, we identified the lists of significant genes common to both clinical forms of CL, UCLs and NUCLs, and visualized the results using a Venn diagram. The shared significantly expressed lncRNA and mRNA genes were prioritized for making a coding–non-coding gene co-expression network using the WGCNA R package (v1. 70-3) (Langfelder and Horvath, 2008). We integrated the lncRNA and mRNA data to find the correlations between them and subsequently detect hub lncRNA genes. The hclust function of WGCNA was used to identify outlier samples in the included data (22 samples). A signed weighted correlation matrix considering Pearson’s correlations between the selected genes across all the samples (22 samples) was computed using an optimal soft threshold of β = 15 (scale-free R2 = 0.91). The disease-specific adjacency matrices were transformed into the topological overlap matrix (TOM). Then, the topological overlap dissimilarity matrix (1-TOM) value was computed to generate a hierarchical clustering tree. Finally, the WGCNA cutreeDynamic function was used to identify the consensus co-expressed gene network modules with a minimum module size of 25 and a deep Split of two. The mergeCutHeight parameter of modules was also set according to the dissimilarity of calculated module eigengenes (MEs), which is the first principal component of the principal component analysis of gene expression profile in a module.
2.3.1 Identification of key modules, hub genes, and cis- and trans-interactionsTwo subsequent analyses were conducted to identify the key module in CL patients. The correlation between the ME and UCL–NUCL (common genes between UCL and NUCL) as the clinical trait was calculated to find a module–trait association. Modules with an absolute correlation of >0.6 and p < 0.05 were selected for subsequent analysis. At the next level, to detect key modules (or significant modules), Pearson’s correlation of gene significance (GS) and module membership (MM) for each filtered module was calculated. MM defines the correlation between the gene expression profile and the ME. GS refers to the correlation between the gene expression profile and clinical traits. The module with the highest statistically significant absolute correlation value was determined as the key module. Following that, Cytoscape (v3. 9) was used to visualize the genes’ network of key modules (the threshold for connectivity weight was set to 0.3) (Kohl et al., 2011).
To screen out the DE mRNA hub genes, regarded as topologically and functionally the more significant genes than other genes in the key modules, we set a minimum threshold for these two parameters, genes with |GS | > 0.6 and MM > 0.6 plus having the highest value for degree in the genes’ network of the modules (intra-modular connectivity). In addition, we selected the hub DE lncRNAs in the key module based on the above criteria for selecting hub mRNAs and interacting with at least one of the selected hub mRNAs in the previous step. To visualize the selected hub genes, heatmap plots were constructed using the pheatmap R package (v1.0.12) (Kolde, 2012). Next, to provide more in-depth information on the molecular function of selected hub lncRNAs, subcellular localization was predicted using the sequence-based web tool of LightGBM_LncLoc (Lyu et al., 2023).
In order to explore the potential functions of the identified DE lncRNAs and regulatory relationships between lncRNAs and mRNAs in the key module, cis- and trans-targets of the DE lncRNAs were investigated through the positional relationship and expression correlation, respectively. Protein-coding genes that matched our co-expressed genes and positioned within a genomic window of 100 kb upstream and downstream of DE lncRNAs were used to investigate the probable cis-target of DE lncRNAs in the key module. Prediction of trans-target genes of lncRNA was based on the correlation value of co-expressed DE lncRNA–mRNA pairs (|r| > 0.95) in the key module. Furthermore, the interactions of hub lncRNAs with transcription factors (TFs) were predicted using the RNAInter database (Lin et al., 2020).
2.4 Gene ontology and pathway enrichment analysisTo explore the main biological processes driven by the key module with hub genes, gene ontology (GO) on the basis of biological process and Reactome pathway enrichment analysis (Fabregat et al., 2017) were performed. ClueGo plugins in Cytoscape were used to visualize the enrichment results in a network-based manner. The enrichment result with a p-value < 0.05 was considered statistically significant.
2.5 Sample collectionThe CL patients were selected from the clinic at Mashhad Medical School in Mashhad, Iran, which is a highly endemic area for L. tropica. None of the patients had received anti-leishmanial treatment. Sample collection for diagnosis was done using a non-invasive tape disc-based sampling method as described elsewhere (Taslimi et al., 2017). All CL patients had active lesions for a maximum of 1 year and tested positive for L. tropica by specific PCR tests. Two PCR tests were conducted to determine the species of Leishmania: the first targeted the Leishmania kDNA minicircle and the second employed the ITS1 genes (Taslimi et al., 2017).
Skin biopsy samples from 28 participants, 18 CL patients and 10 healthy controls, were taken (Supplementary Table S1) and promptly stored at −80°C in RNA later (Qiagen GmbH, Hilden, Germany). The healthy skin samples were obtained from volunteers undergoing esthetical surgery at Tehran’s Noor Eye Hospital, who had no history of leishmaniasis or any other skin problems.
2.6 Quantitative real-time RT-PCRTo validate RNA-seq data, the expression of selected mRNA and lncRNA genes was assessed using the qRT-PCR method. Total RNA was extracted from skin biopsy samples using a total RNA extraction mini kit (Pars tous, Cat. No. A101231, Iran) according to the manufacturer’s instructions. For genomic DNA removal, RNA was treated with DNase I (Ambion, Cat. No. AM1906, USA) and then cDNA synthesis was performed by High-Capacity cDNA Reverse Transcription Kits (Applied Biosystems, Cat. No. 4368813, USA) following the manufacturer’s instructions. qRT-PCR was performed by the QuantiFast SYBR Green PCR Kit (Qiagen, Cat. No. 204056, GmbH, Hilden, Germany) in the ABI Real-time PCR Detection System (Applied Biosystems, CA, USA). The primer sequences are shown in Supplementary Table S2.
2.7 Statistical analysisThe ΔΔCT method was used to analyze relative gene expression, with human GAPDH serving as the endogenous control. To compare the differences between the two groups, we used the Mann–Whitney U test. A p-value of less than 0.05 was considered statistically significant. All analyses were performed using GraphPad Prism 8.0 (GraphPad Software Inc. CA, USA).
3 Results3.1 Identification of differentially expressed lncRNAs and mRNAsBased on our analysis, a total of 1,533 lncRNAs were identified as significantly expressed genes. The heatmap plot (Figure 1) depicts that the expression pattern of annotated lncRNAs is distinct between CL groups (UCL and NUCL) and healthy groups. However, there is no clear distinction between UCL and NUCL groups. In the UCL group compared to the healthy group, 1,260 and 1,765 statistically significant expressed genes (adjusted p-value <0.05) were annotated as lncRNA and mRNA genes, respectively (Supplementary Table S3). Among the lncRNA gene list, the differential analysis revealed that the expression of 546 genes was increased and that of 554 genes was decreased (Figure 2A), whereas in the mRNA group, 736 and 787 genes were determined as up- and downregulated genes, respectively (Figure 2B).
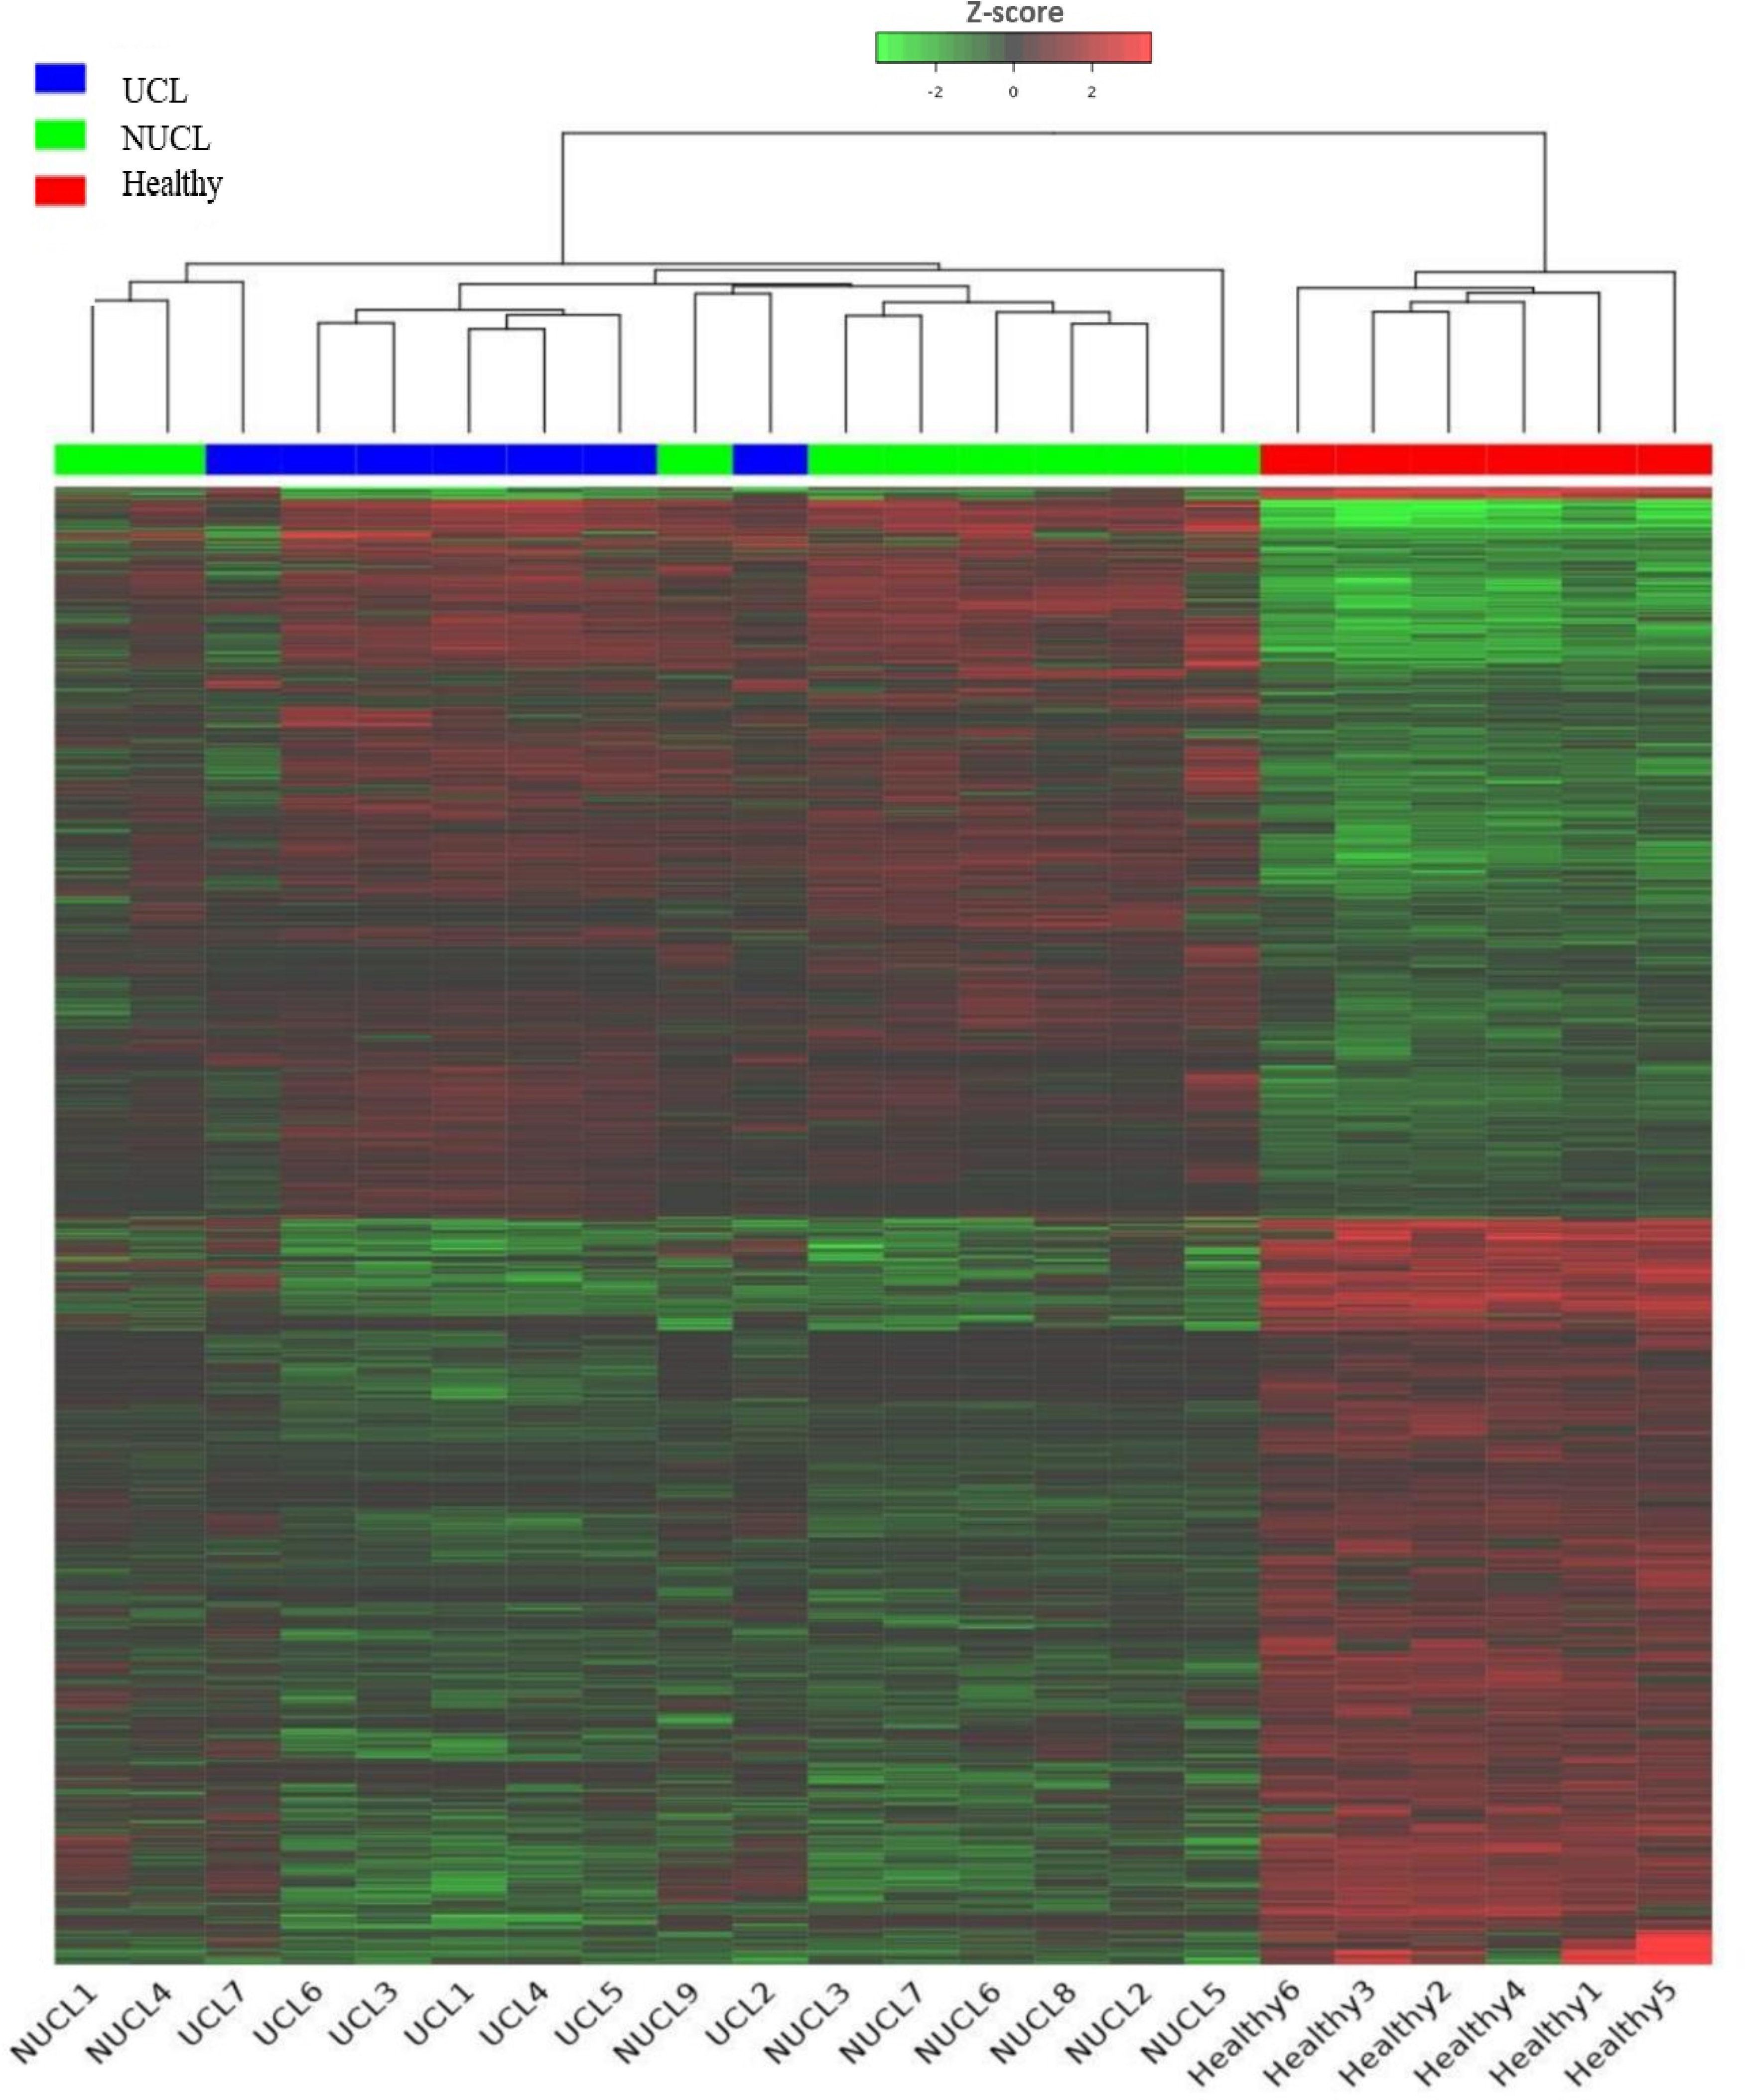
Figure 1. Heatmap showing the expression of all lncRNA genes in CL patients and healthy groups. Each column represents a sample; each row represents an lncRNA. The group belongings are indicated at the top UCL (blue), NUCL (green), and healthy groups (red). Z scores of cpm read counts were used, and the color scale corresponds to the score and represents the level of expression of the lncRNAs hierarchically grouped. Green indicates lower expression, whereas red indicates higher expression.
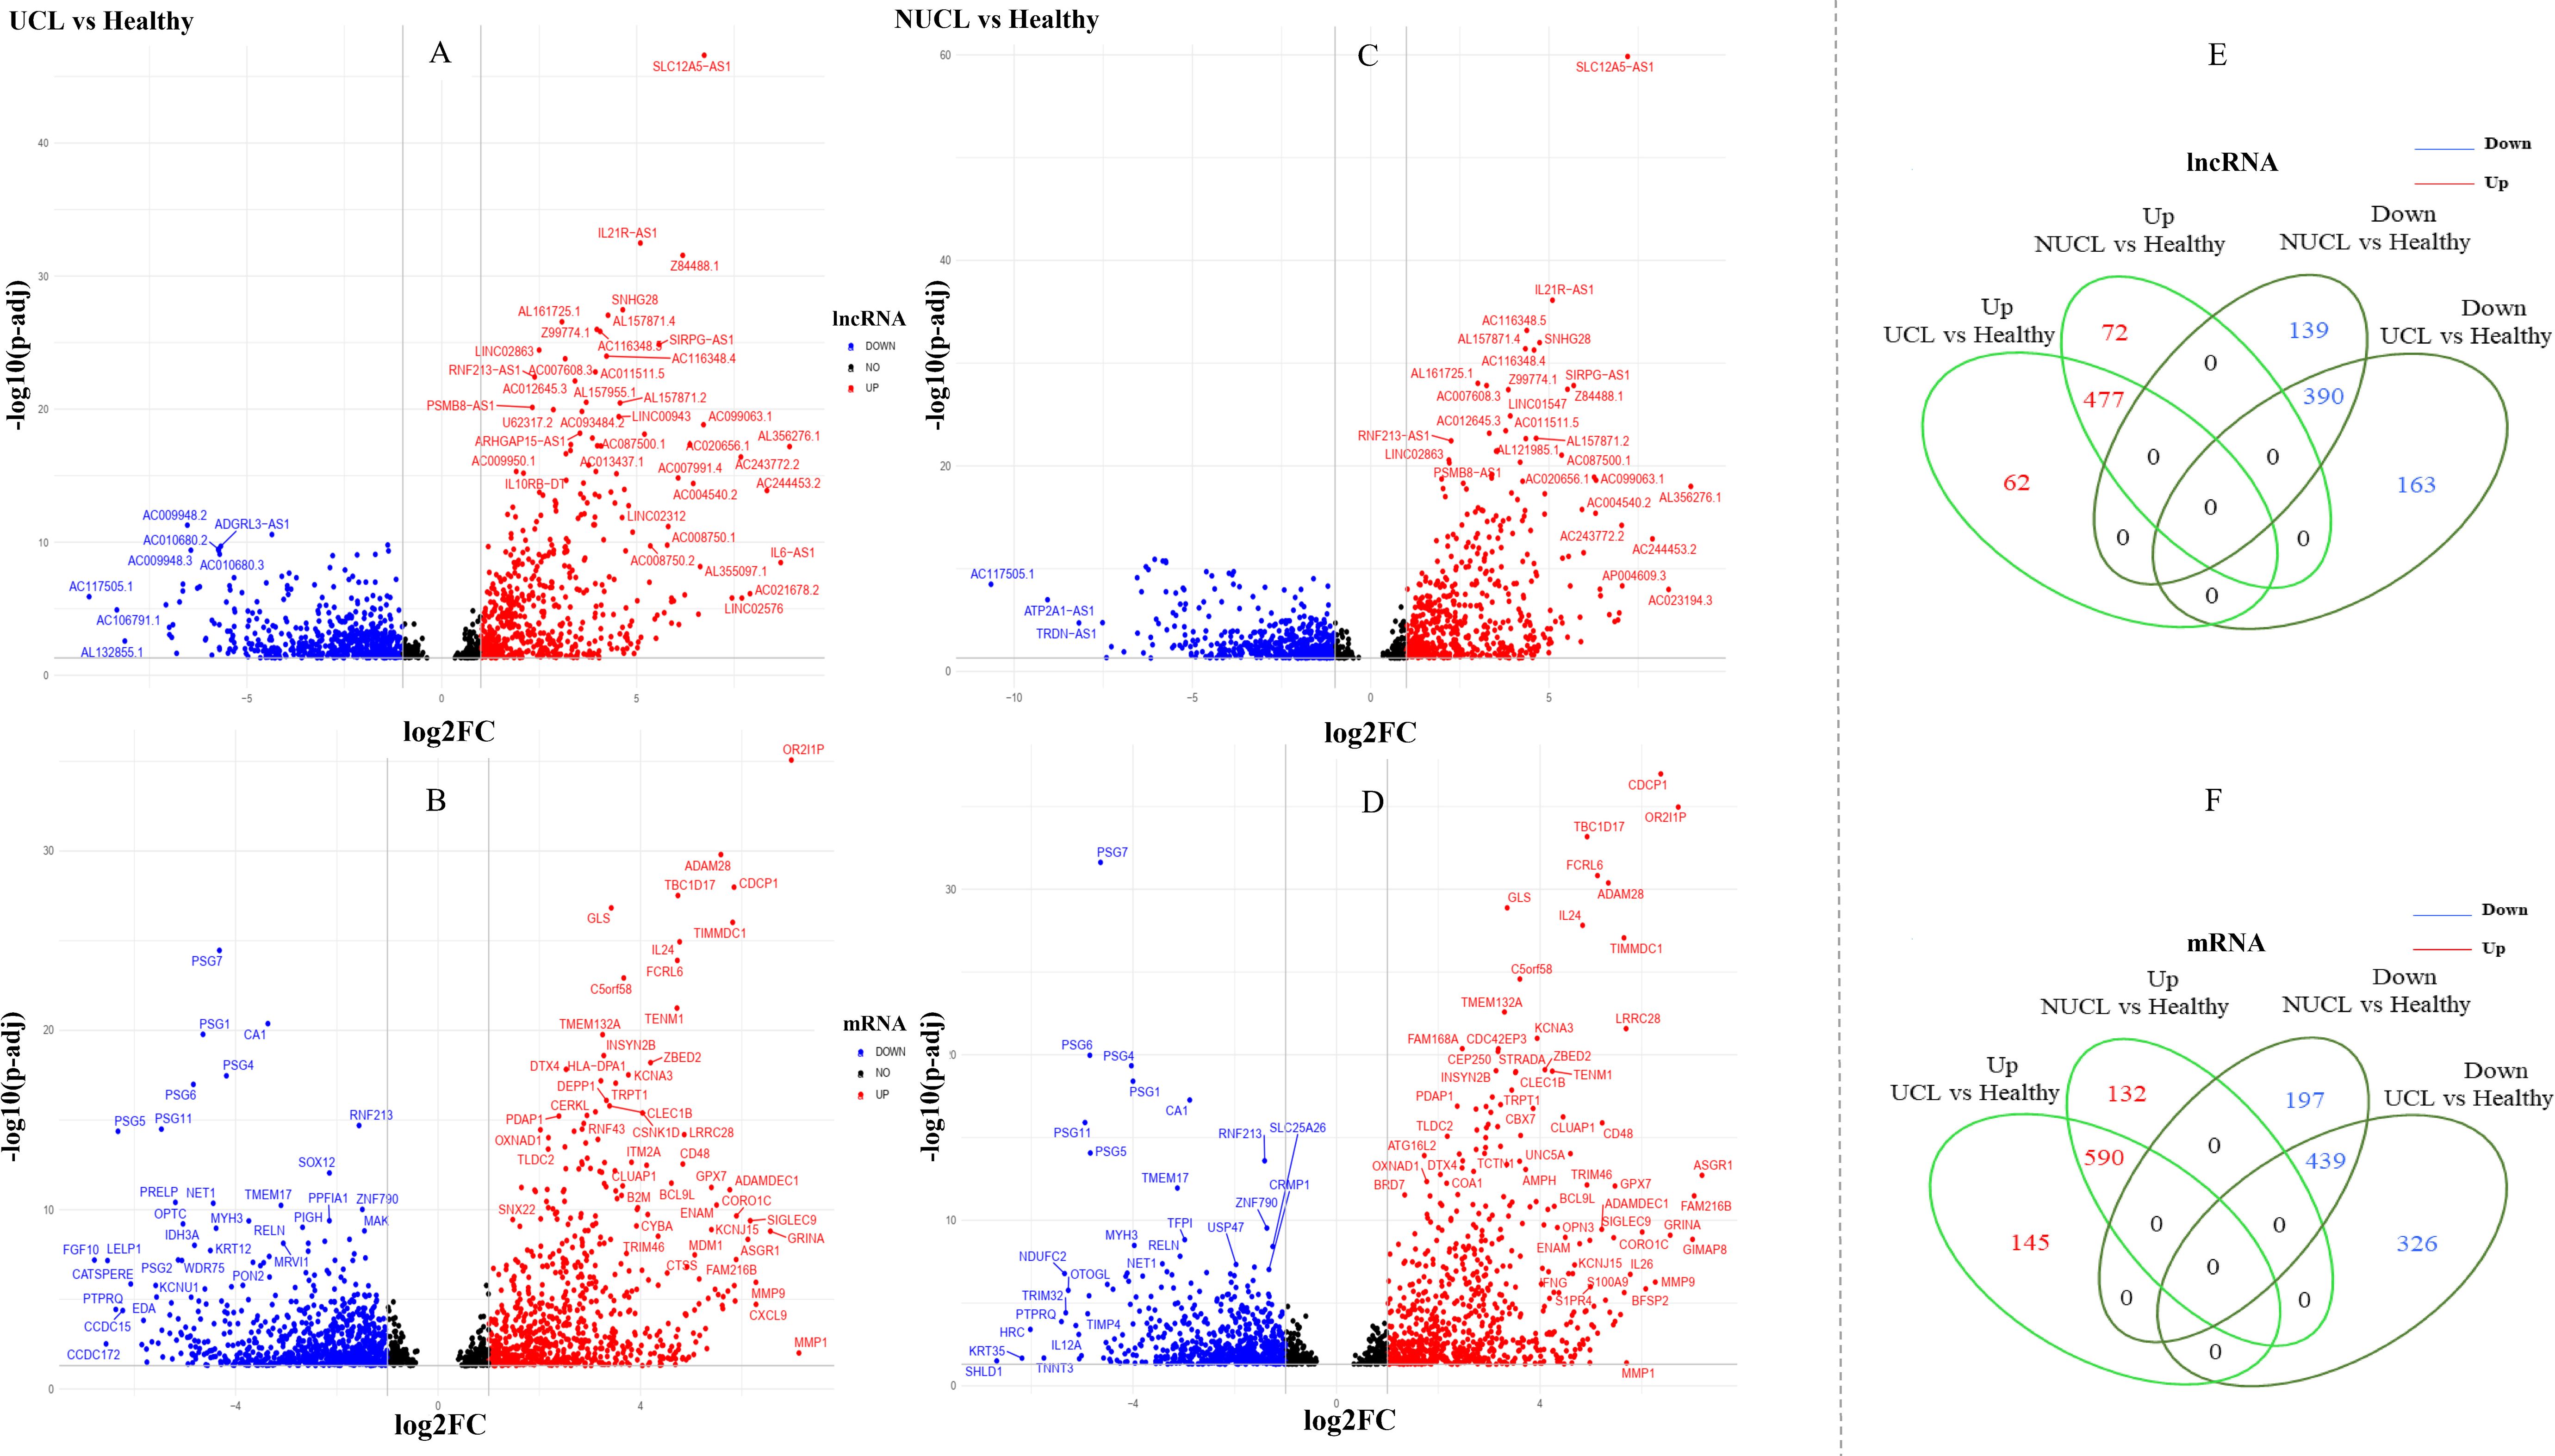
Figure 2. Differential expression gene analysis. (A–D) show volcano plots of the expressed mRNAs and lncRNAs in two groups, UCL and NUCL, when compared to a healthy group. The X-axis displays Log2FC, while the Y-axis shows −log10 of an adjusted p-value. (E, F) show a Venn diagram of the expressed lncRNAs and mRNAs between the two groups, UCL and NUCL. FC, fold change; UCL, ulcerative CL; NUCL, non-ulcerated CL.
In the NUCL group versus the healthy group, a total of 1,240 statistically significant expressed genes (adjusted p-value <0.05) were identified as lncRNA genes, in which 549 and 529 genes were up- and downregulated, respectively (Figure 2C). Additionally, 1,606 genes were annotated as mRNAs, with 722 upregulated and 636 downregulated genes being identified (Figure 2D).
The Venn diagram showed that there are obvious shared genes between the two patient groups (UCL and NUCL) encompassing 967 lncRNAs and 1,192 mRNAs. Among shared lncRNA genes, 477 and 390 genes were up- and downregulated, respectively (Figure 2E), while 590 and 439 up- and downregulated genes were identified among shared mRNA genes, respectively (Figure 2F). The RNA-seq datasets of each patient group also revealed unique expressed lncRNAs and mRNAs as compared to healthy samples (Figures 2E, F; Supplementary Table S3).
3.2 Co-expression network construction and module identificationNext, we assessed potential co-expression networks and modules formed by shared DEGs (adjusted p-value < 0.05) that are common between the two clinical forms of CL, i.e., UCL and NUCL. After identifying the shared DE lncRNAs and mRNAs, WGCNAs on the whole transcriptome data were performed to explore the co-expressed gene networks as well as mRNAs and lncRNAs of interest. The parameter analysis related to WGCNA of consensus genes is presented in Figures 3A, B.
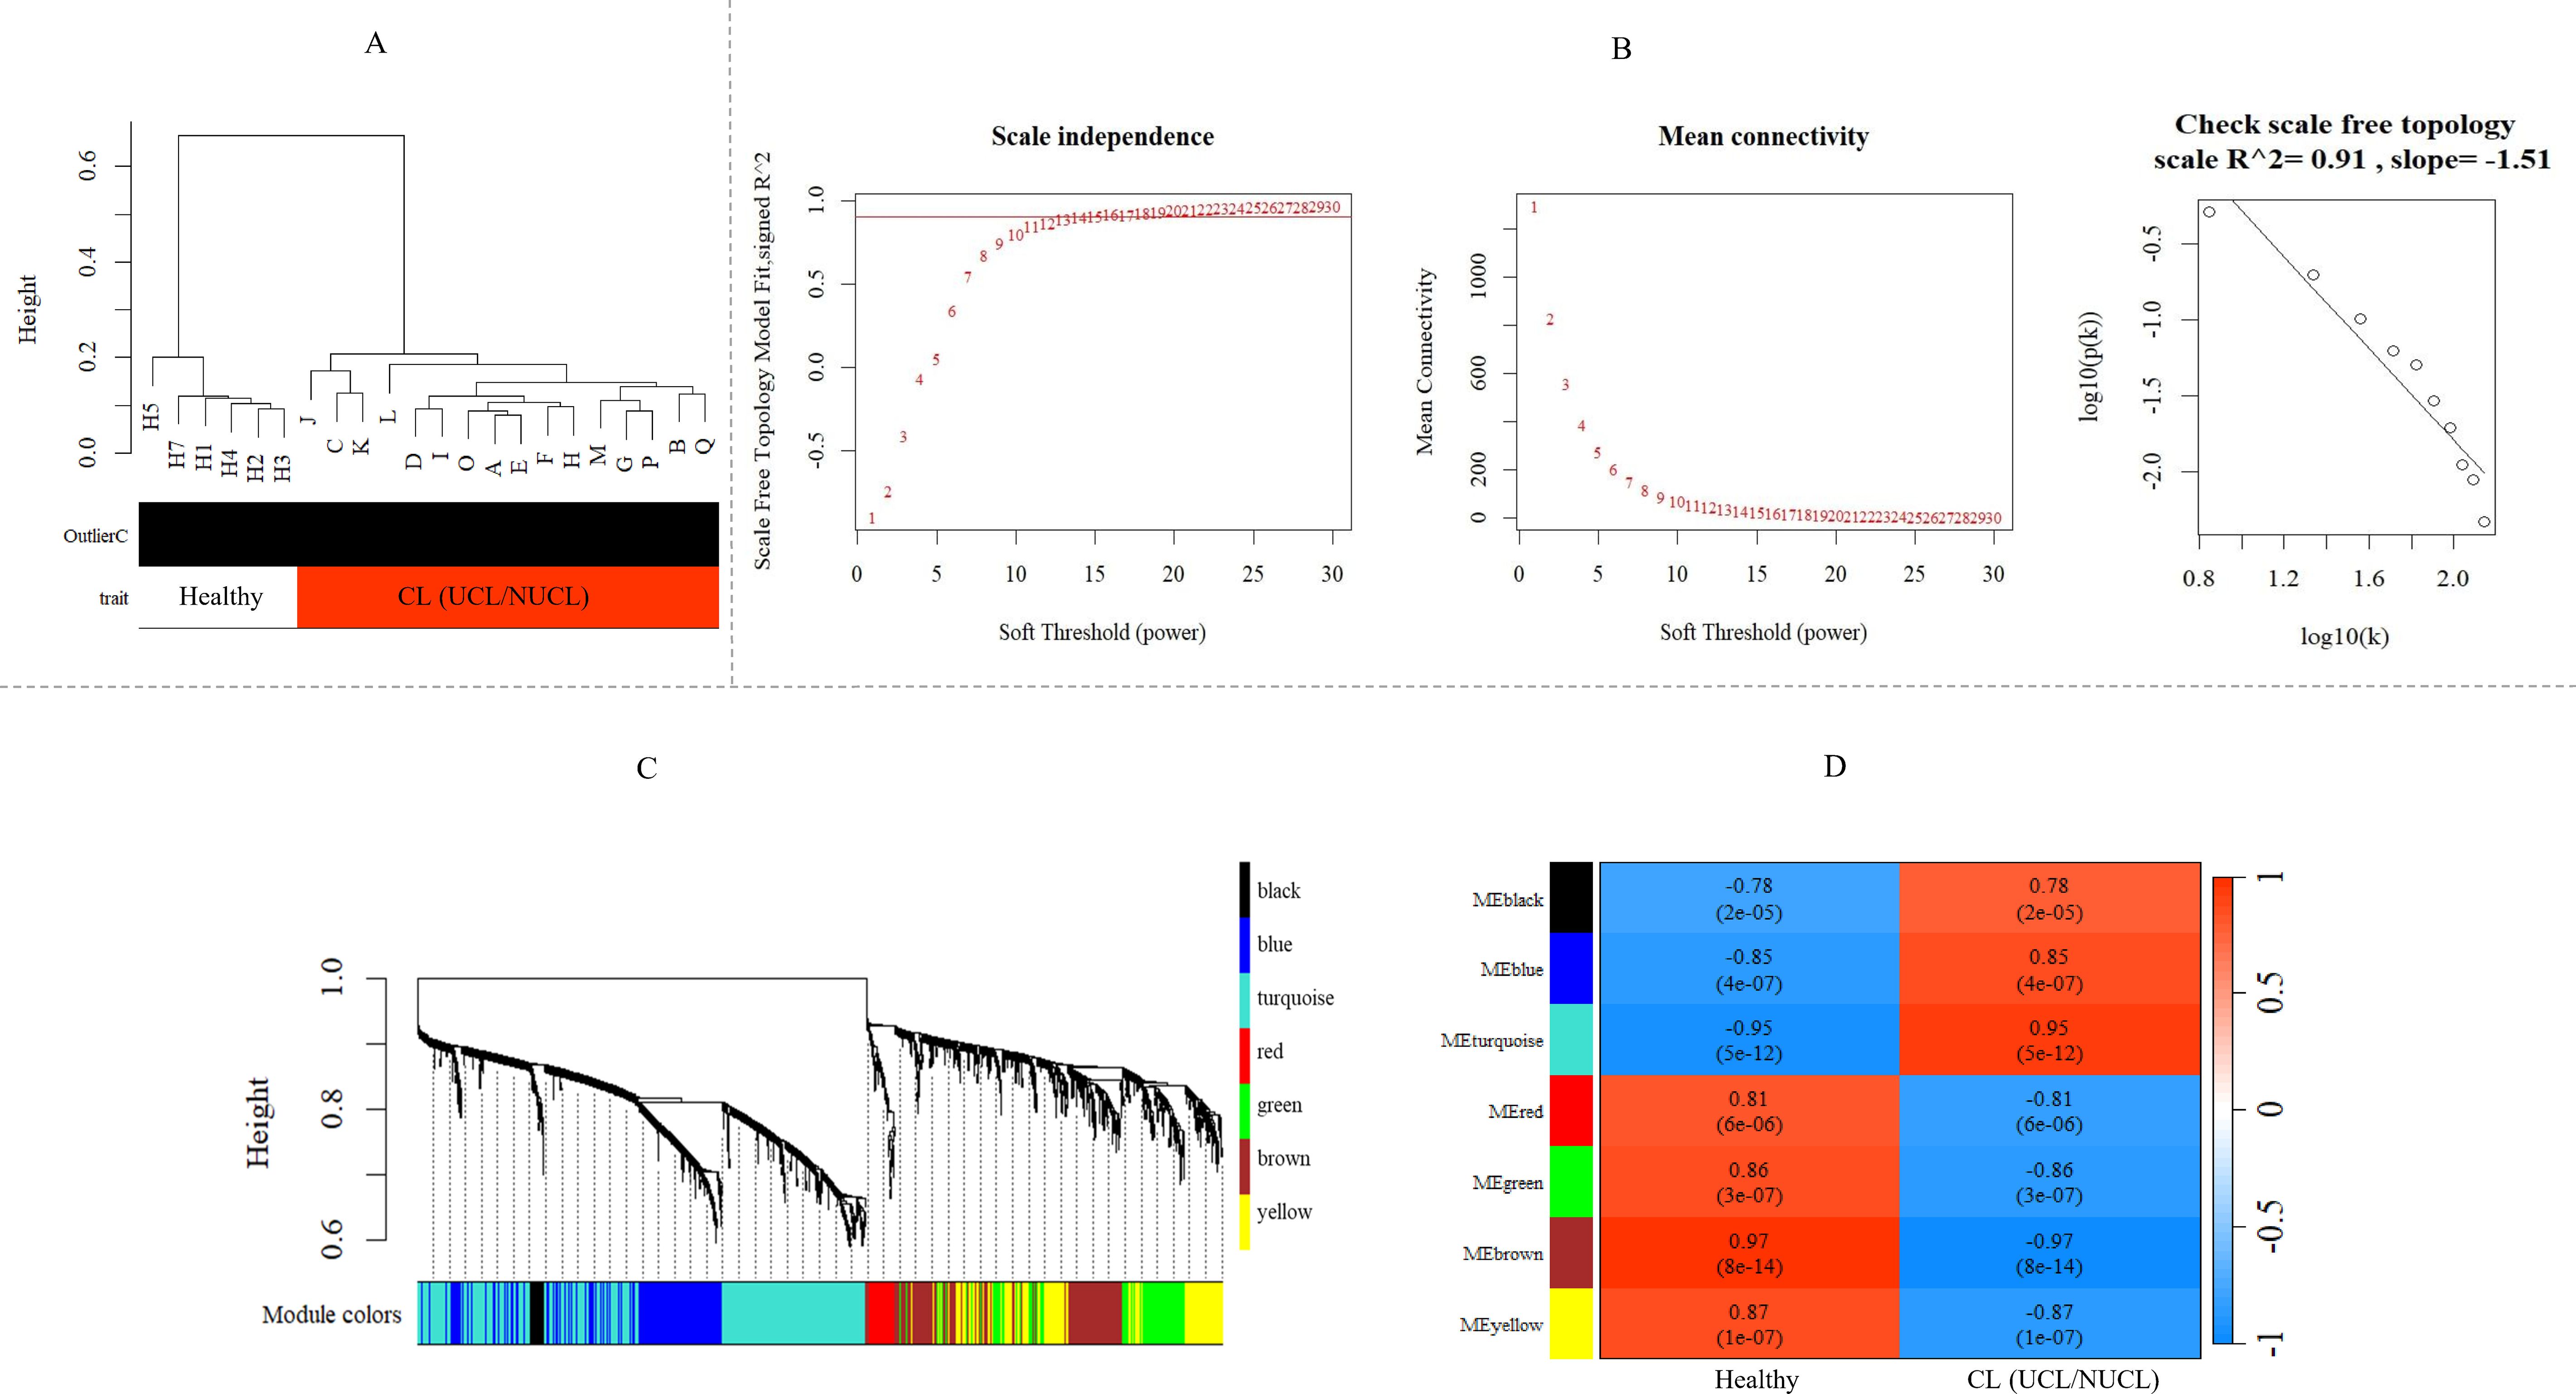
Figure 3. WGCNA of mRNA and lncRNA genes revealed gene co-expression modules in CL patients. (A) Sample dendrogram clustering to detect outliers in the GSE216638 dataset. (B) Freedom relative weight choice related co-expression modules. The soft thresholding powers are presented by numbers in the plots. The plot of connectivity distribution and the scale-free topology check when β = 15. Plot log–log shows a scale-free topology fit (R²) of 0.91. WGCNA, weighted gene co-expression network analysis. (C) Hierarchical clustering dendrogram of the shared mRNA and lncRNA genes between UCL and NUCL groups. The branches and color bands represent the assigned modules. (D) The module–trait relationship. The color scale corresponds to the scores representing the correlation levels between module eigengenes and the disease. A strong positive and negative correlation indicated by red and blue colors, respectively. The corresponding correlation and p-value are shown in each cell. CL, cutaneous leishmaniasis; UCL, ulcerative CL; NUCL, non-ulcerated CL.
As shown in Figure 3C, seven modules were assigned based on the hierarchical clustering and the WGCNA cutreeDynamic function in the shared genes between UCL and NUCL groups. A unique color label was assigned to each module. The turquoise module was the largest UCL–NUCL-related module containing 335 lncRNA and 426 mRNA genes, while the smallest module was the black module encompassing 16 lncRNA and 22 mRNA genes. Additionally, as most genes distributed in the turquoise module were upregulated, it was classified as an upregulated module. Details of all identified modules are provided in Table 1.

Table 1. Details of the assigned modules by WGCNA in the UCL–NUCL group.
Analysis of the association between modules and the disease provided information on modules that were most affected in the skin lesions of CL patients infected with L. tropica. This analysis showed a significantly high positive and negative correlation in most identified modules in the UCL–NUCL group. Among all modules, the highest significant positive correlation was related to the turquoise module, while brown was determined as a module with the highest negative correlation. Graphical visualization of the correlation values and their corresponding p-values is illustrated in Figure 3D. In subsequent analyses, based on GS-MM correlation results, the turquoise module with the highest correlation value (r = 0.93 and p-value <0.05) was determined as the key module in the UCL–NUCL group (Figure 4). The gene network visualization of co-expressed genes in the key module is presented in Figure 5A. Then, we focused only on the key module to identify hub genes and co-expressed pairs of mRNAs and lncRNAs. The top 20 mRNA and lncRNA genes met the eligibility criteria of a minimum absolute threshold value of 0.6 for MM and GS, and the highest value for degree was selected as UCL–NUCL associated hub genes in the key module (Figure 5B). Out of the 20 selected hub lncRNAs, 11 were identified as novel lncRNA genes (Table 2). Additionally, based on the subcellular location prediction, the hub lncRNAs mainly reached the highest score for nuclear and cytoplasmic localization. However, the localization of some lncRNAs remains unknown (Table 2).
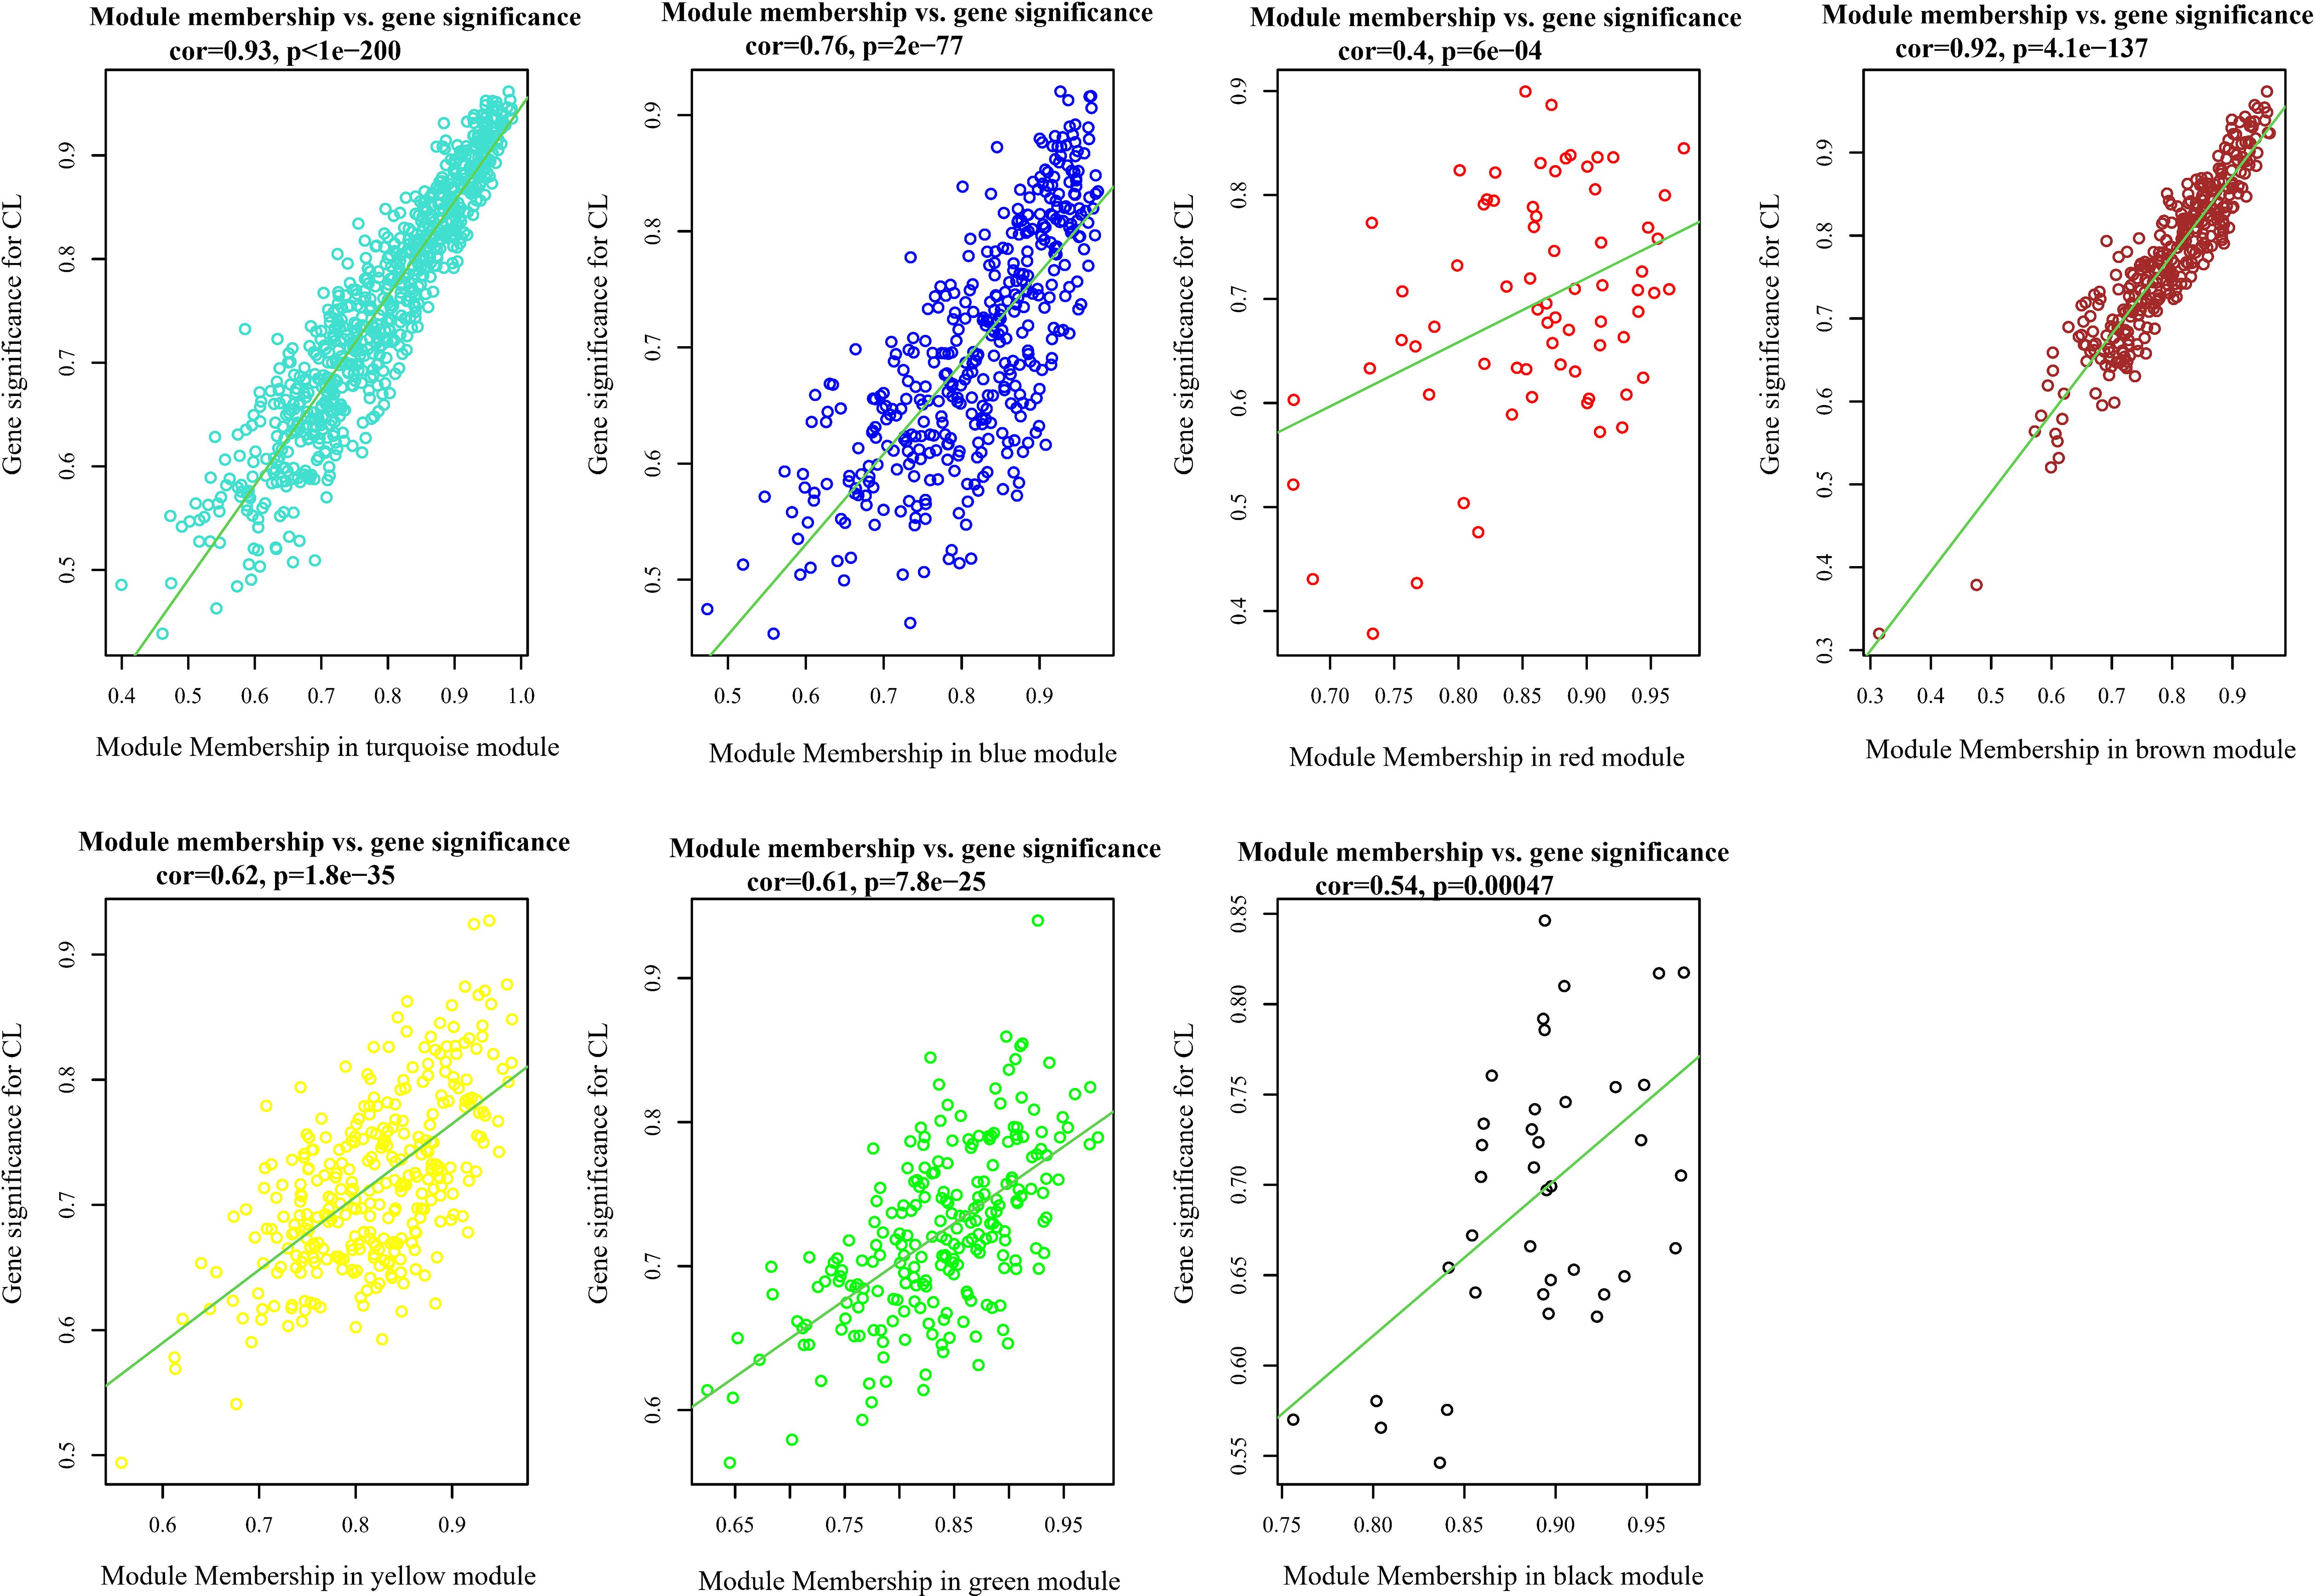
Figure 4. Scatter plots of gene significance (GS) vs. module membership (MM) in all assigned modules through WGCNA. CL, cutaneous leishmaniasis; UCL, ulcerative CL; NUCL, non-ulcerated CL.
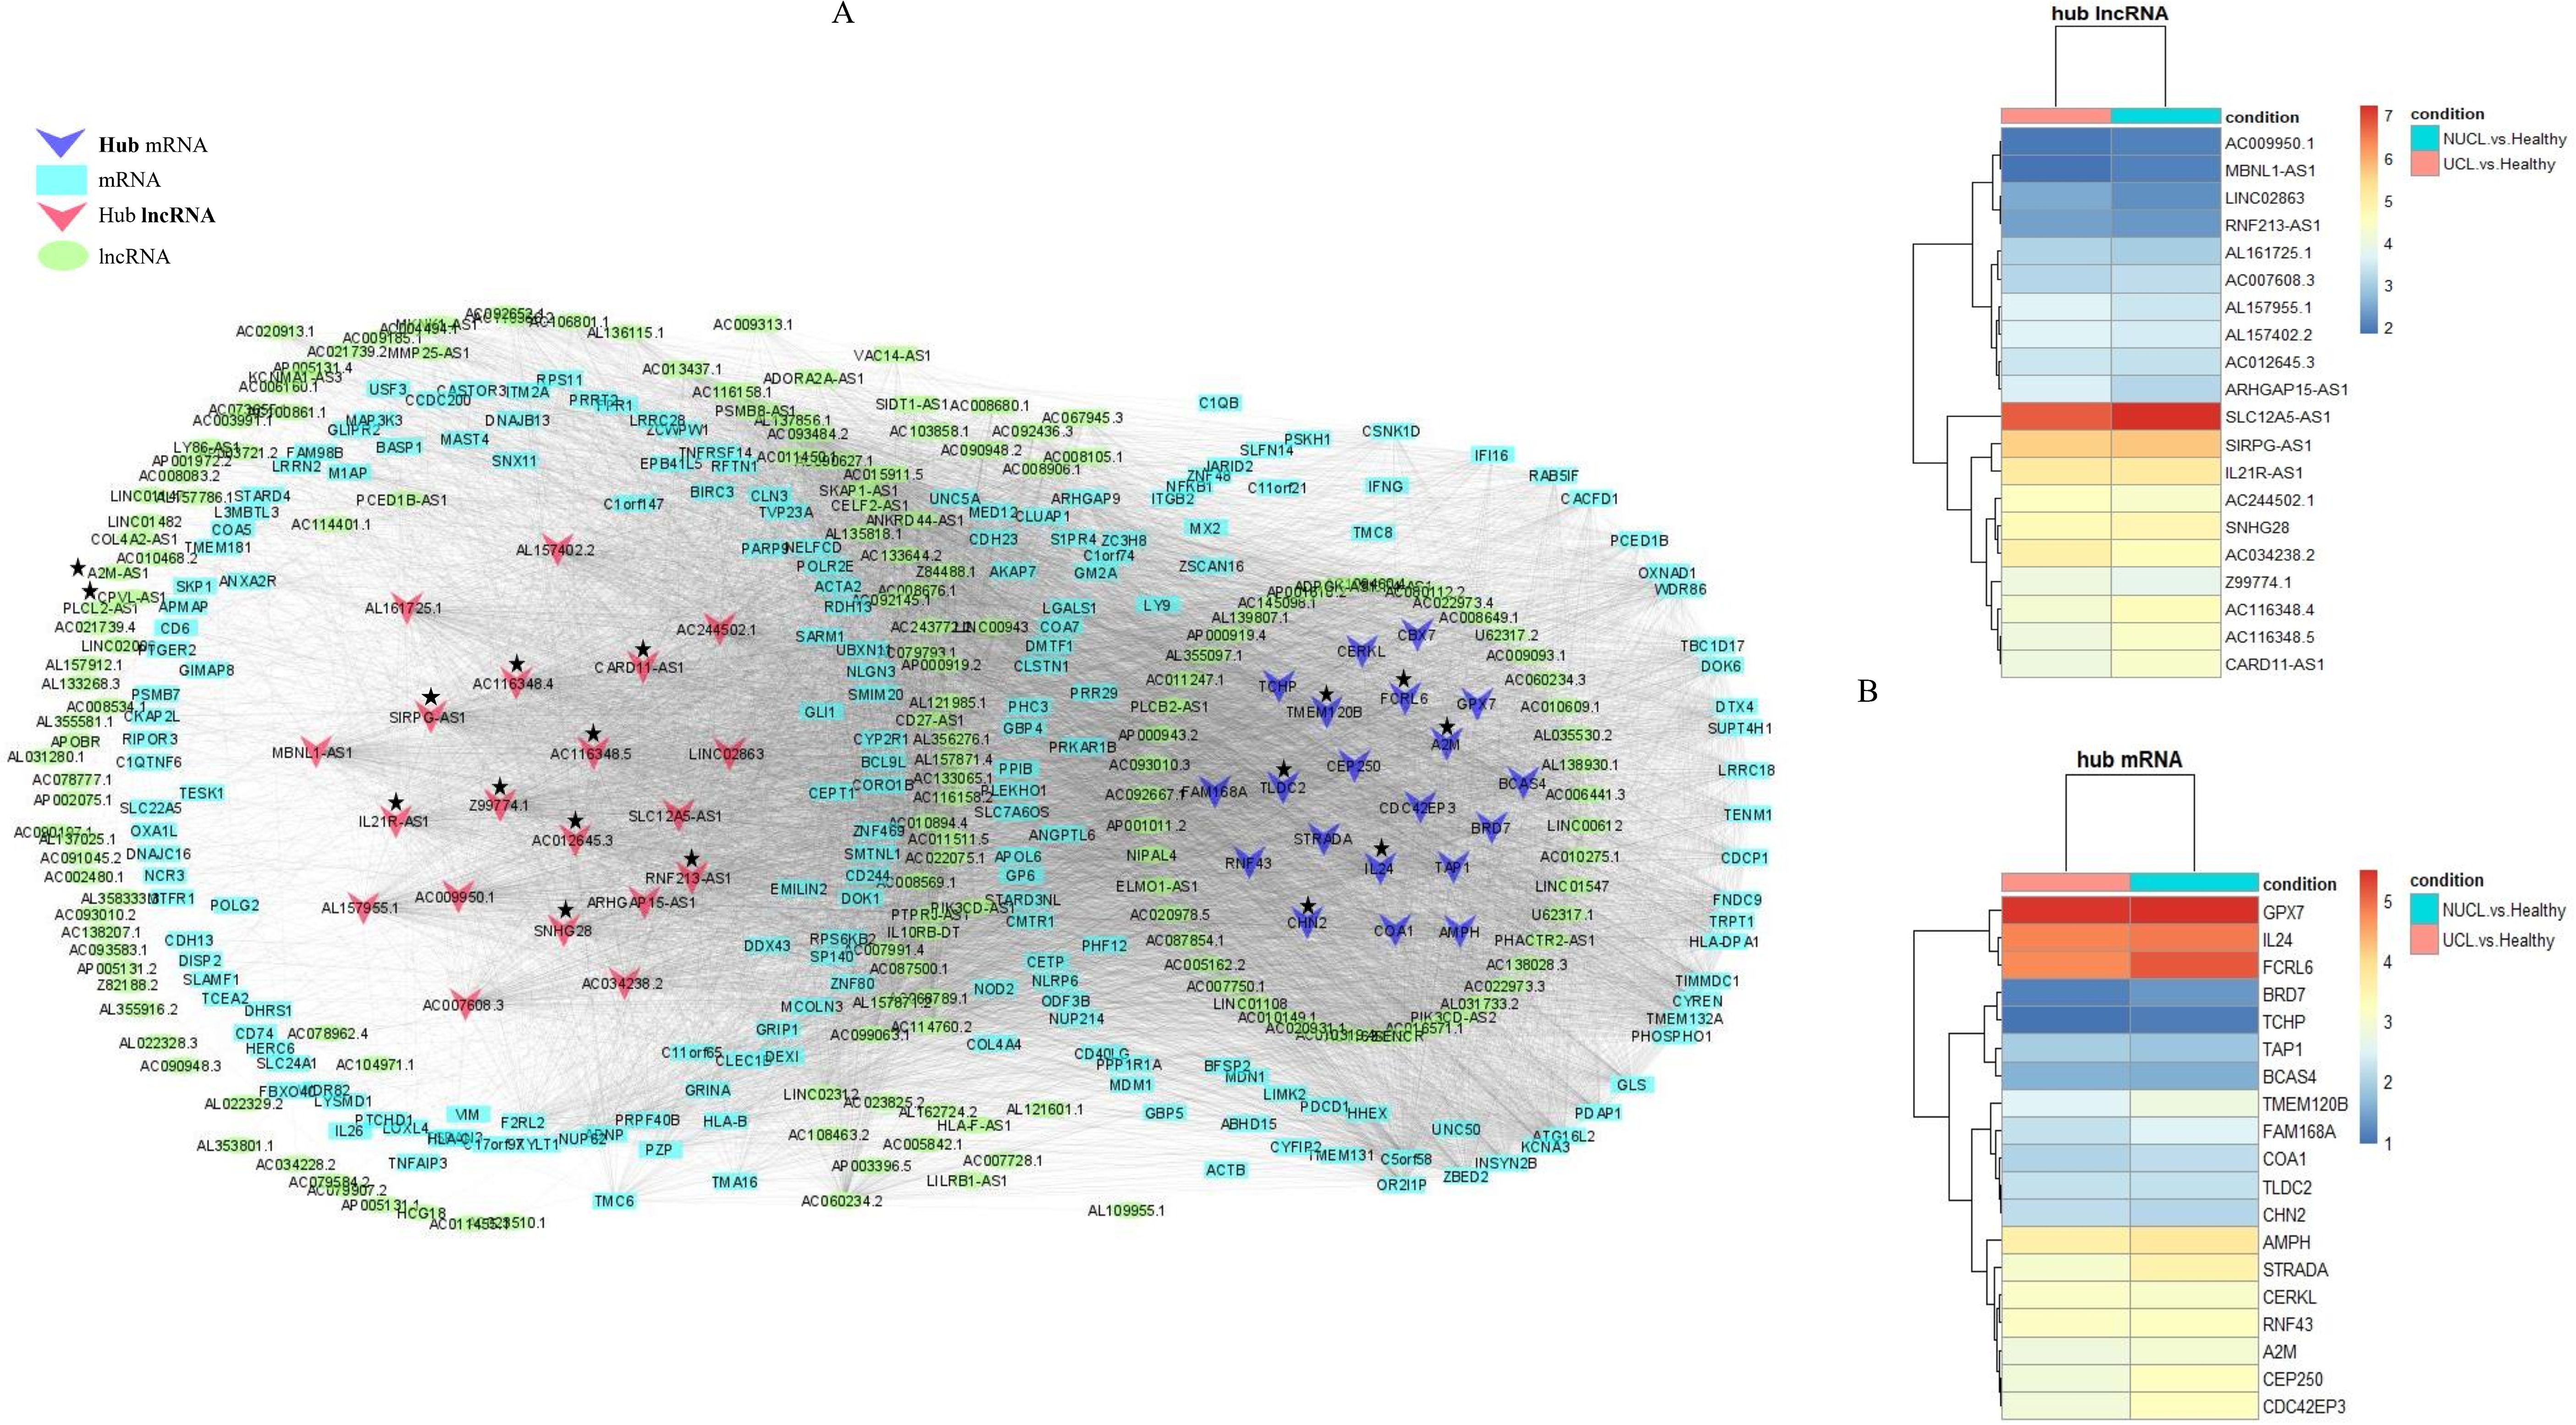
Figure 5. The regulatory network of coding–non-coding genes is distributed in the turquoise module as the key module. (A) The lncRNA–mRNA gene network for differentially expressed genes in the turquoise module. The ellipses represent lncRNAs, rectangles represent mRNAs, and inverted triangles represent hub lncRNAs and mRNAs. The turquoise and red colors were used for lncRNAs and mRNAs node coloring, respectively. The hub lncRNA and mRNA pairs (cis or trans) highlighted in the study are presented by asterisks. (B) Heatmap of hub DE genes were identified in the turquoise module. The log2FC values of mRNA and lncRNA genes were represented by color codes: red for high values and blue for low values. FC, fold change.
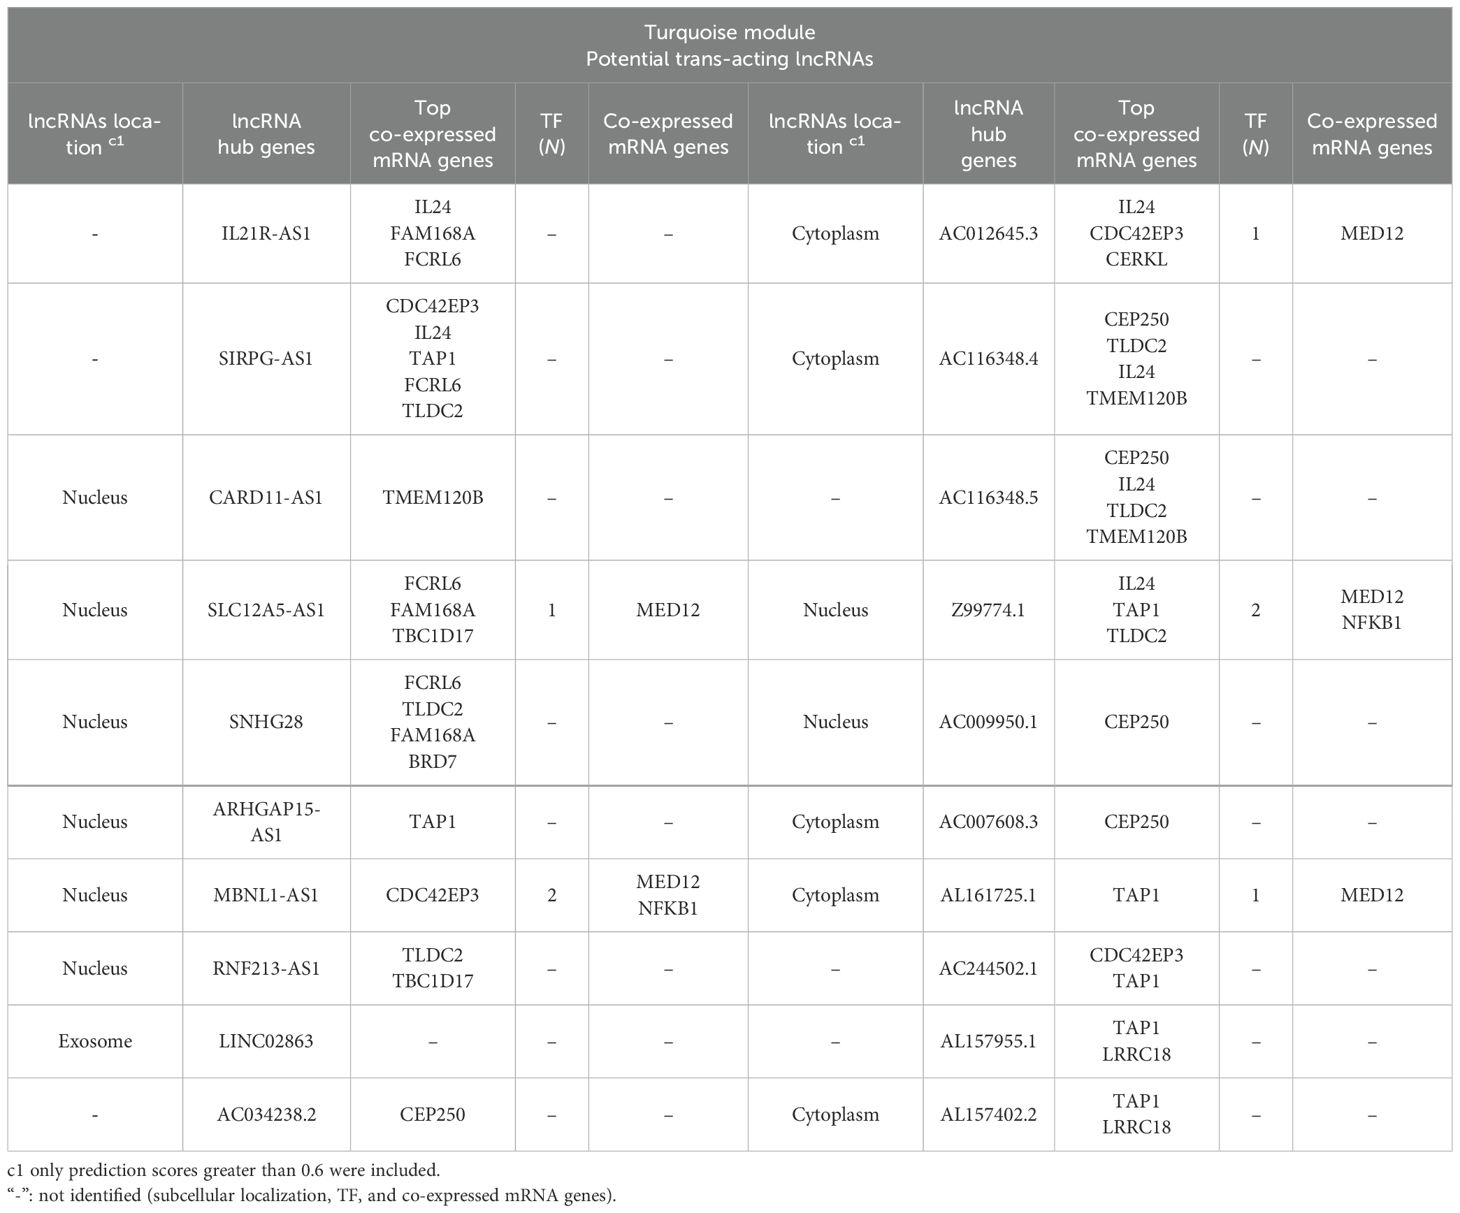
Table 2. The potential trans-target of hub lncRNAs identified among correlated lncRNA–mRNA pairs in the turquoise module in L. tropica-infected patients.
3.3 Cis- and trans-interactionsIn order to identify the possible regulatory relationships between lncRNAs (cis and/or trans) and their mRNA target genes, we investigated potential cis/trans-acting lncRNAs in the key module. Our search for cis-targets of lncRNAs in the turquoise module led to the discovery of 29 pairs of DE lncRNAs and mRNAs (Table 3). Expression of all identified pairs of lncRNA and mRNA genes was increased. It is worth noting that out of the 29 lncRNAs, 21 were novel transcripts and had no annotation in non-coding RNA databases. Nevertheless, we were able to predict their cis-target genes and subcellular localization; we primarily focused on the hub lncRNA–mRNA pairs. The potential trans-target of hub lncRNAs was determined by ranking correlation value, and the top highly correlated pairs (|r| > 0.95) are presented in Table 2. Additionally, the interaction of selected hub lncRNAs with TFs, as the other possible interactor, retrieved from the RNAInter database was identified. As shown in Table 2, in trans-interactions of hub lncRNAs–mRNAs, several hub lncRNAs were found to have regulation relationships with the TFs.
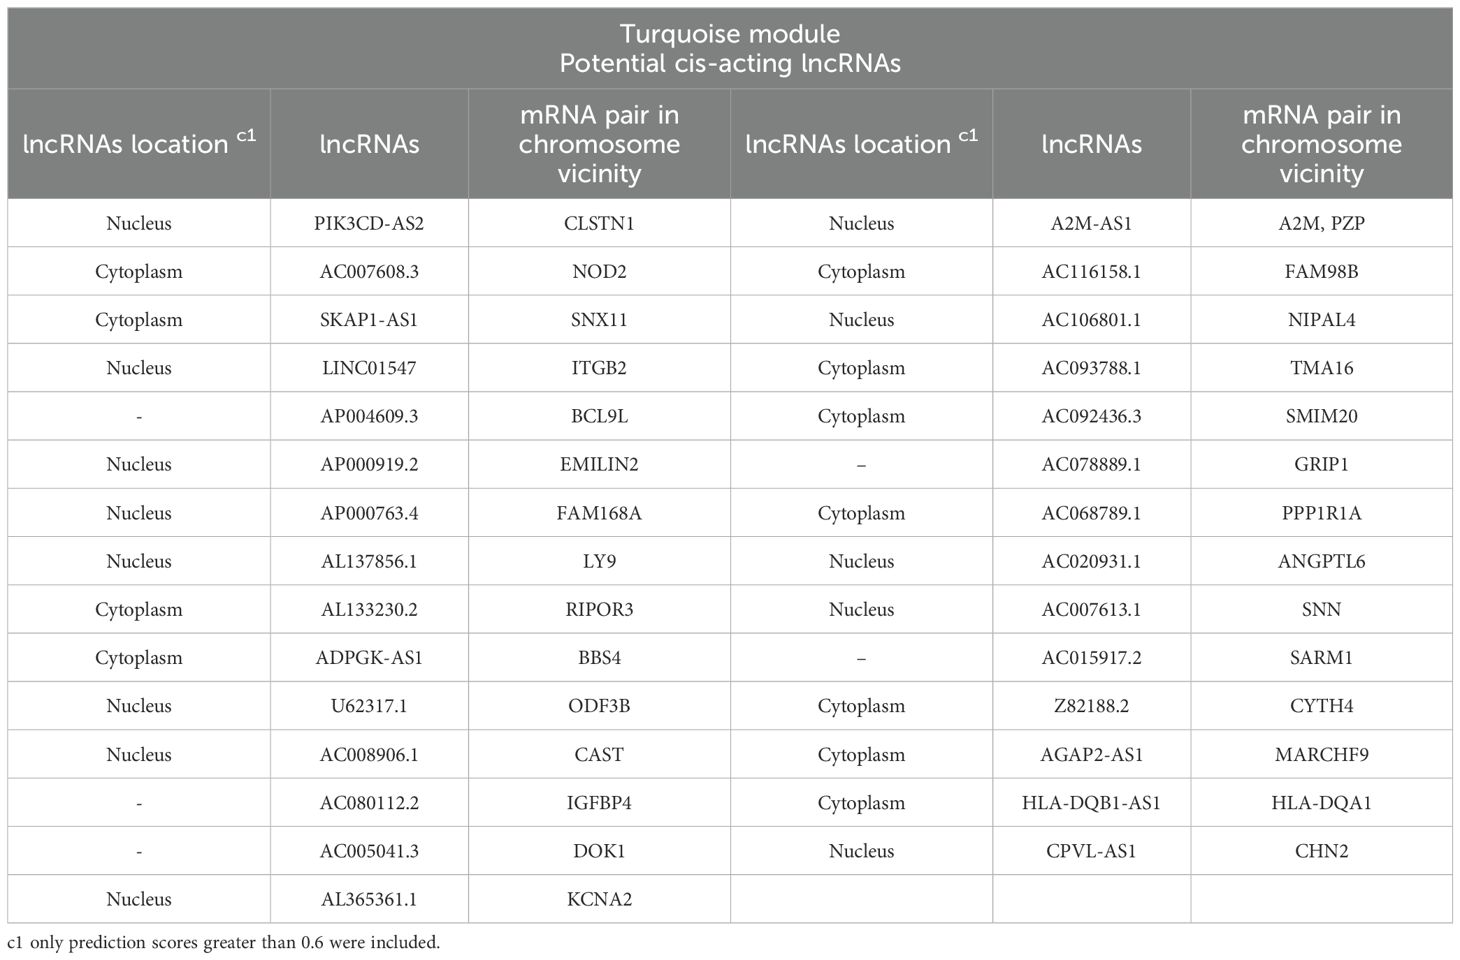
Table 3. Potential cis-targets of DE lncRNAs related to the turquoise module in the lesion of L. tropica-infected patients.
All mRNA genes distributed in the turquoise module can be considered trans-target genes of the lncRNAs in this module. In line with this, coding genes not found in searching for the cis-target are considered potential trans-targets of correlated DE lncRNAs in the turquoise module. Of the co-regulated pairs of DE lncRNAs and mRNAs in the turquoise module, we identified 12,562 positive and 2,891 negative pairs with strong correlation (|r| > 0.8 and p < 0.05). Accordingly, most DE lncRNA networks play a role in transcription as trans-acting lncRNAs. Therefore, we primarily focused on the hub lncRNA–mRNA pairs. The potential trans-target of hub lncRNAs was determined by ranking correlation value, and the top highly correlated pairs (|r| > 0.95) are presented in Table 2. Additionally, the interaction of selected hub lncRNAs with TFs, as the other possible interactor, retrieved from the RNAInter database was identified. As shown in Table 2, in trans-interactions of hub lncRNAs–mRNAs, several hub lncRNAs were found to have potential regulation relationships with the TFs. SLC12A5-AS1, MBNL1-AS1, AC012645.3, Z99774.1, and AL161725.1 showed regulation relationships with MED12. Notably, Z99774.1 and MBNL1-AS1 were also found to putatively interact with NFKB1.
3.4 Gene ontology and pathway enrichment analysisEnrichment analysis of the turquoise module revealed that 87 GO biological processes (six clusters) and 36 Reactome pathways were significantly enriched. GO annotation of mRNAs in key modules indicated that inflammatory response (GO: 0006954), positive regulation of cell–cell adhesion (GO: 0022409), and antigen processing and presentation of peptide antigen (GO: 0048002) were among the top terms of enrichment in the biological process category (Figure 6A). The Reactome pathways were mainly associated with “interferon gamma signaling”, “cytokine signaling in the immune system”, and “interferon signaling” in the key module (Figure 6B). These enrichment results were consistent with the pathogenesis of CL. The details of entries for GO annotation and pathway enrichment are reported in Supplementary Table S4.
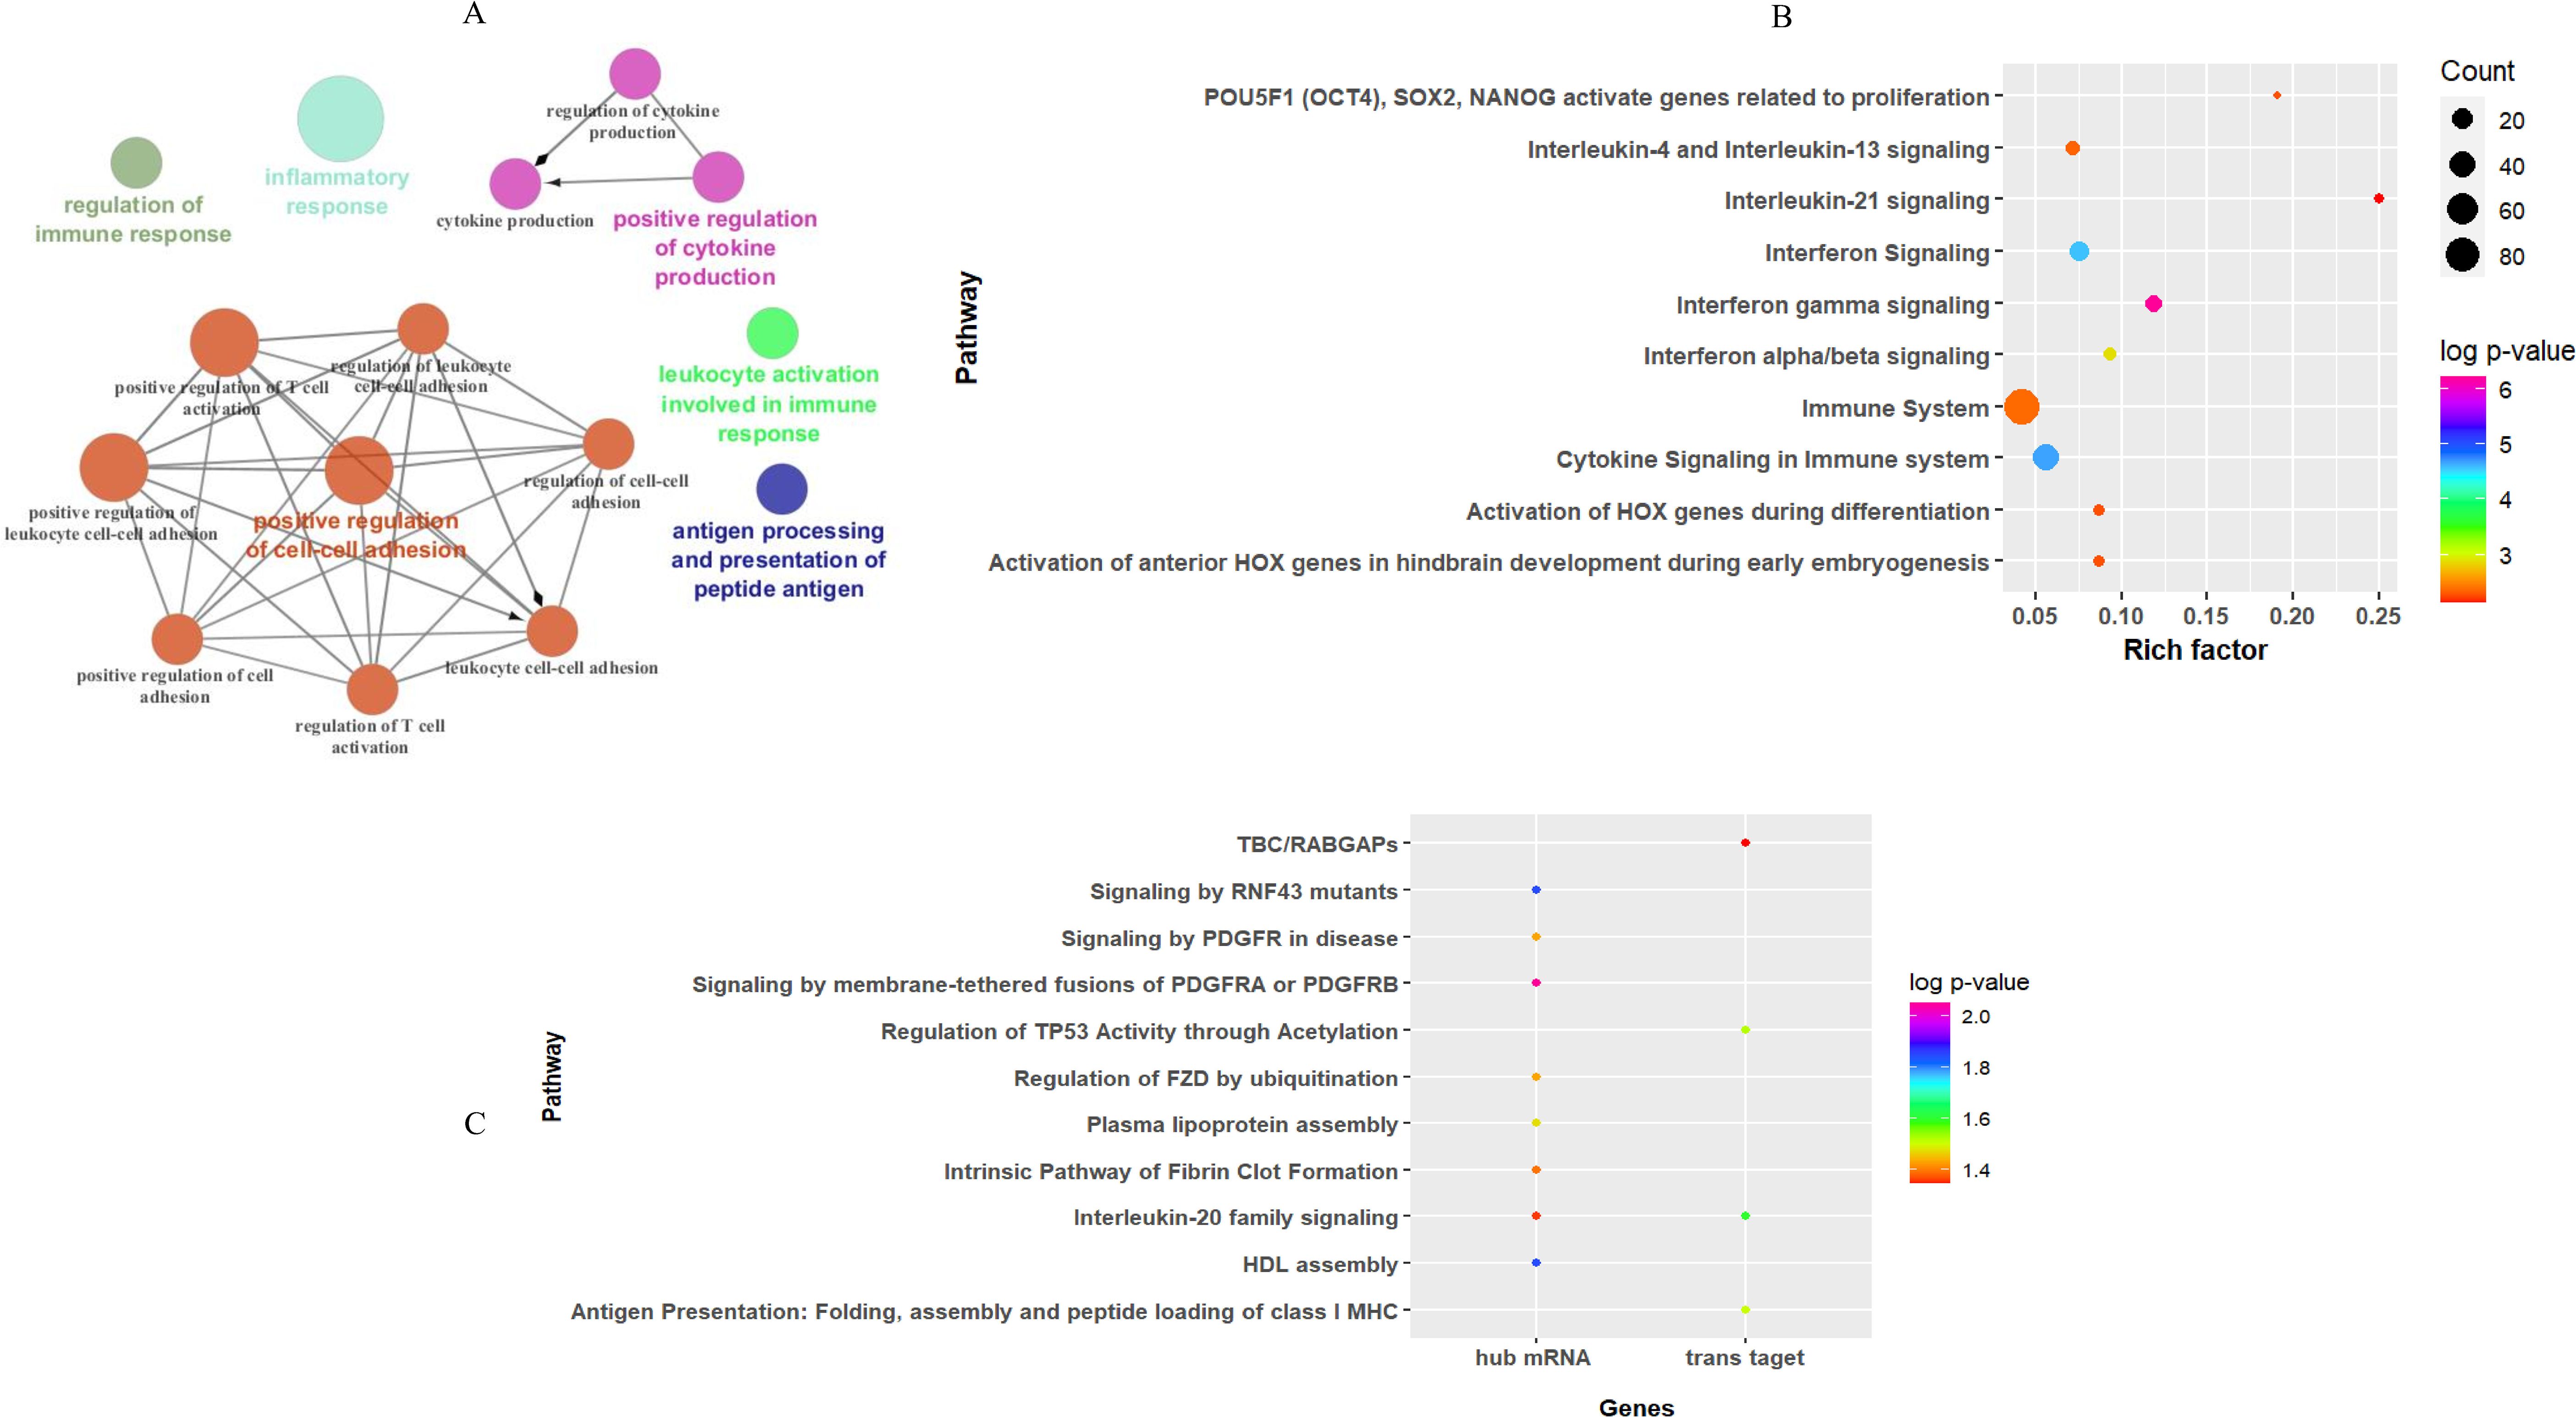
Figure 6. Functional enrichment analysis results for mRNAs based on WGCN. (A) The entries of GO enrichment analysis in the turquoise module. Top 10 entries of the Reactome pathway enriched by (B) all mRNA genes, and (C) hub mRNA along with trans-target genes of hub lncRNAs in the turquoise module.
In addition, Reactome pathway analysis of hub mRNA genes in the key module indicated that “signaling by membrane-tethered fusions of PDGFRA or PDGFRB”, “HDL assembly”, and “regulation of FZD by ubiquitination” were the top enriched pathways (Figure 6C).
Prediction of pathways enriched by hub lncRNA trans-target genes demonstrated that they were enriched in three pathways: “interleukin-20 family signaling”, “regulation of TP53 activity through acetylation”, and “antigen presentation: folding, assembly, and peptide loading of class I MHC” (Figure 6C), while cis-target genes of DE lncRNA in the key module were mainly involved in four pathways: “extracellular matrix organization”, “Toll-Like Receptor 4 (TLR4) cascade”, “translocation of ZAP-70 to immunological synapse”, and “interferon-gamma signaling”.
3.5 Validation of DE lncRNA and mRNA genes related to the key moduleTo validate the accuracy of RNA-seq data, the expression of seven mRNA genes was assessed in 18 CL patients and 10 healthy volunteers using the qRT-PCR method. The selected genes were related to the top two entries of the Reactome pathway enriched in the key module, interferon gamma signaling and cytokine signaling, with high expression. The genes were involved in interferon gamma signaling including Interferon-gamma (IFNG), Guanylate-binding protein (GBP)4, and GBP5. Interleukin21 (IL21), IL27 (P28/EBI3), and IL24 were related to cytokine signaling. Furthermore, the expression of two lncRNAs, IL21R-AS1 and SIRPG-AS1, which were among the highly expressed hub lncRNAs targeting IL24, as a hub mRNA, was evaluated. As shown in Figure 7, we compared the expression of these genes in patients infected with L. tropica to those of a healthy group. The results showed that all genes had increased expression (log2FC > 1, p < 0.05) in the infected patients compared to the healthy group. Overall, the relative expression analysis validated the significant upregulation of selected genes in CL infection caused by L. tropica that supported the reproducibility of the included RNA-seq data. These findings provide further evidence of the involvement of “interferon-gamma signaling” and “cytokine signaling” in CL infection.
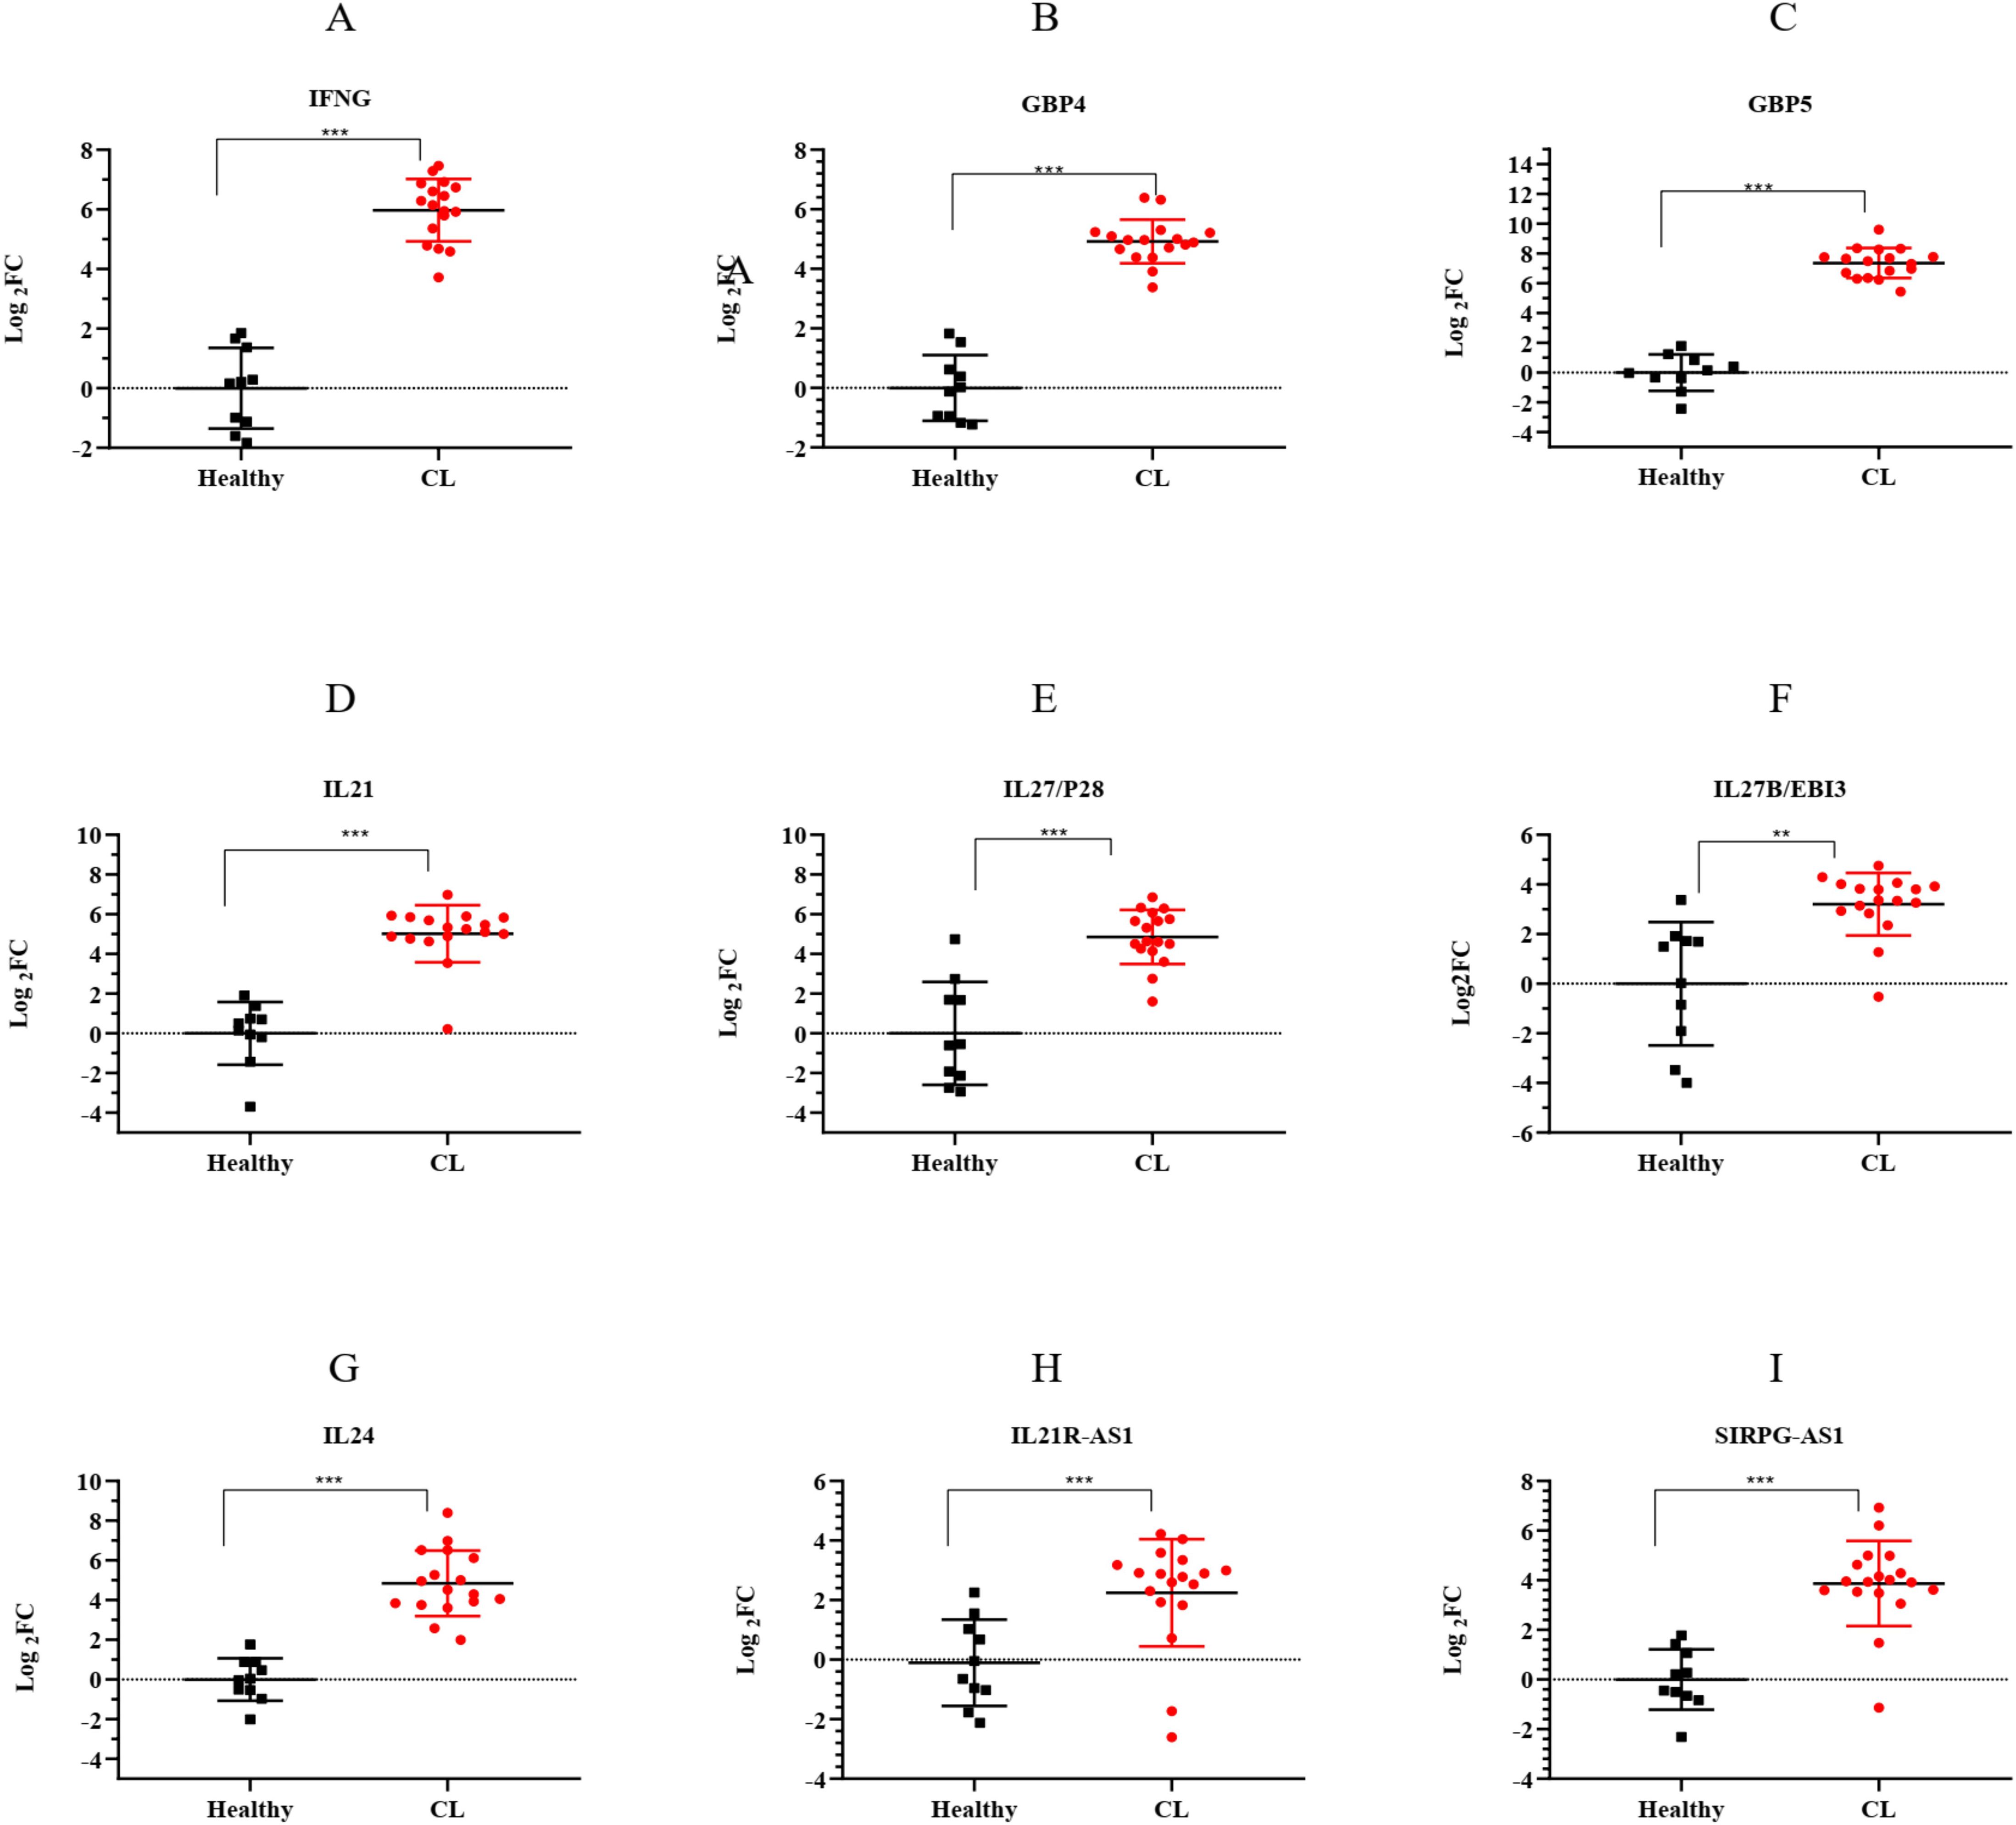
Figure 7. The expression levels of selected lncRNA and mRNA genes from the turquoise module between L. tropica-infected patients and the healthy group as determined by qRT-PCR. (A) IFNG; (B) GBP4; (C) GBP5; (D) IL21; (E) IL27/P28; (F) IL27B/EBI3; (G) IL24; (H) IL21R-AS1; and (I) SIRPG-AS1; p-values obtained using the Mann–Whitney U test are shown (**p < 0.01, and ***p < 0.001). GAPDH was used as a reference gene. The results were shown as the mean ± SD of duplicate measurements. FC, fold change.
4 DiscussionStudying host molecular signatures in the context of host–Leishmania interactions has gained momentum with the advancement of omics analyses. These studies have highlighted a potential role for host transcriptional dysregulation in leishmaniasis infection with protein-coding genes (Maretti-Mira et al., 2012; Gardinassi et al., 2016; Fakiola et al., 2019; Adriaensen et al., 2020; Masoudzadeh et al., 2020b; Farias Amorim et al., 2021). Besides these studies, a few recent reports have explored the role of other biological factors like lncRNAs during leishmaniasis (Fernandes et al., 2022; Maruyama et al., 2022; Almeida et al., 2023), which contributed to our understanding of the regulatory network involved in leishmaniasis. Therefore, exploring coding–non-coding signatures and translational implications of the diverse regulation could be a promising focus for future research, as it may help address the challenges posed by this complex disease.
To our knowledge, this study is the first to investigate the profile of lncRNAs and their potential connections with mRNAs in the lesion of CL patients infected with L. tropica using a systems biology approach. In our analyses, WGCNA enabled us to gain an overview of the system-level functionality of the significantly expressed gene in the whole transcriptome dataset and find key biological processes affected by the interplay between lncRNAs and mRNAs. This study leverages the strength of WGCNA, which prioritizes connections over discrete components and avoids misinterpretation about the role of specific pathways in a particular condition, to provide more reliable and comprehensive results than those obtained based solely on mean expression (Weighill et al., 2021; Panditrao et al., 2022).
According to WGCNA of shared lncRNA and mRNA genes in our dataset, seven modules associated with CL due to L. tropica were identified. Of note, a module with a strong positive correlation value, namely, turquoise, was highlighted as the key module. Through functional enrichment analysis of the key module, we found that the enriched terms, as expected, were mainly associated with immune pathways like “interferon-gamma signaling” and “cytokine signaling”. Both of the enriched pathways have been recognized as key mechanisms involved in determining the outcome of leishmaniasis infection (Scott and Novais, 2016).
Hence, both coding and non-coding genes were classified in the turquoise module; we analyzed the co-expression of lncRNA and mRNA genes to identify hub lncRNA and mRNA genes and infer the possible function of lncRNAs. The hub genes might represent the main lncRNA and mRNA genes that influence the functionality of the key module. Additionally, we explored the type of regulatory interactions (cis or trans) of the identified hub lncRNAs.
Among the identified mRNA hubs, IL24, TBC/LysM-associated domain containing 2 (C20ORF118 or TLDC2), and Transmembrane Protein 120B (TMEM120B) genes were the top three genes that had the highest connection with other genes. These genes are found as the potential trans-target of 9 out of 20 hub lncRNAs in our study (Table 2). IL-24 belongs to the IL-20 cytokine subfamily and is predominantly expressed in T cells and macrophages (Dabitao et al., 2018). The pro-inflammatory cytokine acts as a regulator of keratinocytes in the skin and mediates tissue repair in injured barrier epithelial cells (Sa et al., 2007; Liu et al., 2023). However, biologic actions and expression patterns of IL-24 are rather understudied in leishmaniasis, and based on the role of IL-24 in wound healing, it can be reasonable to consider a protective effect for IL-24 in CL.
On the IL-20 cytokine subfamily, we found a co-expressed pair of IL21R-AS1/IL24, in which expression of both genes was increased based on RNA-seq and qRT-PCR data. Increased levels of IL21R-AS1 gene in our data might act as an activator of IL24-dependent signaling. Different from our results, a recent study demonstrated the downregulation of IL21R-AS1 and the corresponding cis-target, namely, IL21R in L. infantum-infected THP1 (Almeida et al., 2023). In other studies, IL21R-AS1 was reported as a candidate coronary artery disease biomarker (Cai et al., 2016) and as an immune-related lncRNA predicting cervical squamous cell carcinoma prognosis (Lv et al., 2022).
The SIRPG-AS1/IL24 was another identified co-expressed pair on the IL-20 cytokine subfamily in our study, which were upregulated based on RNA-seq and qRT-PCR results. The SIRPG-AS1 is poorly studied, with one report related to potential prognostic lncRNAs in the squamous cell carcinoma type (Tian et al., 2020). Furthermore, in our data, IL24 was also found to be the predicted trans-regulating target of four novel hub lncRNAs, namely, AC012645.3, AC116348.4, AC116348.5, and Z99774.1. No study has yet investigated the potential function of these lncRNAs. Interestingly, two of those upregulated lncRNAs, namely, AC012645.3 and Z99774.1, were also predicted to target TFs. The upregulated TFs were Mediator Complex Subunit 12 (MED12) and nuclear factor kappa B subunit 1 (NFKB1). MED12 is involved in regulating essential steps of transcription, and its deregulation was linked to human cancers (Zhang et al., 2020), while NFKB1 plays a role in macrophage polarization and innate immune memory responses (Porta et al., 2009). In the cases of leishmaniasis, interrupted TF-mediated regulation has been described (Lecoeur et al., 2022). For instance, L. amazonensis interferes with NF-κB TF function through downregulation of RELA, NFKB1, and NFKB2 during early infection in BMDM (Lecoeur et al., 2020). Although a recent study predicted several lncRNA–TF interactions in L. infantum infection (Maruyama et al., 2022), the role of lncRNAs in regulating TFs and the underlying molecular mechanisms remains to be elucidated in leishmaniasis.
In addition to IL24, TLDC2 and TMEM120B were also among the top three hub mRNA genes in our analysis. TLDC2 is known as a member of the TLDCs family, which has an important role in the oxidative stress response (Finelli and Oliver, 2017). TMEM120B is expressed in fat and has a regulatory role in the differentiation of adipocytes (Batrakou et al., 2015). However, the potential role of these genes in infectious diseases, including leishmaniasis, remains unknown. Here, TLDC2 and TMEM120B mRNA hub genes were found to be co-expressed with several hub lncRNAs, including SIRPG-AS1, CARD11-AS1, SNHG28, RNF213-AS1, AC116348.5, and Z99774.1. While the role of these upregulated lncRNAs is unclear in leishmaniasis, SNHG28 is recognized as a type of lncRNA, named small nucleolar RNA host gene (SNHG), which is involved in the development and aggressiveness of cancer. The SNHG family has been suggested as a potential prognostic and immunotherapeutic response biomarker (Shi et al., 2020; Zimta et al., 2020; Zheng et al., 2023). In the context of leishmaniasis, SNHG29, a member of the SNHG family, was determined as hub lncRNA targeting S100A8 mRNA in L. braziliensis skin infection. This study suggested that the upregulated pair may increase the recruitment of neutrophils to the site of the infection (Almeida et al., 2023). Here, we also found another predicted target for SNHG28 termed Fc receptor-like 6 (FCRL6). FCRL6 is an immunoregulator gene in cytotoxic T and NK cells, and the elevated level of this gene and its potential mechanistic role represented this gene as a favorable biomarker and therapeutic target in cancer (Davis, 2020). Expression of FCRL6 as a hub mRNA gene was also upregulated in our study. Based on the role of FCRL6 in cytotoxicity, this result may imply a potential pathogenic role for the predicted co-expressed pair in the CL infection.
Our study has also identified potential cis-acting lncRNAs, most of which were novel transcripts with unknown functions (Table 3). A noteworthy instance of annotated cis-acting lncRNAs, A2M-AS1, targeted alpha 2-Macroglobulin (A2M), a hub mRNA. A2M is known as a human protease inhibitor, which is potentially involved in host defense and infection (Vandooren and Itoh, 2021). Evidence from recent studies described A2M-AS1 as a prognostic biomarker in different cancers (Zhou et al., 2019; Fang et al., 2020; Ye and Jin, 2021; Qiu et al., 2022). However, the significance of this upregulated pair in CL has not been studied previously; we speculated that this overexpressed pair would be associated with CL progression by boosting pro-inflammatory cytokine levels. The other predicted cis-acting lncRNA, CPVL-AS1, was linked to the hub mRNA gene CHN2 chimerin 2 (CHN2). CHN2 negatively regulates Rac GTPase activity, which has a role in the control of actin cytoskeleton dynamics. These genes play a role in cell proliferation, adhesion, and T-cell activation. CHN2 deregulation has been linked to mental disorders and cancers (Wertheimer et al., 2012; Barrio-Real et al., 2013; Finalet Ferreiro et al., 2014). However, the function of CPVL-AS1 lncRNAs is currently unknown. Investigating the functional roles of the predicted cis-acting lncRNAs and their corresponding mRNA gene pairs can open up new avenues for studying regulatory networks and the intricate biological mechanisms related to CL.
In addition, the current study validated the expression of some mRNA genes associated with top enriched pathways, namely, “interferon gamma signaling” and “cytokine signaling”, using the qRT-PCR method. The qRT-PCR results showed overexpression of IFNG, GBP genes (GPB-4 and GBP-5), IL21, and IL27 (P28/EBI3) in CL patients infected with L. tropica. IFN-γ, as a critical cytokine, exerts its function in immunoprotection against Leishmania through modulating the activity of macrophage and Th1 response (Kima and Soong, 2013). Elevated levels of this cytokine have been documented following CL infection (Galgamuwa et al., 2019; Farias Amorim et al., 2021). Furthermore, GBP genes are known as a family of interferon-inducible dynamin-like GTPases and regulators of immunity to infection. They are among the most frequent IFN-stimulated genes (ISGs) (Kresse et al., 2008; Schoggins, 2019; Tretina et al., 2019). Upregulation of GBP (GBP1–6) genes was seen in CL patients infected with L. braziliensis (Farias Amorim et al., 2021). Similarly, we observed increased levels of IFNG, GBP4, and GBP5, as measured by RNA-seq and qRT-PCR, within L. tropica CL lesions. However, the role of GBP genes during CL in human is not well understood, and increased levels of IFN-γ and GBP genes could possibly reflect their favorable contribution in eliciting immunity against CL.
Regarding the expression of IL21 and IL27, there is ample evidence showing that IL-21 is involved in inflammation and tissue damage by increasing the effector phase of T-cell responses (Monteleone et al., 2008). However, there is a dearth of studies evaluating the involvement of this cytokine in leishmaniasis. These studies reported the expression of IL21 in the immune response against CL and VL diseases (Espitia et al., 2010; Bollig et al., 2012; Costa et al., 2015; Kong et al., 2017; Khatonier et al., 2018). In addition, Costa et al. showed that IL21 expression has a positive correlation with IFN-γ and IL27 expression in CL caused by L. braziliensis (Costa et al., 2015). Here, we found an upregulation of IL21 expression within active skin lesions. The combined evidence of the studies tends to suggest that IL-21 possibly promotes the disease progression. Another studied cytokine, IL-27, has a function in regulating Th1, Th2, and Th17 immune responses (Villarino et al., 2003; Batten et al., 2006). In the context of leishmaniasis, IL-27 exerts its function on T cells in a species-specific manner. This cytokine was found to have a protective role in the early stage of L. major infection (Anderson et al., 2009). In contrast, the immunosuppressive effect of IL-27 in response to some species like L. infantum and L. donovani has been documented (Rosas et al., 2006; Barreto-de-Souza et al., 2015; Quirino et al., 2016; Jafarzadeh et al., 2020). The upregulated IL27 gene in our study may suggest a pathogenic role for IL27 like IL21 in the L. tropica CL lesion. Taken together, this evidence indicates that the genes in the key module determined by WGCNA might represent a potential target that influences the clinical outcome of patients with CL due to L. tropica.
5 ConclusionIn conclusion, the present study demonstrated the deregulation of lncRNAs in the transcriptional perturbations induced by L. tropica infection in patients with CL. Analyzing the integrated expression profiles of lncRNAs and mRNAs suggested a potential function for lncRNAs in CL patients. Moreover, we proposed a set of potential hub coding–noncoding genes that may be valuable for future studies aimed at the development of effective diagnostic or therapeutic strategies in CL.
Data availability statementThe original contributions presented in the study are included in the article/Supplementary Material. Further inquiries can be directed to the corresponding authors.
Ethics statementThe studies involving humans were approved by Ethical Committee of the Pasteur Institute of Iran (Under the Ethics code of IR.PII.REC.1400.022). The studies were conducted in accordance with the local legislation and institutional requirements. Written informed consent for participation in this study was provided by the participants’.
Author contributionsSH: Data curation, Formal Analysis, Methodology, Software, Validation, Visualization, Writing – original draft, Writing – review & editing. NM: Data curation, Formal Analysis, Methodology, Software, Validation, Visualization, Writing – original draft, Writing – review & editing. BA: Data curation, Formal Analysis, Writing – review & editing. HH: Methodology, Writing – review & editing. VMG: Resources, Writing – review & editing. MK: Resources, Writing – review & editing. JP: Methodology, Writing – review & editing. HR-T: Formal Analysis, Writing – review & editing. RES: Resources, Writing – review & editing. SR: Conceptualization, Funding acquisition, Investigation, Project administration, Supervision, Writing – review & editing. AMH: Conceptualization, Funding acquisition, Investigation, Supervision, Writing – review & editing.
FundingThe author(s) declare that financial support was received for the research, authorship, and/or publication of this article. This research was funded by research grant no. 1232 from Pasteur Institute of Iran. It has also received funding from the European Union’s H2020 LeiSHield MATI RISE (Research and Innovation Staff Exchange), under the Marie Skłodowska–Curie grant agreement no. 778298.
AcknowledgmentsThe authors are grateful to the study volunteers for their participation.
Conflict of interestThe authors declare that the research was conducted in the absence of any commercial or financial relationships that could be construed as a potential conflict of interest.
The author(s) declared that they were an editorial board member of Frontiers, at the time of submission. This had no impact on the peer review process and the final decision.
Publisher’s noteAll claims expressed in this article are solely those of the authors and do not necessarily represent those of their affiliated organizations, or those of the publisher, the editors and the reviewers. Any product that may be evaluated in this article, or claim that may be made by its manufacturer, is not guaranteed or endorsed by the publisher.
Supplementary materialThe Supplementary Material for this article can be found online at: https://www.frontiersin.org/articles/10.3389/fcimb.2024.1416925/full#supplementary-material
Supplementary Table 4 | Significant gene ontology-biological processes and Reactome pathways in key module (turquoise).
ReferencesAdriaensen, W., Cuypers, B., Cordero, C. F., Mengasha, B., Blesson, S., Cnops, L., et al. (2020). Host transcriptomic signature as alternative test-of-cure in visceral leishmaniasis patients co-infected with HIV. EBioMedicine. 55, 102748. doi: 10.1016/j.ebiom.2020.102748
PubMed Abstract | Crossref Full Text | Google Scholar
Almeida, M. C., Felix, J. S., Lopes, M., de Athayde, F. R. F., Troiano, J. A., Scaramele, N. F., et al. (2023). Co-expression analysis of lncRNA and mRNA suggests a role for ncRNA-mediated regulation of host-parasite interactions in primary skin lesions of patients with American tegumentary leishmaniasis. Acta Trop. 245, 106966. doi: 10.1016/j.actatropica.2023.106966
PubMed Abstract | Crossref Full Text | Google Scholar
Amorim, C. F., Novais, F. O., Nguyen, B. T., Misic, A. M., Carvalho, L. P., Carvalho, E. M., et al. (2019). Variable gene expression and parasite load predict treatment outcome in cutaneous leishmaniasis. Sci. Transl. Med. 11, eaax4204. doi: 10.1126/scitranslmed.aax4204
留言 (0)