
記住我


All experiments were conducted according to the Canadian Council on Animal Care guidelines and were approved by the University of Alberta’s Biosciences Animal Care and Use Committee (protocol: AUP 960). All animals were closely monitored following surgery until euthanasia.
SubjectsOne hundred male Sprague Dawley rats (~ 3–4 months old for all experiments; 250–350 g for Exps. 1 and 3; 300–400 g for Exp. 2) from Charles River Laboratory (Saint Constant, Quebec) were used. Rats were housed 3 to 4 per cage pre-surgery and individually housed post-ICH surgery, in a temperature-controlled environment on a 12-hour light cycle. Food (Purina rodent chow) and water were given ad libitum. All animals were kept in the same location and were not housed according to treatment group.
Experimental DesignThe study was conducted as specified in an a priori planning document (Online Resource 1). Statistical power was calculated to allow for 80% power in our primary endpoint across all experiments, and statistical tests were pre-planned to minimize bias (see Statistical Analyses section below). Any deviations from our plan are noted in the text. Sterile solutions of 3% HTS or normotonic 0.9% saline (SAL) were administered to the lateral teil vein while under isoflurane anesthetic. For Exp. 1, a single dose of HTS or SAL was administered at 2-hours post-ICH, and for Exps. 2 and 3, two doses of HTS or SAL were administered, one each at 2- and 14-hours post-ICH. A graphical depiction of experimental timelines is provided (Fig. 1). All animals were assigned to groups using a random number generator (random.org). For all experiments, researchers were blinded by a third experimenter for both treatment (HTS vs. SAL) and, where applicable, surgery (ICH vs. SHAM). Specifically, unlabelled syringes of SAL or HTS were prepared by one researcher, and administered by another who was blinded to group identity for all experiments. For Exp. 3, coded vials of collagenase or 0.9% saline (ICH vs. SHAM) were prepared by a separate researcher to ensure the surgeon was blinded to group identity.
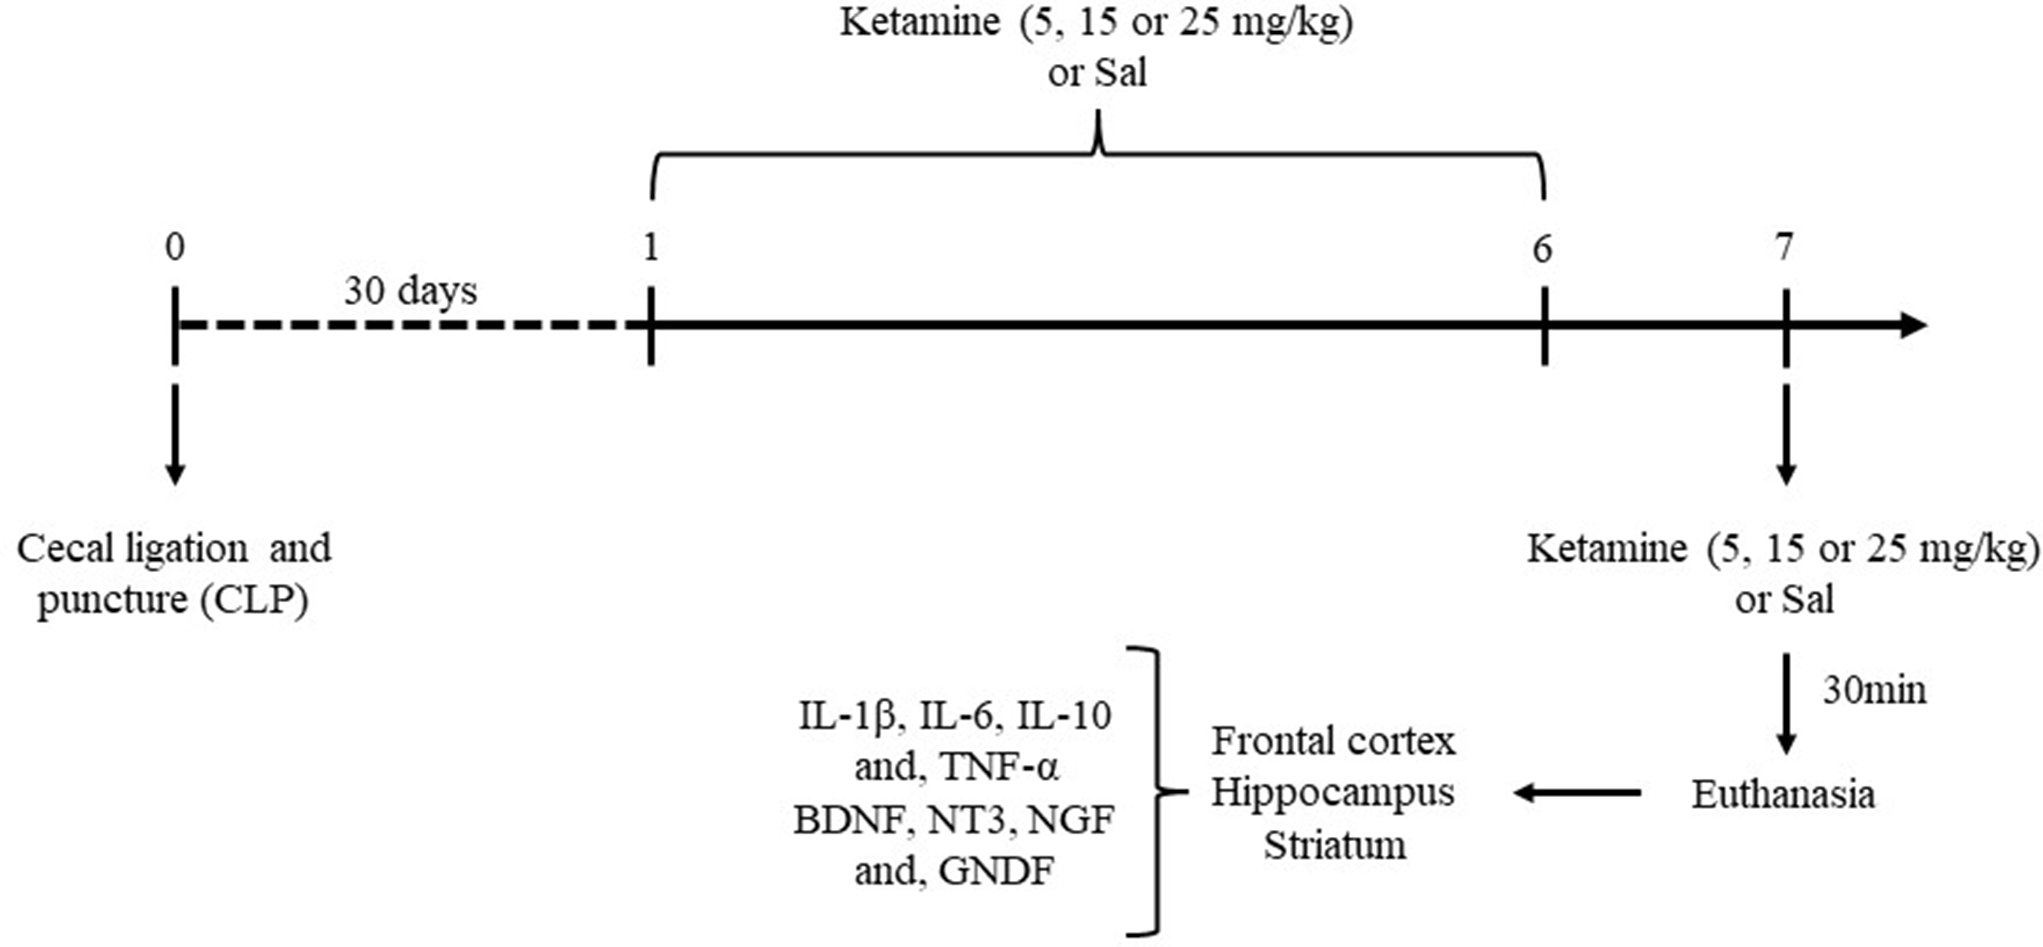
Fig. 1
Timeline of Experiments Experimental timelines for all experiments are shown. Shaded bars indicate bolus dosing of HTS (3% hypertonic saline) or SAL (0.9% saline). Hematoma volume, via hemoglobin assays, and pain, via the Rat Grimace Scale, were assessed in Exp. (1). Global edema, via wet-weight dry-weight, and behaviour, via the Neurological Deficit Scale, were assessed in Exp. (2). Cell volume and cell packing density, along with ultrastructural morphology and NDS were assessed in Exp. (3). HemV = Hematoma Volume, RGS = Rat Grimace Scale, NDS = Neurological Deficit Scale, CV = Cell Volume, CD = Cell Density, Ultrastructure = Ultrastructural morphology. ICH animals received a striatal injection of collagenase (in saline), while SHAM animals received a striatal injection of 0.9% saline of the same volume. Figure 1 was created with the use of BioRender.com (Toronto, ON)
Experiment 1The primary endpoint for our first experiment was hematoma volume at 8-hours post-ICH. Rats were randomized into two groups, SAL or HTS, administered once at 2-hours post-ICH, with n = 12 per group before mortality and exclusions (total N = 24). To rule out discomfort due to HTS injections, pain was assessed via the Rat Grimace Scale (RGS), immediately before and after injection.
Experiment 2The primary endpoint for our second experiment was edema at 24-hours post-ICH, with n = 20 rats per group before mortality and exclusions. Rats were given either SAL or HTS (total N = 40). All animals were assessed with the neurological deficit scale (NDS) at 24-hours post-ICH.
Experiment 3The primary endpoint for this experiment was cell volume at 24-hours post-ICH, assessed via stereology. Rats received either ICH or SHAM surgeries, with n = 24 ICH rats and n = 12 SHAM rats. These received either SAL or HTS, resulting in 4 groups (n = 12 ICH-SAL rats, n = 12 ICH-HTS rats, n = 6 SHAM-SAL rats, n = 6 SHAM-HTS rats; total N = 36). All animals were assessed with the NDS immediately before euthanasia. Both cell volume and cell density were assessed in ipsilateral CA1 (cornu ammonis 1) and S1 (primary somatosensory cortex). A subset of rats from each group (n = 3 SHAM-SAL rats, n = 3 SHAM-HTS rats, n = 6 ICH-SAL rats and n = 6 ICH-HTS rats) were randomly selected for qualitative analysis of contralateral CA1 subcellular health via TEM, which was assessed in a blinded manner. We limited TEM measurements to a subset of rats for feasibility.
Intracerebral HemorrhageICH surgery was performed as previously described (Rosenberg et al. 1990; MacLellan et al. 2008; Kung et al. 2021). Briefly, rats were anesthetized with isoflurane (4% induction and 2% maintenance, in 70% N2O and balance O2) for the duration of the surgery. ICH was induced via bacterial collagenase injection (3µL of Type IV-S, Sigma, 0.2U/µL in saline) into the left striatum (0.5 mm anterior, 3.5 mm lateral, and 6.5 mm depth from bregma (Paxinos and Watson 1986)). Bupivicaine hydrochloride (5 mg/mL, SteriMax, Oakville, ON) was delivered subcutaneously to the site of incision, prior to the cut and prior to closing the wound. A rectal probe was inserted to monitor temperature, which was maintained at ~ 37 °C throughout the surgery using heating mats. Immediately following surgery, all rats were given 5 mL of 0.9% saline subcutaneously, as recommended by our animal care committee for all surgeries causing a large stroke, and allowed to wake up naturally. All rats were given wet Purina rat chow to reduce risk of dehydration and weight loss. SHAM surgeries were induced identically, including all care interventions, but with 0.9% saline injections (rather than collagenase) into the striatum.
Hypertonic Saline AdministrationBoth SAL and 3% HTS were given at 2 mL/kg and administered via the lateral tail vein under isoflurane anesthesia. Animals were kept under anesthetic for an average of 8 min in Exp. 1 and 6 min in Exps. 2 and 3, in a manner consistent across groups. Tails were gently washed with warm water and placed on a heating mat to facilitate vasodilation. The injection site was cleaned with 70% ethanol prior to injection, and pressure was applied immediately afterwards with gauze to minimize bleeding. Although previous animal work have investigated concentrations as high as 23.4% HTS (Qureshi et al. 1999; Schreibman et al. 2018), clinical studies tend to recommend lower concentrations of HTS, ranging from 3 to 7.5%, partly due to the potential for adverse side effects (e.g., hyperchloremic acidosis) (Fink 2012; Bouchat et al. 2019; Shoamanesh et al. 2021; Holden et al. 2023).
Behavioural Assessments (NDS & RGS)The Rat Grimace Scale (RGS) was used to assess pain due to injection in Exp. 1 (Sotocina et al. 2011). Rats were filmed immediately before and after HTS or SAL injection to evaluate their facial expressions to quantify pain and discomfort, as previously described (Kung et al. 2021). Orbital tightening, nose and cheek flattening, and whisker and ear changes were assessed on a scale from 0 to 2. Scores were then tallied to produce a composite score ranging from 0 to 10, with 0 indicating no pain and 10 indicating the maximum pain measurable by the scale.
For Exps. 2 and 3, NDS was used to assess functional outcome, as previously described (Kung et al. 2021). Briefly, prior to baseline, rats received one training session to gain familiarity with the specific behavioural tests. Spontaneous circling, beam walking ability, contralateral hindlimb retraction, contralateral forelimb flexion, and bilateral forepaw grasp were assessed for NDS, with the total score ranging from 0 (no deficit) to 14 (severe impairment). A baseline measure was recorded 2 days prior to ICH for comparison with post-ICH scores.
Hemoglobin AssaysTo assess the effects of HTS on bleeding, animals were euthanized by decapitation (under isoflurane) 8-hours post-ICH in Exp. 1. Hemoglobin assays were conducted as previously described (Choudhri et al. 1997; Kung et al. 2021). Briefly, extracted brains were separated into ipsilateral hemisphere, contralateral hemisphere, and cerebellum, then homogenized and centrifuged. The supernatant was combined with Drabkin’s reagent and absorbance was recorded at 540 nm. Hematoma volume was calculated by correcting against contralateral blood volume (ipsilateral blood volume – contralateral blood volume = hematoma volume).
EdemaEdema was measured in Exp. 2, at 24-hours post-ICH, as previously described and commonly done (Jiang et al. 2016; Wilkinson et al. 2019; Kung et al. 2021). Briefly, brains were blocked from 2 mm anterior to 4 mm posterior of the collagenase injection site, and then split into ipsilateral striatum and cortex, contralateral striatum and cortex, and cerebellum. Brains were weighed (wet weight), dried at 100 °C for 24 h, and re-weighed (dry weight). Brain water content was determined as \(\:\frac\times\:100\%\).
Tissue Preparation for Histology (Stereology and Transmission Electron Microscopy)All animals in experiment 3 were euthanized 24 h post-ICH via a ~ 100 mg/kg intraperitoneal injection of sodium pentobarbital (Bimeda MTC, Cambridge ON), as previously described (Kalisvaart et al. 2020). Briefly, rats were perfused with 0.9% saline, followed by Karnovsky’s fixative (Fix and Garman 2000; Kalisvaart et al. 2020). Brains were kept in situ within the skull in fresh fixative for 24 h at 4 °C to prevent histological artefact. After 24 h, brains were split into the ipsilateral hemisphere for stereology, while the contralateral CA1 was dissected out for TEM in 1 × 2 mm blocks.
StereologyStereological assessment was conducted as previously described (Wilkinson et al. 2023). Briefly, the ipsilateral hemispheres of brains were sectioned into 80 μm thick coronal sections using a vibratome (Leica VT1200 S), with a random start point to ensure systematic random sampling. Images (three per region) were taken at 40x magnification in ipsilateral medial CA1 (sections ranging from approximately − 3.3 mm to -4.16 mm anterior to bregma) and ipsilateral layer III/IV of S1 (0.7 mm to -0.26 anterior to bregma), using stereotaxic landmarks to remain consistent across animals (Paxinos and Watson 1986). Cell volume and density assessments in ipsilateral CA1 and S1 were made using the nucleator probe and stereological counting rules, respectively, in conjunction with the optical dissector method (Gundersen et al. 1988), as described previously (Wilkinson et al. 2023). An Olympus BX51 microscope outfitted with a XYZ motorized stage controller (Marzhauser Wetzlar, Germany) and calibrated to the Olympus cellSens Dimensions image acquisition and analysis software (Olympus Life Science Solutions, Japan) was used to take these measurements.
Transmission Electron MicroscopySample blocks for TEM were first processed (buffer rinsing, secondary fixation, and dehydration), then embedded in resin. Using an ultramicrotome (Reichert-Jung, Ultracut E), semi-thin (1 μm) sections of the contralateral hippocampus were taken and stained with toluidine blue to locate and block off the region of interest (e.g., stratum pyramidale layer of CA1). Ultra-thin sections were taken (90 nm), mounted on grids, and stained with uranyl acetate and lead citrate. Grids were then imaged using a Phillips-FEI Morgagni 268 80 kV (Phillips-FEI, Oregon, USA) transmission electron microscope at several different magnifications by an experimenter blinded to group identity. A minimum of five hundred CA1 neurons were examined per animal, across at least two CA1 tissue sample blocks. Images were then sent to a neuropathologist (FvL) for expert qualitative evaluation of cellular ultrastructure and health across experimental groups, which was conducted in a blinded fashion.
Statistical AnalysesData were analyzed using GraphPad Prism (v 10.1.0 for Windows, GraphPad Software, Boston, Massachusetts USA). All data are presented as mean ± 95% confidence intervals (CI) for parametric data, and median ± interquartile range (IQR) for non-parametric data. All data were tested for assumptions and analyzed non-parametrically when assumptions were not met. All statistical analyses and procedures were conducted as specified in our a priori planning document (Online Resource 1), except where explicitly noted below. Sample sizes were calculated to provide 80% power for each experiment’s primary endpoint (25% change in hematoma volume for Exp. 1; 1.5% absolute change in edema for Exp. 2; 15% difference in neuronal soma volume for Exp. 3) and increased to account for potential mortality in our large stroke model (~ 10% at 24 h). Detailed justification regarding effect sizes used for all power calculations are provided in our supplemental information (Online Resource 1).
For Exp. 1, hematoma volume was analyzed using a Mann-Whitney test (planned: t-test) due to non-normality. Pain via RGS was analyzed using Mann-Whitney tests. For Exp. 2, edema was compared between groups within brain regions using Mann-Whitney tests and within groups between brain regions using a Friedman test, due to non-normality (planned: two-way ANOVA with Tukey’s HSD). Behaviour in Exps. 1 and 2 were analyzed using Mann-Whitney tests. Additionally, we conducted an unplanned assessment of behaviour across time using a Wilcoxon matched-pairs signed ranks test, and in Exp. 3 analyzed behaviour using a Kruskal-Wallis with Dunn’s multiple comparisons (planned: Mann-Whitney) to allow for comparison across the four experimental groups. We conducted an unplanned compiled behavioural analysis of all animals from Exps. 2 and 3 using a two-way ANOVA with Fisher’s LSD. For Exp. 3, cell density (stereology) was analyzed using two-way ANOVA with Tukey’s HSD. Cell volume (stereology) was analyzed using independent t-tests with Welch’s correction (planned: two-way ANOVA with Tukey’s HSD) due to heteroscedasticity. Subcellular morphology (TEM) were analyzed qualitatively only (planned: two-way ANOVA with Tukey’s HSD). To minimize likelihood of missing a treatment effect, or Type II error, interval and ratio level data were additionally analyzed parametrically, which did not change our findings (data not shown).
留言 (0)