
記住我
Hepatitis C Virus (HCV) is a hepatotropic enveloped positive-sense, single-stranded RNA virus, which is a member of the family Flaviviridae. The HCV virus genome is ⁓9.6kb, containing a large Open Reading Frame (ORF) flanked by 5’ and 3’ untranslated region (UTR) at its two ends1,2. The 5’ UTR region is 341 nucleotides long and contains an Internal Ribosome Entry Site (IRES) structure, which mediates cap-independent translation of ORF (0287-030). The ORF codes a long polyprotein of 3,022 amino acids, which is further cleaved by cellular and viral proteases into three structural proteins (core C, enveloped E1 and E2) and seven non-structural proteins (P7, NS2, NS3, NS4A, NS4B, NS5A, NS5B)1,2.
HCV exhibits extensive genetic diversity, giving rise to multiple genotypes (GTs), subtypes and quasispecies in infected hosts1,2. The vast genetic diversity is attributable to poor fidelity of RNA-dependent RNA polymerase (RdRp) enzyme, high replication rate, expansive population and short generation time. This allows the virus to evade the immune system, sustain chronic infection and poses a threat to the development of drug resistance and of vaccines against HCV3.
Sequence and phylogenetic analysis of Core/E1 or NS5B revealed six major GTs and numerous subtypes. The GTs differ in 30–35 per cent of nucleotide sites, and subtypes differ in 15-25 per cent4,5, which varies with geographical variation. The so-called ‘epidemic strains’, 1a, 1b, 2a and 3a, are globally distributed and ‘endemic strains’ are restricted to specific geographical regions. GTs 4, 5 and 6 are predominantly distributed in Central Africa, the Middle East, Southern Africa and Southeast Asia, respectively6. In 2015, a novel HCVGT was identified in a patient from the Democratic Republic of Congo, later classified as GT-7b7. In 2018, Borgia et al 8 for the first time, reported HCVGT, GT-8 from four patients from Punjab, India, expanding the classification of HCV GTs from GT-1 to GT-88. Here, we report GT-8 from a patient from Assam, making it the second report from India and the first from north-east India.
HCV infection is comparatively more prevalent in north-east India than in the rest of the country9. However, there are only a few published reports of HCV GT distribution from northeastern States, which share an international border with Myanmar, which is part of the ‘Golden Triangle’ known for illicit drug trafficking. These studies indicate heterogeneity in HCVGT distribution. Moreover, these studies were from limited locations and covered specific populations.
This study aimed to evaluate the distribution of HCVGTs and their subtypes in different risk groups in Assam, north-east India.
Material & MethodsA hospital-based cross-sectional study was conducted at the department of Microbiology, Gauhati Medical College and Hospital, Guwahati, Assam from April 2021 to March 2022 after obtaining approval from the Institutional Ethics Committee.
Study design and participantsAll the consecutive study participants reactive for Anti-HCV antibody in enzyme-linked immunosorbent assay (ELISA) were included in the study after procuring informed written consent. Among them, study participants with detectable HCV RNA were considered for genotyping. All data, including demographic parameters and the history of relevant risk factors, were collected in pre-designed proforma. A total of 17,893 samples were screened for HCV by ELISA (J. Mitra and Co. Pvt. Ltd., New Delhi). Among them, 300 (1.67%) samples were found to be HCV seropositive, out of which HCV RNA was detected in 292 cases (292/300; 97%). All these 292 cases were included for further analysis.
Sample collection and screening for HCV, HBV and HIVFive millilitres of venous blood was collected in an Ethylenediamine tetra acetic acid vial under aseptic conditions. Plasma was separated immediately and stored at ‒80˚C until use. Screening of samples for anti-HCV antibodies was done by a third-generation ELISA using HCV Microlisa kit (J. Mitra and Co. Pvt. Ltd., New Delhi). They were also screened for Hepatitis B virus (HBV) surface antigen using HBV-ELISA kit (Merilisa HBsAg, Meril Diagnostics Pvt. Ltd.) and human immunodeficiency virus (HIV) using three kits according to the National AIDS Control Organisation (NACO) guidelines10.
Detection of HCV RNA viral loadDetection of HCV RNA viral load in ELISA-positive samples was done by Reverse Transcription-Polymerase Chain Reaction (RT-PCR). Extraction of HCV RNA from plasma samples was done using the QIAamp Viral-RNA Mini Kit (QIAGEN, Hilden, Germany). A real-time RT-PCR (qRT-PCR) was carried out in a CFX96 thermal cycler (BIO-RAD, California, USA) using artus® HCV QS-RGQ Kit (QIAGEN, Germany).
HCV genotypingA real-time HCV genotyping RT-PCR was carried out using the PathoDetectTM HCV Genotyping PCR test (Mylab Discovery Solutions, Maharashtra), which can detect GTs 1a, 1b, 2, 3, 4, 5 and 6 by amplification of 5’ UTR and NS5B regions. For the samples whose GTs were not detected by this kit, RNA extraction was followed by synthesis of complementary DNA using Verso cDNA Kit (Thermo Fisher Scientific, USA).
A semi-nested PCR reaction was carried out using published primers11 for amplification of the NS5B region using primers NS5B-1 (5-TAT-GAY-ACC-CGY-TGC-TTT-GAC-3; sense) and NS5B-2 (5-GAG-GAG-CAA-GAT-GTT-ATC-AGC-TC-3; antisense) for primary amplification and primers NS5B-1 and NS5B-3 (5-GAA-TAC-CTG-GTC-ATA-GCC-TCC-G-3; antisense) for secondary amplification. Amplification reactions were pre-incubation for 5 min at 94°C, 35 cycles of denaturation for 30 sec at 94°C, annealing for 32 sec at 51°C, extension for 35 sec at 72°C and a final extension step for 5 min at 72°C. PCR products (Fig. 1) were sent for sequencing analysis.
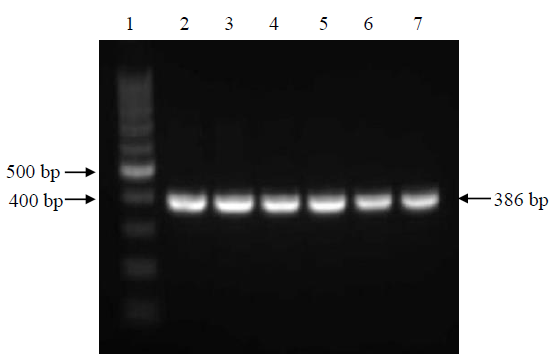
Export to PPT
Sequence and phylogenetic analysis for determination of HCV genotypes and sub-genotypesDNA sequencing was done using the dideoxynucleotide method on Applied Biosystems 8 Capillary Genetic Analyser (Thermo-Fisher Scientific, USA). Raw sequence data were manually edited to construct consensus sequences using Bioeditv.7.0.12, Basic Local Alignment Search Tool (BLAST)13analysis was done to find the best homology of sequences. A total of 94 reference sequences were retrieved from NCBI GenBank, comprising all eight GTs and their sub-GT sequences. A molecular phylogenetic tree was created using molecular evolutionary genetic analysis software (MEGA-X)14. Multiple sequence alignment was performed using the built-in Clustal-W integrated in MEGA-X software. The tree was created using the maximum likelihood method based on the GTR+G+I model. The reliability of the phylogenetic tree was tested using 1,000 bootstrap values.
GenBank sequence accession numbersThe sequencing data of 15 HCV GTs obtained from our study were submitted to NCBI GenBank (Accession numbers: OQ660324 to OQ660338).
Statistical analysisAbsolute numbers and percentages were used to analyze data using Microsoft Excel and GraphPad Prism software. We used a chi-squared test to compare categorical variables. One-way analysis of variance was used to compare group means. A P value of ≤0.05 was considered to be significant.
Results Sociodemographic parameters and potential risk factors with age based stratificationThe study participants’ socio demographic parameters and potential risk factors are presented in Table I. The participants’ mean (±standard deviation) age was 30.24±12.17 yr, with males outnumbering females. The majority of the participants were educated up to high-school level or higher, unemployed, unmarried and from urban areas (P≤0.05).
Table I. Sociodemographic parameters and potential risk factors stratified by age group
Parameters Age ≤40 yr (n=238), n(%) Age >40 yr (n=54), n(%) Total (n=292), n(%) OR (95% CI) P value Sex Males 220 (92.43) 44 (81.48) 264 (90.41) 2.78 (1.2‒6.42) 0.013 Females 18 (7.56) 10 (18.52) 28 (9.59) Locality Urban 130 (54.62) 18 (33.33) 148 (50.68) 2.41 (1.29‒4.48) 0.004 Rural 108 (45.38) 36 (66.67) 144 (49.31) Education Illiterate 0 3 (5.56) 3 (1.02) – 0.002 Primary school education 7 (2.94) 1 (1.85) 8 (2.74) 1.61 (0.19‒13.33) High school & higher secondary 159 (66.8) 23 (42.59) 182 (62.33) 2.71 (1.48‒4.96) Graduate & postgraduate level 72 (30.25) 27 (50) 99 (33.9) 0.43 (0.24‒0.79) Occupation Unemployed 92 (38.66) 10 (18.52) 102 (34.93) 2.77 (1.33‒5.78) <0.00001*** Student 72 (30.25) 0 72 (24.66) – Government employee 3 (1.26) 12 (22.22) 15 (5.14) 0.04 (0.01‒0.17) Businessman 4 (1.68) 8 (14.81) 12 (4.11) 0.03 (0.01‒0.08) Private sector worker 15 (6.3) 1 (1.85) 16 (5.48) 3.57 (0.46‒27.59) Shopkeeper 14 (5.88) 6 (11.11) 20 (6.85) 0.5 (0.18‒1.37) Skilled labourer (electrician/plumber) 8 (3.36) 2 (3.7) 10 (3.42) 0.95 (0.19‒4.58) Driver 16 (6.72) 5 (9.25) 21 (7.19) 0.71 ( 0.25‒2.02) Farmer 6 (2.52) 7 (12.96) 13 (4.45) 0.17 (0.06‒0.54) Daily wage worker 8 (3.36) 3 (5.55) 11 (3.77) 0.62 (0.16‒2.41) Marital status Married 62 (26.05) 54 (100) 116 (39.72) 0.01 (0‒0.05) 0.001** Unmarried 176 (73.95) 0 176 (60.27) Risk factors Intravenous drug use 211 (88.66) 6 (11.11) 217 (74.31) 62.52 (24.46‒159.8) <0.00001*** Transfusion of blood/blood products 14 (5.88) 16 (29.63) 30 (10.27) 0.5 (0.18‒1.37) Haemodialysis 6 (2.52) 21 (38.89) 27 (9.25) 0.04 (0.02‒0.11) Tattooing/piercing 96 (40.34) 1 (1.85) 97 (33.22) 35.83 (4.87‒263.5) Contact of known positive 3 (1.26) 1 (1.85) 4 (1.37) 0.68 (0.07‒6.63) Co-infections HIV co-infection 52 (21.85) 0 52 (17.8) – – HBV co-infection 10 (4.2) 0 10 (3.42)Among all the assessed risk factors, injecting drug use (IDU) was most commonly associated [74.31%, Odds ratio (OR) 62.52, 95% confidence interval (CI): 24.46‒ 159.8, P≤0.05] with HCV seroreactive status, followed by tattooing and/or piercing (33.22%), transfusion of blood and blood products (10.27%) and haemodialysis (9.25%). Co-infection with HIV was found in 52 cases (17.8%) and HBV in 10 cases (3.42%). Both HIV and HBV co-infections were found in one case (0.34%).
Genotype distribution among casesThe most common GT detected was GT-3 in 273 cases (93.49%), followed by GT-5 in two cases (0.68%) and GT-1a in one case (0.34%). GTs could not be assigned to 16 cases by RT-PCR. These were subjected to PCR amplification of NS5B region and sent for sequencing. Upon BLAST analysis, GT-1a was detected in four cases, followed by GT-1b and GT-3a in three cases each, GT-3b and GT-3i in two cases each and GT-6xa and GT-8 in one case each. Furthermore, the two samples classified as GT-5 by q RT-PCR were reclassified as GT-1a and GT-1b on sequencing.
Mean viral loads in different genotypesMean viral loads in different GTs were compared using one-way analysis of variance are presented in Supplementary Table. No significant association was observed between GT distribution and viral load (P= 0.4038).
Correlation of HCV genotype with risk factorsDistributions of HCVGTs and potential risk factors are depicted in Figure 2. Most common GT in all risk groups was GT-3.GT-1 was detected in 4.15 per cent of IDU cases, 5.15 per cent of cases with tattoos and/or piercings and 7.7 per cent of cases with HIV co-infections. The single case of GT-6xa had history of IDU, tattooing and HIV co-infection. No history of risk factors could be elicited from the single case of GT-8.
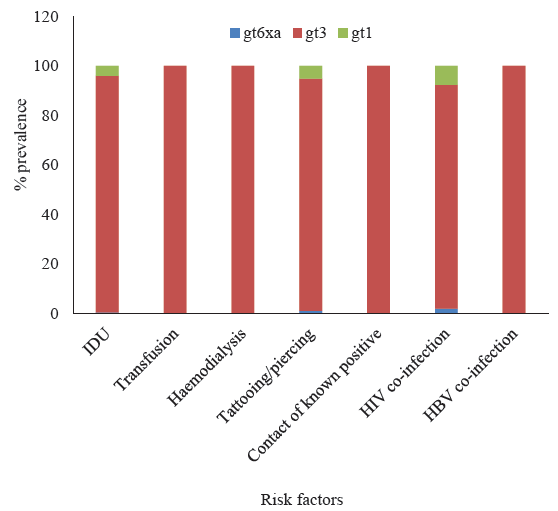
Export to PPT
Characteristics of the single HCV-infected individual with genotype 8The single HCV-infected individual with GT 8 was a 65-yr-old male without any travel history outside Assam. The individual was incidentally identified during the initial screening when he presented to the outpatient department with an accidental prick on his foot. At the time of detection, his liver function tests were within normal limits.
Anti-HCV treatment was initiated with pan-genotypic directacting antiviral agents (DAAs) sofosbuvir-velpatasvir (12-wk course). After 24 wk of DAA administration, HCV RNA testing revealed levels below the detection limit.
Phylogenetic analysisResult from phylogenetic analysis (Fig. 3) of 15 of the sequenced samples suggested that eight samples belonged to GT-3, out of which three samples (3_FP1, 5 and 38) fell into sub-GT 3a, three samples (8_FP1, 17_FP1 and 21) into sub-GT 3b and two samples (77 and 8_5F) into sub-GT 3i. Five samples belonged to GT-1, which upon sub-genotyping suggested that two samples (7 and 10) fell into sub-GT 1a, one sample (2) into sub-GT 1b and two samples (9 and 17_5F) had independently segregated. One sample (13) belonged to GT-6 and fell into sub-GT 6xa and one sample (3) belonged to the newly identified GT-8 and was classified into a single sub-GT 8a.
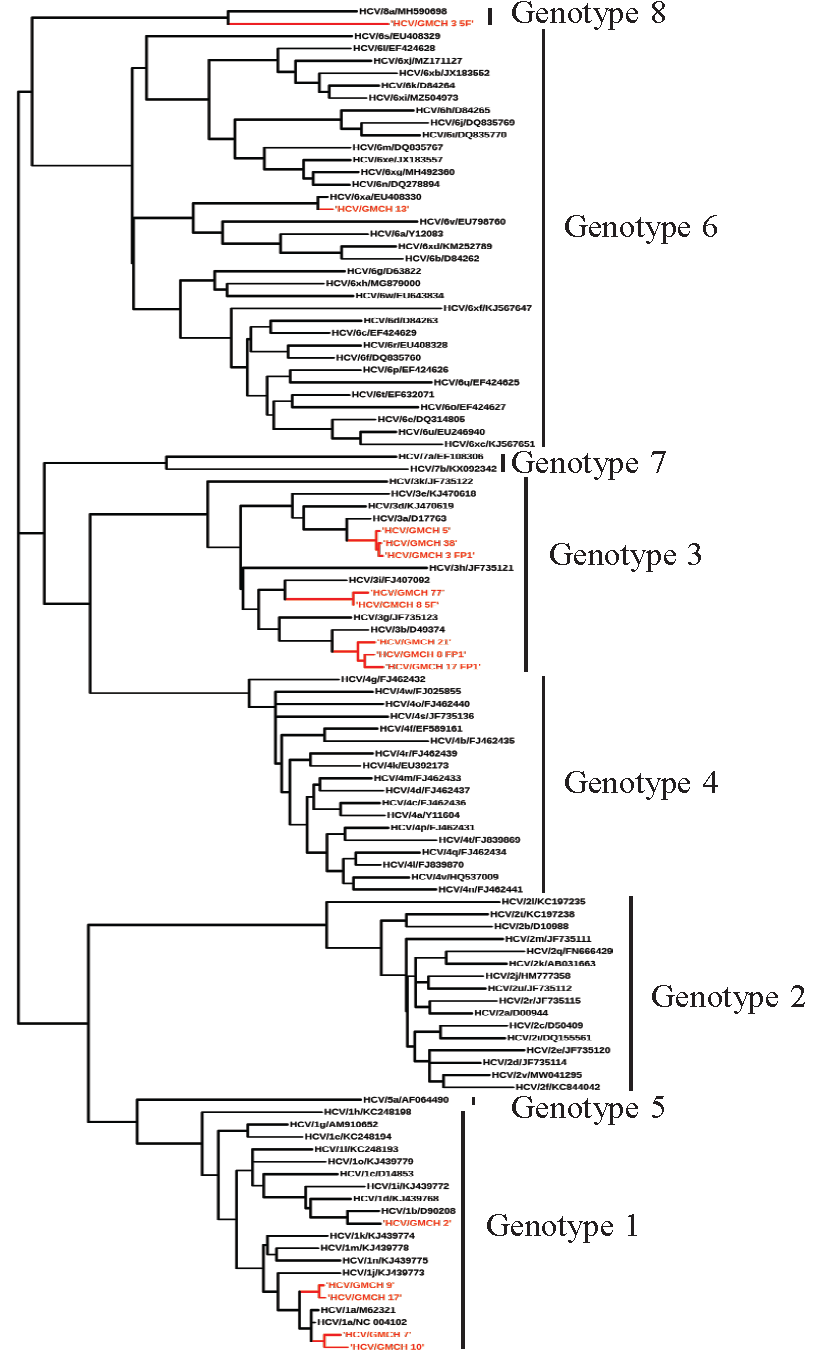
Export to PPT
DiscussionThe important finding in this study was the detection of GT-8 for the first time from Assam, north-east India as per the authors’ knowledge. GT-8 was first reported from Punjab, India, by Borgia et al 8 (2018). This is the second report of HCVGT8 from India. Like the previously reported cases, no potential history of exposure to HCV could be elicited in our study participants, who never travelled outside India. This indicated the endemic nature of HCV GT-8 in India. In the future, an in-depth investigation with a large number of samples from different communities with molecular studies will help in understanding the natural history of such transmission.
The predominant GT detected in this study was GT-3, followed by GT-1. Previous reports also indicated GT-3 and GT-1 as predominant strains in India15-17. Interestingly, GT-6, which is increasingly being reported from other north-east Indian States, was not detected in our study except one subtype 6xa18,19. Most studies where GT-6 were detected were from States of north-east India sharing an international border with Myanmar, a member country of the ‘Golden Triangle’, where GT-6 is a dominant HCVGT20,21. Unlike other northeastern State of north-east India such as Manipur, Mizoram and Nagaland, Assam does not share a common international border with Myanmar. However, our findings cannot be generalized to the overall population of Assam, as the study participants were hospital-based and limited to a few districts of middle and lower Assam and did not adequately represent the entire State.
Genotypes GT-2 and GT-4 were not detected in this study. In contrast, a study done by Medhi et al18 reported GT-2 and GT-4 predominantly in the tribal population from Assam and Manipur; most of those study participants were between the age of 40–49 yr, and among them, 34.6 per cent were people who inject drug (PWID). In fact, GT-4 was found to be the most common GT followed by GT-3, GT-1 and GT-218.
Our findings were in concordance with the study by Solomon et al 15 in injecting drug users (IDUs) from north-east India, who found GT-3 as the most commonly detected GT (58.1%), followed by GT-1 (36.2%) and GT-6 (5.7%) and age of the study population being less than 40 yr15. In another study done by Saha et al16 in IDUs in Manipur, the predominant GT was revealed to be GT-3, followed by GT-1 and GT-6 and the viral load was significantly higher among GT-1 (4.5-7.4 log10IU/ml) and GT-3 (4.0-5.4 log10IU/ml) than GT-6 (3.5-4.2 log10IU/ml)16. The age of our HCV-infected PWID population was less than 40 yr and high viral load was observed in GT-1 (5.94 log10IU/ml) and GT-3 (6.46 log10IU/ml) which was in agreement with the study done by Saha et al16.
Injecting drug use is considered as a major contributing and driving risk factor, both for localized and wider spread of HCV22,23. Studies showed that young PWID were more likely to share needles and other intravenous equipment than the older group, and it was one of the prime reasons of recent increase in HCV infection in the youths24-30. A systematic review31 of the disease burden among PWIDs highlighted significant regional heterogeneity in north-east India, where HCV prevalence exceeded 50 per cent, alongside consistently high rates of HIV prevalence31. Unpublished data from Assam and Karnataka reported seroprevalence rates of HCV infection among PWIDs ranging from 50 per cent to 83 per cent31.
As HCV is primarily transmitted through the parenteral route, high exposure to other blood-borne viruses like HBV and HIV can be seen in PWID. It has been estimated that globally, 13 per cent of the PWID are living with HCV-HIV co-infection and three per cent with HCV-HBV co-infection32. This study also showed a similar phenomenon with 17.8 per cent HCV-HIV co-infection and 3.42 per cent HCV-HBV co-infection. The limitation of this study was that we could not perform sequencing for subtyping of all the HCV GT-3 due to resource constraints. The clinical samples from non-IDU participants were very few. As the study was hospital-based, the distribution of HCV GTs and subtypes could not be generalized for the entire State of Assam.
Overall, detection of HCV GT-8 in Punjab and north-east India indicates the endemic nature of the strain in India. However, study in a larger population base from other States will help in evaluating the natural history and the risk factors associated with such infection. Due to the biological nature of HCV, new GTs and subtypes can be expected in future, which will be facilitated by increased population migration and change in risk practices. Real-time knowledge of HCV GT distribution would be crucial for epidemiological studies and understanding virus evolution as well as for the introduction of new target-specific direct acting antiviral drugs.
留言 (0)