
記住我


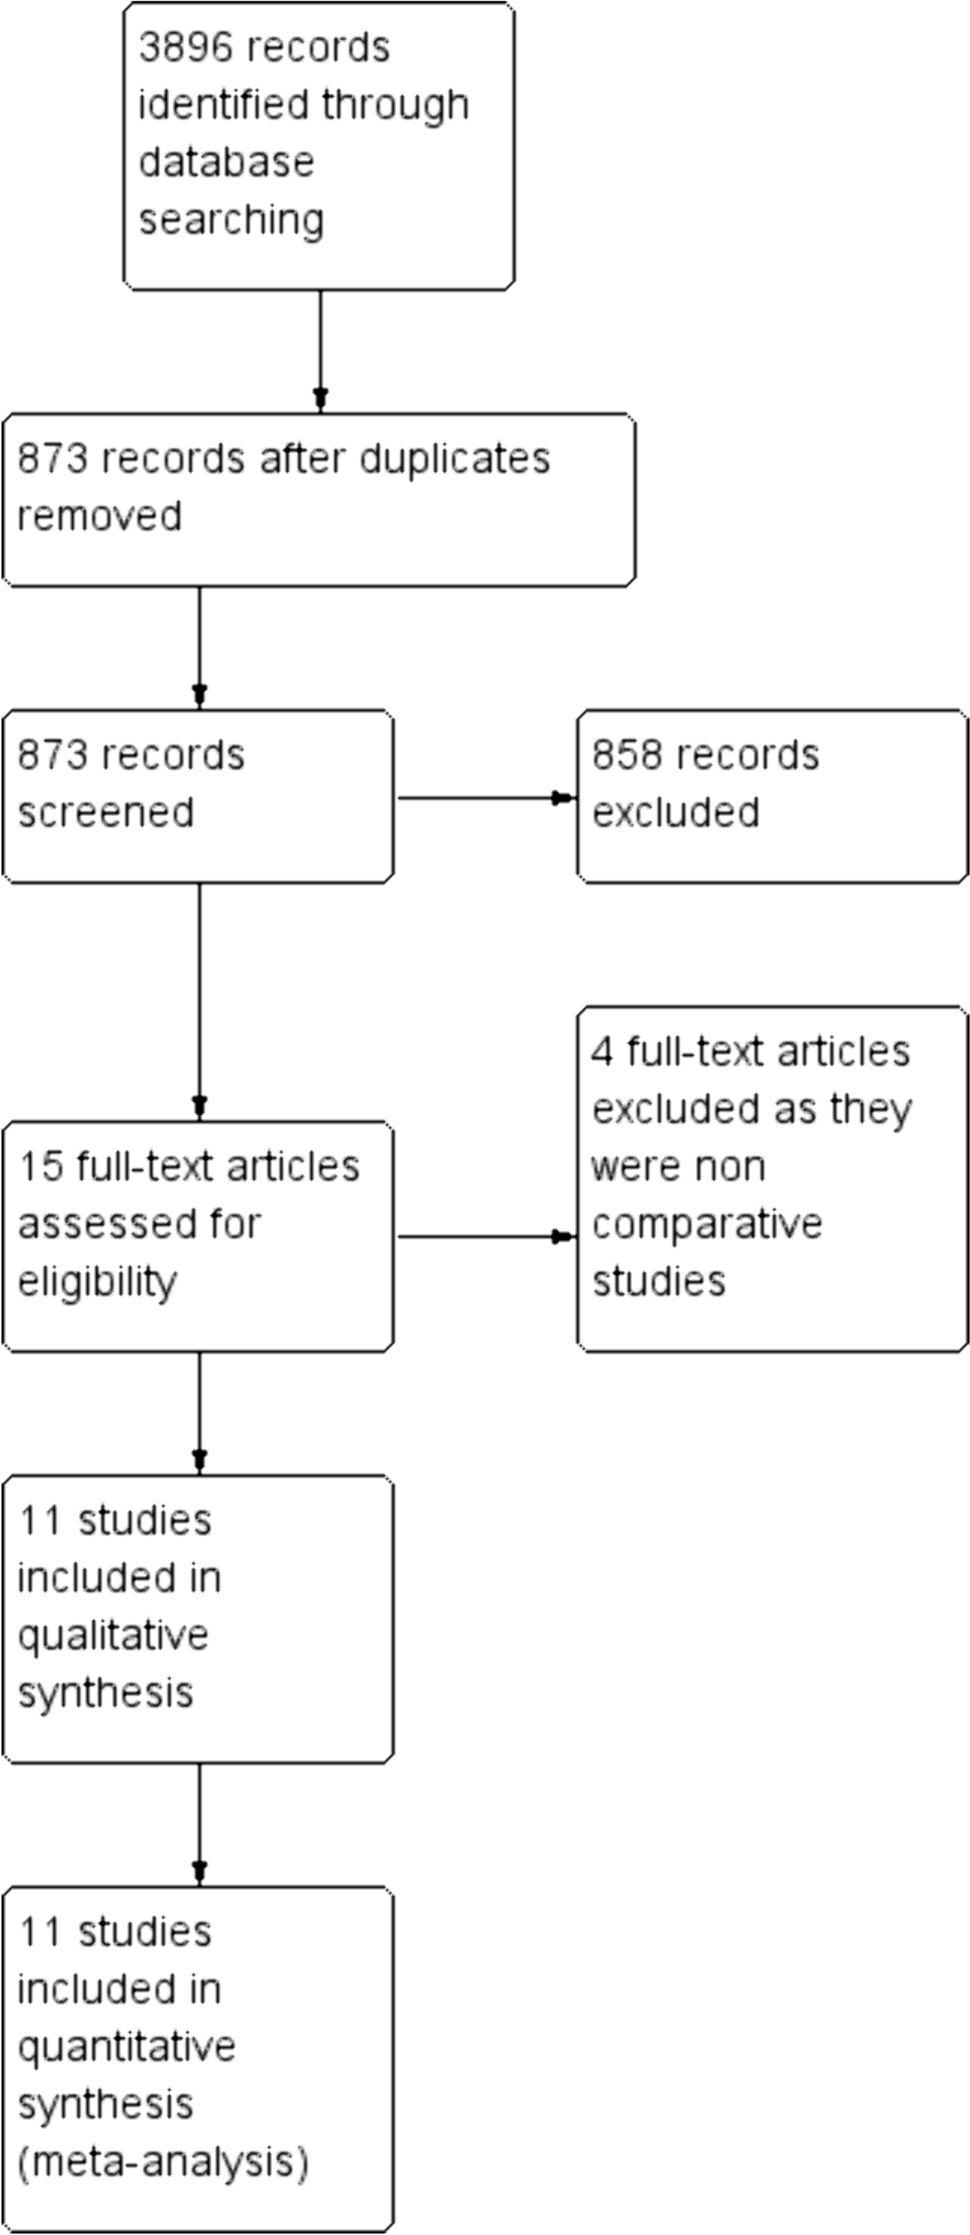
Overall, 11,256 out of 318,548 patients (3.5%) with non-metastatic pathological T0–T1 rectal adenocarcinomas treated with neoadjuvant therapy from the NCDB database were included. Of these patients, 526 (4.6%) underwent local excision as their definitive surgery, while 10,730 (95.4%) patients underwent proctectomy (Fig. 1).
Fig. 1
Study flowchart of included patients
Patient characteristics: before matchingAnalysis of the original unmatched groups demonstrated that patients who underwent local excision were significantly older (66 vs. 60 years, p < 0.001) and were less likely to have private insurance (p < 0.001), but comparable in sex (p = 0.71), race (p = 0.26), Charlson index score (p = 0.17), and residence area (p = 0.4). As for clinical presentation, patients in the proctectomy group presented with a more advanced clinical staging, including more T3 and T4 tumors (p < 0.001) and more N1–2 staging (p < 0.001). Furthermore, patients in the proctectomy group received more chemotherapy compared to the LE group (95.3% vs. 88.8%; p < 0.001). Among patients who underwent proctectomy and had an ypT0 (n = 7361), 589 patients (8%) had a positive ypN (N1 in 519 patients and N2 in 70 patients). Among patients with ypT1 (n = 3843), 562 patients (14.6%) had positive nodal disease (N1 in 489 patients and N2 in 73 patients). A summary of the characteristics of unmatched patients in the LE and proctectomy groups is shown in Table 1.
Table 1 Unmatched comparison of demographic and clinical characteristics between patients with rectal cancer that underwent local excision compared to proctectomy surgeryPropensity score matched analysisAfter propensity score matching, patients in the two groups had similar demographic, clinical, and therapeutic factors, as shown in Table 2.
Table 2 Propensity score matched analysis of patients with rectal cancer treated with neoadjuvant therapy and underwent local excision compared to proctectomy surgeryAccording to the Kaplan–Meier survival with log rank test, the overall survival was similar between the groups, with a mean of 54.1 months in the LE group compared to 54.2 months in the proctectomy group (p = 0.881) (Fig. 2).
Fig. 2
Kaplan–Meier survival curve of propensity score matched patients that underwent local excision as their definitive surgery compared to patients that underwent TME surgery
Analysis of secondary outcomes demonstrated that positive resection margins (1.2% vs. 0.6%; p = 0.45), pathologic T stage (p = 0.07), 30-day mortality (0.6% vs. 0.6%; p = 1), and 90-day mortality (1.5% vs. 1.2%; p = 0.75) were comparable between the groups. The median length of stay (1 vs. 6 days; p < 0.001) was shorter and 30-day readmission rate (5.3% vs. 10.3%; p = 0.02) was lower in the LE group, compared to proctectomy (Table 3).
Table 3 Propensity score matched analysis of patient outcomesSub-analysis of the ypT1 groupWithin the matched cohort, 279 patients had pT1 lesions, with the majority treated by local excision (n = 154, 55.2%). Survival analysis showed no differences in the mean 5-year overall survival (52.9 months for local excision vs. 52.4 months for proctectomy; p = 0.78) (Fig. 3). Furthermore, no differences were seen in the positive margin rates or 30- and 90-day mortality rates (p = 1). The only difference between the groups was in the median length of stay following surgery (1 day for local excision vs. 5 days for proctectomy, p < 0.001). Analysis of secondary outcomes for the ypT1 group can be seen in Table 4.
Fig. 3
Kaplan–Meier survival curve of propensity score matched patients with ypT1 pathology that underwent local excision as their definitive surgery compared to patients that underwent TME surgery. LE, local excision; TME, total mesorectal excision
Table 4 Propensity score matched sub-analysis of patients with ypT1 pathologyFactors associated with overall survivalIn the univariate Cox proportional regression analysis (Table 5), several factors were associated with lower survival, including age (HR 1.061, 95% CI 1.057–1.065; p < 0.001), male sex (HR 1.37, 95% CI 1.265–1.503, p < 0.001), Charlson score (HR 1.61, 95% CI 1.535–1.698; p < 0.001), poorly differentiated histology (HR 1.53, 95% CI 1.32–1.76; p < 0.001), and positive nodal status (HR 1.64, 95% CI 1.41–1.91; p < 0.001), while others, including chemotherapy (HR 0.77, 95% CI 0.7306–2.271; p < 0.001) and local excision (HR 0.63, 95% CI 0.5451–0.7448; p < 0.001), were correlated with increased survival.
Table 5 Cox regression univariate analysis of factors correlated with overall survivalMultivariate analysis of statistically significant factors in the univariate analysis (Table 6) demonstrated that male sex (HR 1.38, 95% CI 1.08–1.77; p = 0.009), higher Charlson score (HR 1.52, 95% CI 1.29–1.79; p < 0.001), poorly differentiated carcinoma (HR 1.61, 95% CI 1.08–2.39; p = 0.02), mucinous carcinoma (HR 3.53, 95% CI 1.72–7.24; p < 0.001), pathological T1 (HR 1.45, 95% CI 1.14–1.84; p = 0.002), and pathological positive nodes (HR 1.94, 95% CI 1.28–2.93; p = 0.001) were among the independent predictors of increased mortality. Chemotherapy (HR 0.82, 95% CI 0.41–1.62; p = 0.56) and local excision (HR 0.91, 95% CI 0.42–1.97; p = 0.82) were not found to be significant predictors of survival.
Table 6 Multivariate Cox regression analysis of factors correlated with overall survival
留言 (0)