
記住我


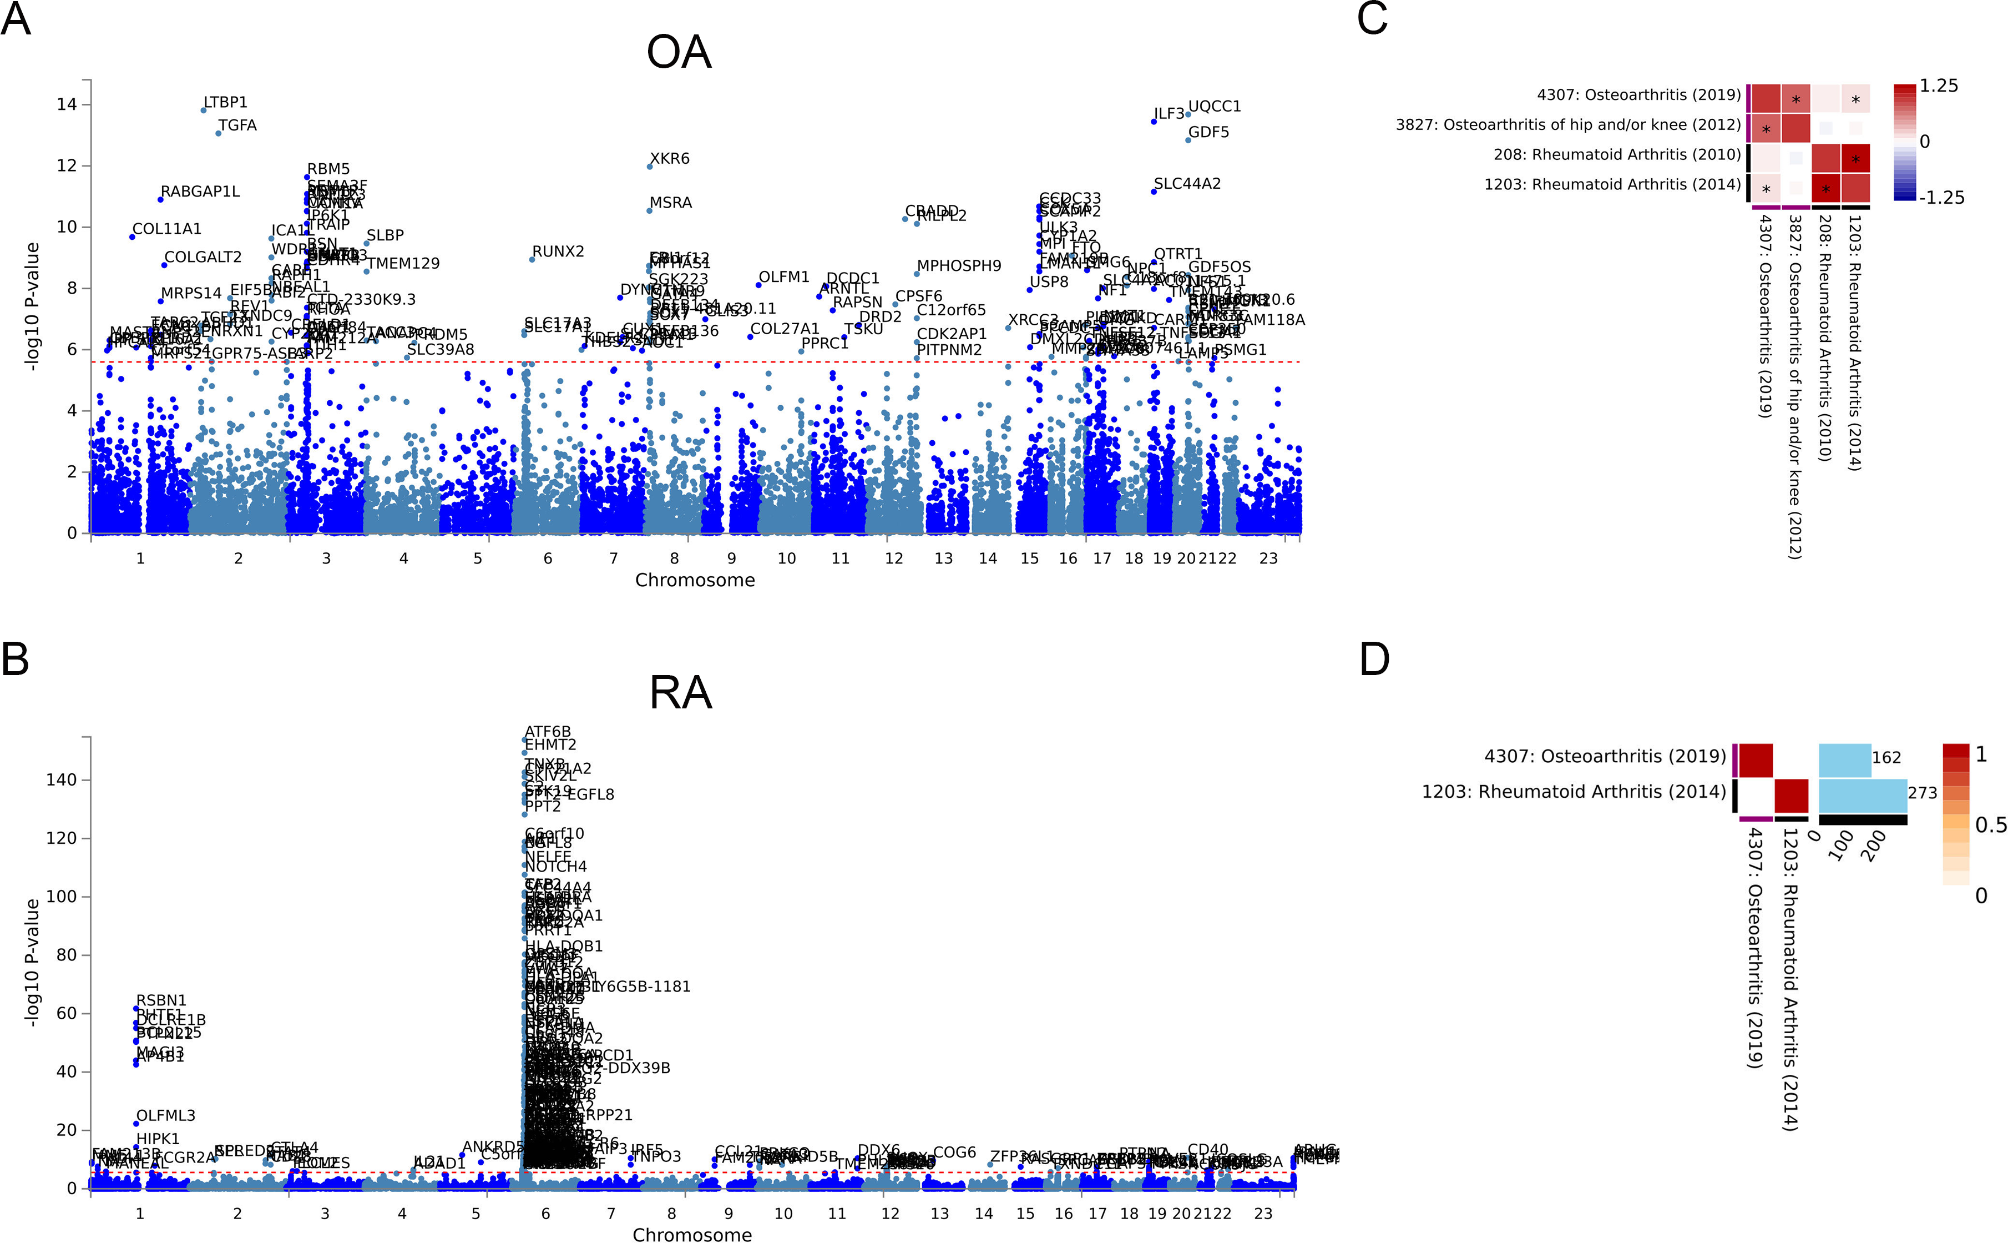


GWAS analysis of the two types of arthritis was carried out in the ATLAS database to identify whether there are shared genetic factors. For OA, 162 independent SNP loci were identified (Fig. 1A). Similarly, 273 independent SNP loci were identified in RA (Fig. 1B). The specific loci are listed in Supplementary Table 1. Comparing the datasets of OA and RA with the multiple GWAS, we found that there was an association between the gene loci of the two diseases (p < 0.05). This indicates that there may be a genetic correlation between OA and RA (Fig. 1C). However, the GWAS results of the two diseases did not find overlapping loci (Fig. 1D).
Fig. 1
Genetic correlation of OA and RA. (A) Manhattan plot of OA specific 162 SNP loci. (B) Manhattan plot of RA specific 273 SNP loci. (C) Genetic correlation analysis of OA and RA after Bonferroni correction. (D) Overlapping genes between OA and RA
Identification of common and differential genes between OA and RATo further investigate the similarities and differences between OA and RA, we used transcriptome data to screen for common and different genes associated with both types of arthritis. The dataset GSE55235 contained 10 normal control samples, 10 OA samples, and 10 RA samples. After screening DEGs with FDR < 0.01 and | log2 FC | > 2, 693 genes were found in OA and normal controls (Fig. 2A-B). 1137 DEGs were found in RA and normal controls, and 395 DEGs were found in OA and RA (Fig. 2C-F). PCA cluster analysis of the dataset showed that there were significant differences between OA, RA and normal controls, while there were similarities between OA and RA (Fig. 3A). The overlap analysis of DEGs showed that 385 DEGs were common DEGs between OA, RA and normal controls. In the Venn diagram, after excluding 24 identical genes, 371 genes were DEGs that differed between OA and RA (Fig. 3B).
Fig. 2
Differentially expressed genes identification. (A) Volcano map of DEGs between OA and normal controls. (B) Heatmap of top 50 DEGs between OA and normal control. (C) Volcano map of DEGs between RA and normal controls. (D) Heatmap of top 50 DEGs between RA and normal control. (E) Volcano map of DEGs between RA and OA. (F) Heatmap of top 50 DEGs between RA and OA
Fig. 3
Enrichment analysis between RA and OA. (A) PCA clustering analysis of OA, RA and normal control samples. (B) Venn diagram screening for DEGs that are the common or different between OA and RA. (C) GO functional enrichment analysis of common DEGs between OA and RA. (D) KEGG pathway of analysis of common DEGs between OA and RA. (E) GO functional enrichment analysis of differential DEGs between OA and RA. (F) KEGG pathway of analysis of differential DEGs between OA and RA
Enrichment Analysis of common and differential genes between OA and RAEnrichment analysis was performed on 385 common DEGs and 371 differential DEGs. GO enrichment analysis showed that the common functions of OA and RA focused on the response to chemical stimuli, the response to cytokine, immune system process. KEGG pathway analysis showed that osteoclast differentiation, mineral absorption and type 1 diabetes mellitus were statistically significant (Fig. 3C-D). The significant differences in functionality between OA and RA are mainly concentrated in the immune system process and lymphocyte activation. In addition, the top enriched pathways include Th17 cell differentiation, Th1 and Th2 cell differentiation and Natural killer cell mediated cytotoxicity (Fig. 3E-F).
Similar and different immune cell infiltration in OA and RAIn order to further explore the similarities and differences of immune cells between the two diseases, we used two algorithms. The MCP algorithm shows that the number of T cells, cytotoxic lymphocytes, B cells, and monocytes is the lowest in the normal control group, with moderate OA and the highest RA (Fig. 4A). Further validation using the CIBERSORT algorithm revealed that CD8 + T cells and Tregs cells exhibited the same trend. Violin diagram showed that compared with OA, the RA group had more plasma cells, activated CD4 + T cells, and helper T cells. However, compared to the normal control, although the OA group had a higher number of these cells, the difference was not statistically significant (Fig. 4B).
Fig. 4
Evaluation of immune cells obtained from transcriptome data using different algorithms. (A) The number of immune cells in OA, RA and normal control group obtained by the MCP algorithm. (B) The number of immune cells in OA, RA and normal control group obtained by the CIBERSORT algorithm
Identification of common and differential cytokines between OA and RA using MR analysisTranscriptome analysis showed that cytokines play a central role in arthritis, and we further analyzed the specific cytokines in arthritis using MR. As shown in Fig. 5, we determined the SNPs of total OA, knee OA, and hip OA, and identified inflammation cytokines associated with three types of OA using the IVW method. Five inflammatory cytokines have a causal relationship with total OA (Eotaxin, C-C motif chemokine 19, C-C motif chemokine 23, Fibroblast growth factor 5 and Vascular endothelial growth factor A), two inflammatory cytokines associated with knee OA (Leukemia inhibitory factor receptor, Matrix metalloproteinase-10), and four inflammatory cytokines associated with hip OA (TNF-related apoptosis-inducing ligand, Eotaxin, C-C motif chemokine 23, Tumor necrosis factor ligand superfamily member 12). Among them, only Vascular endothelial growth factor A and Tumor Necrosis factor ligand superfamily member 12 are risk inflammatory cytokines, while the rest are protective cytokines.
Fig. 5
Using MR analysis to screen for inflammatory cytokines that have a statistically causal relationship with OA. (A-C) Forest plot of the causal relationships between total OA, knee OA, hip OA and significant inflammatory cytokines (OR < 1 indicates protection, OR > 1 indicates pathogenicity). (D-F) Circular map of causal relationships between total OA, knee OA, hip OA and all inflammatory cytokines (Red represents statistically significant)
In Fig. 6, we identified inflammatory cytokines associated with total RA, serum positive RA, and serum negative RA. Three inflammatory cytokines increased the risk of total RA (Tumor necrosis factor ligand superfamily member 12, CD40L receptor, Interleukin-10 receptor subunit beta), two increased the risk of serum positive RA (Tumor necrosis factor ligand superfamily member 12, CD40L receptor), and three increased risk of serum negative RA (Tumor necrosis factor ligand superfamily member 12, CUB domain-containing protein 1, C-X-C motif chemokine 11). C-C motif chemokine 19 and C-C motif chemokine 23 are common protective inflammatory cytokines in OA and RA, Tumor Necrosis factor ligand superfamily member 12 is the same pathogenic inflammatory cytokine.
Fig. 6
Using MR analysis to screen for inflammatory cytokines that have a statistically causal relationship with RA. (A-C) Forest plot of the causal relationships between total RA, serum positive RA, serum negative RA and significant inflammatory cytokines (OR < 1 indicates protection, OR > 1 indicates pathogenicity). (D-F) Circular map of causal relationships between total RA, serum positive RA, serum negative RA and all inflammatory cytokines (Red represents statistically significant)
Identification of common and differential immune cells between OA and RA using MR analysisTo investigate the causal effects of immune cells on OA and RA, we conducted the same grouping and MR analysis. A total of 28 immune cell phenotypes were identified in OA, including 16 protective phenotypes and 12 pathogenic phenotypes (Fig. 7). Total OA and knee OA have two identical pathogenic immune cells (CD27 on unswitched memory B cell, CCR7 on naive CD4 + T cell), while total OA and hip OA have one identical pathogenic immune cell (CCR2 on CD14 + CD16- monocyte).
Fig. 7
Using MR analysis to screen for immune cells that have a statistically causal relationship with OA. (A-C) Forest plot of the causal relationships between total OA, knee OA, hip OA and significant immune cells
76 immune cell phenotypes were identified in RA, including 45 protective phenotypes and 31 pathogenic phenotypes with significant significance (Fig. 8). After adjusting based on the FDR method (FDR < 0.05), 15 significant immune cell phenotypes were found. Serum positive RA has the most immune cell phenotypes, 5 protective phenotypes, and 9 pathogenic phenotypes. SSC-A on CD4 + T cell is a common protective immune cell phenotype among the three types of RA, while HLA DR on CD33- HLA DR + is a common pathogenic immune cell (Fig. 7). The results of MR Egger regression and weighted median method also demonstrate the robustness of the causal correlation obtained. In addition, HLA DR on Dendritic Cell and HLA DR on myeloid Dendritic Cell are common immune cell phenotypes in OA and RA, but they are protective in OA and pathogenic in RA. All immune cell phenotypes with statistical significance are listed in the Supplementary Tables 2–4.
Fig. 8
Using MR analysis to screen for immune cells that have a statistically causal relationship with RA. (A-C) Forest plot of the causal relationships between total RA, serum positive RA, serum negative RA and significant immune cells
留言 (0)