
記住我


CBCT scans of 105 subjects, between the ages of 20 and 40 years, were included in this study. These subjects were consecutively selected from a pool of patients who were sequentially admitted for orthodontic treatment from 2014 to 2020 at the Department of Orthodontics, Affiliated Stomatology Hospital of Guangzhou Medical University. The inclusion criteria were as follows: (1) normodivergent vertical facial type (27.3° ≤ S-N/Go-Gn ≤ 37.7°), (2) crowding of less than 4 mm in the mandibular arch, (3) healthy periodontal status without noticeable alveolar bone loss, (4) no prosthesis or missing teeth (except third-molars), (5) no obvious facial asymmetry and deformation, (6) no cleft lip and/or palate, (7) no diagnosed systemic disease and, (8) no history of orthodontic treatment. The study was approved by the Research and Ethics Committee of the Affiliated Stomatology Hospital of Guangzhou Medical University (No. KY2019023). The CBCT scans were obtained using Newtom (VG, Verona, Italy). The imaging parameters were as follows:110 kV, 3.07 mA, scan time of 18 s, with a voxel size of 0.15 mm, FOV of 15 × 15 cm and focal spot of 0.3 mm. Images were saved as digital imaging and communications in medicine (DICOM) format. The DICOM files were reconstructed into three-dimension images using QR-NNT software (Version 7.2, ImageWork, Elmsford, NY).
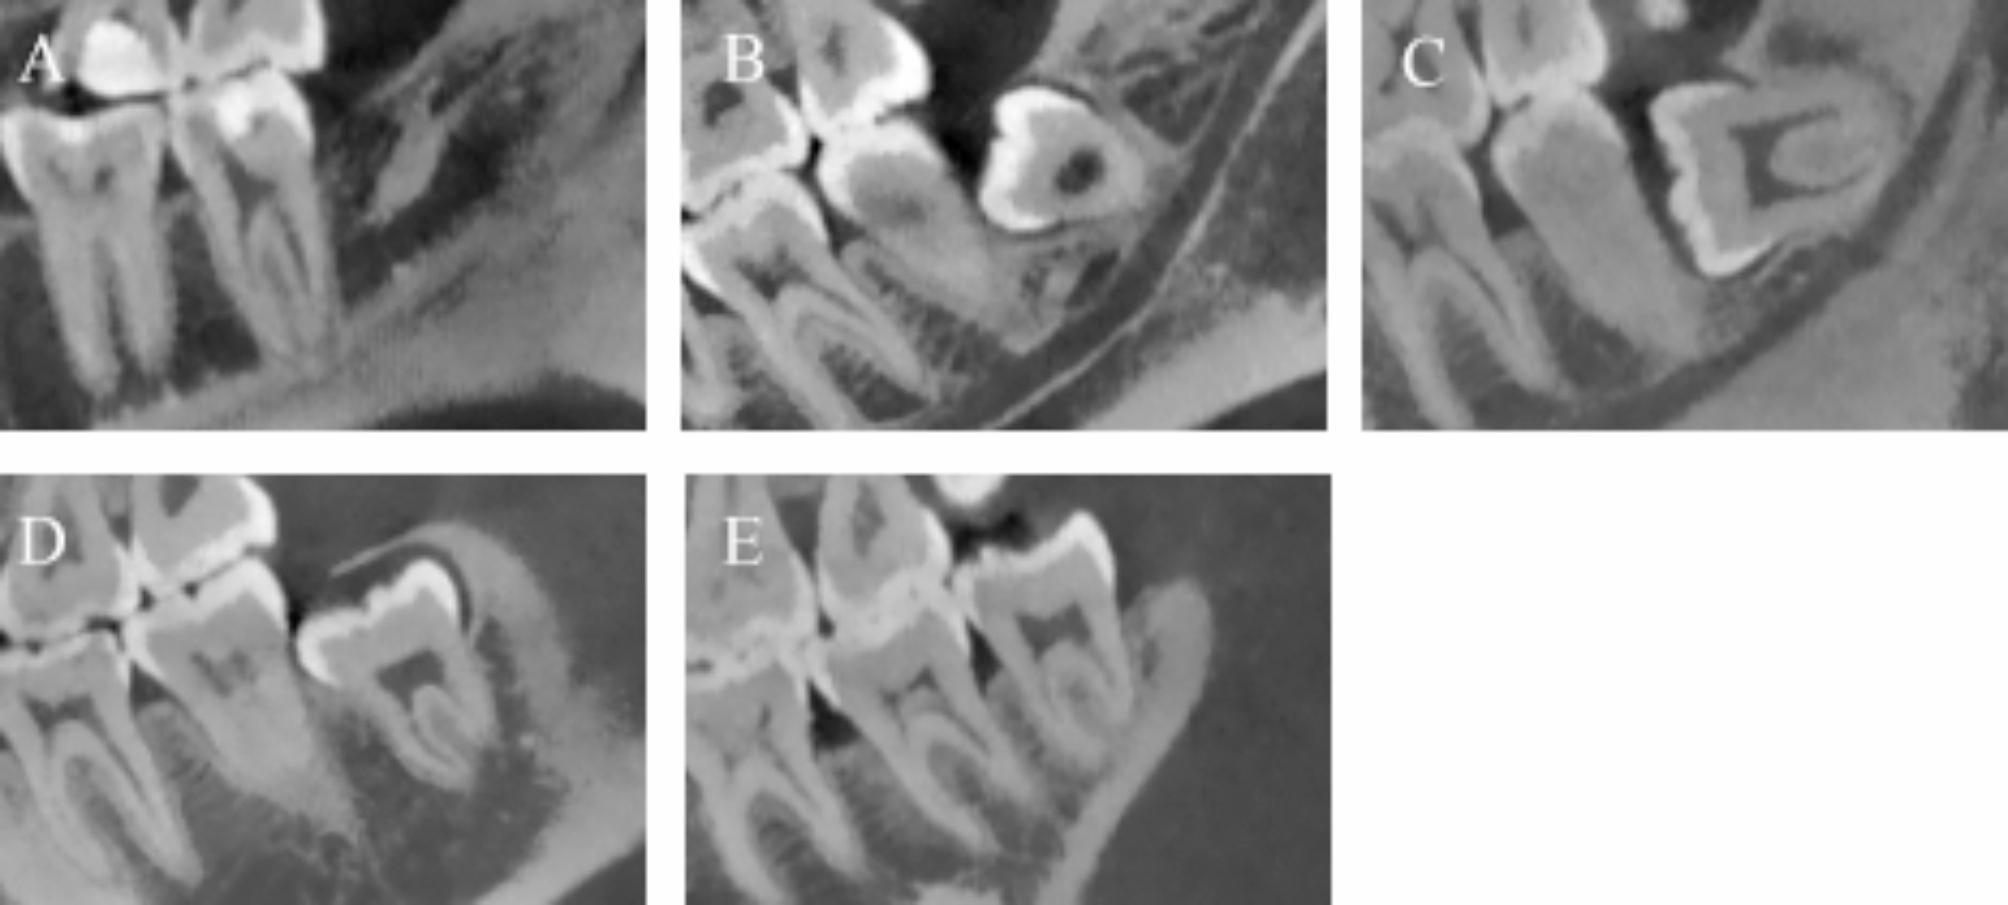
Cephalometric analysis was performed on CBCT-derived cephalograms obtained using Dolphin 9.0 Imaging software (Dolphin Imaging & Management Solutions, Chatsworth, Calif). According to ANB value, all subjects were classified into one of the three sagittal groups: Class I (0° ≤ ANB ≤ 4°), Class II (ANB > 4°) and Class III group (ANB < 0°). All of the sides were further divided into subgroups with or without the mandibular third-molar. For those with third molars, data were segmented into impacted and erupted groups, determined by the angle between the intersecting longitudinal axes of the mandibular second and third molars (Fig. 1). A third molar was considered erupted only if it had reached the occlusal plane and the intersection angle was between − 10° and 10° [13]. Mandibular length was measured as the distance between Gonion (Go) and Gnathion (Gn).
Fig. 1
(A) without third-molar group; (B, C,D) third-molar impacted group; (E) third-molar erupted group
The mandibular occlusal plane connecting the mesio-buccal cusp tips of the mandibular first molars and the right mandibular central incisor tip was used as the horizontal reference plane. The midsagittal plane was constructed using crista galli, ANS, and opisthion (Fig. 2A, green). The RMS of the mandible was measured on 4 different planes parallel to the mandibular occlusal plane. The plane passing through the furcation of the mandibular second molar root was named the Plane-0 whereas the other three planes, which were located 2, 4, and 6 mm apical to the Plane-0, were named the Plane-2, Plane-4, and Plane-6, respectively. (Fig. 2B) The cuspal line direction was parallel to the projection of the line connecting the mesial-buccal cusps of the mandibular molars on the occlusal plane. (Fig. 2C, Line a). The sagittal line direction was parallel to the midsagittal plane at the measurement level (Fig. 2C, Line b). These two reference lines were then projected on Plane-0, 2, 4, and 6 as the reference lines in each plane for linear measurements. The angle formed by these two reference lines was measured. (Fig. 2C, α) The number of roots that contacted the inner lingual cortex of the mandible were calculated at each measurement plane. The shortest distances between the most lingual point of the distal root of the mandibular second molar and inner (Fig. 2C, C-I) and outer lingual cortex (Fig. 2C, C-O) of the mandibular body were measured parallel to both the sagittal line and the cuspal line at “Plane-0,2,4,6”. All the measurements in this study were conducted by QR-NNT software. All the measurement was made by 2 senior master’s students in Orthodontics.
Fig. 2
(A) Reference planes. The mandibular occlusal plane: plane connecting the mesiobuccal cuspal tips of the mandibular first molars on both sides and central incisor tip. The midsagittal plane: plane formed by crista galli, ANS, and opisthion. (B) Measurement planes. The Plane-0: plane parallel to the mandibular occlusal plane and pass the furcation of the mandibular second-molar. Plane-2, Plane-4 and Plane-6 were parallel to the Plane-0 at 2, 4 and 6 mm below the Plane-0. (C) Measurement angle and distances. (α) Angle formed by the sagittal and cuspal lines. (C-I) The shortest liner distance measured between the most lingual point of the distal root of the mandibular second molar and the inner mandibular cortex (C-O) The shortest liner distance measured between the most lingual point of the distal root of the mandibular second molar and the outer mandibular
To assess the reliability of the measurements, 36 randomly selected 3-dimentional(3D) images were re-orientated and re-measured by another investigator (orthodontic resident) and the same investigator at least 2 weeks apart.
Statistical analysisThe minimum sample size was calculated at α = 0.05 and power of 90%, with PASS software (PASS 11. NCSS, LLC. Kaysville, Utah, USA). All statistical analysis were performed using SPSS software (version 24.0, IBM Corporation, NY) [11].
The differences among re-measurement by another investigator and the same investigator at least 2 weeks apart were assessed using an independent samples t-test and the methodological errors (MEs) were calculated using Dahlberg’s formula: \(ME = \sqrt /2n}\) where d represents the difference between two registrations, and n is the number of duplicate registrations. All data were checked for normal distribution by Shapiro-Wilk test and homogeneity of the variances.
Since the independent t-test showed no statistical difference between the right and left side measurements, the RMS measurements of the 2 sides were pooled in further subsequent analysis. The independent t-test was used to compare the RMS between groups with and without third molars, and groups with impacted and erupted ones. One-way analysis of variance (ANOVA) and Tukey post-hoc test was used to detect differences in baseline information and other variables relevant to the RMS among the 3 sagittal groups at 4 planes. Chi-square tests were applied to compare the number and rate of roots that contacted inner surface of lingual cortex on at least 1 plane. Gender distribution and third-molar impaction rate among three different groups were also tested.
留言 (0)