
記住我

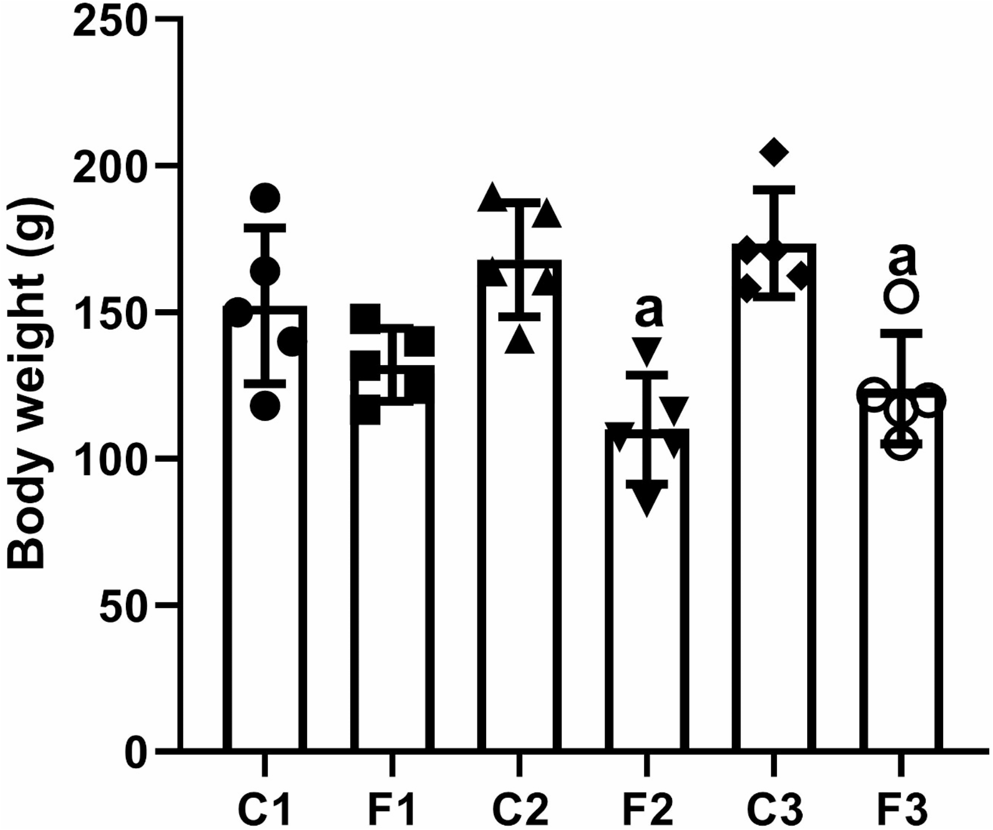


The results obtained revealed a significant decrease in mean body weight (F(5, 24) = 8.494, p < 0.001, W = 0.418, p = 0.831) after one week (F2) and two weeks (F3) of IF compared to the control rats. Interestingly, the mean body weight of rats in the F3 group increased as evidenced by a nonsignificant elevation compared to the F2 group (p = 0.862) (Fig. 1). Furthermore, a two-way ANOVA revealed a nonsignificant change between the duration of IF and the diet regimen intervention (F = 2.601, p = 0.095).
Fig. 1
The mean body weight of rats exposed to IF (24 h alternate-day fasting) for one, seven, and fifteen days. Values are provided as means ± SD (n = 5). a reflects significant differences (P < 0.05) compared to control
Monoamines alterations in different areas of the brain after intermittent fastingTo elucidate the effect of IF on neurotransmitters, we determined the levels of DA, NE and 5-HT in different areas of the brain, namely, the midbrain, thalamus and hypothalamus, and hippocampus. The observed data showed a significant decrease in DA levels in the middle brain (F(5, 24) = 15.873, p < 0.001, W = 0.700, p = 0.629) and the hippocampus (F(5, 24) = 21.069, p < 0.001, W = 3.421, p = 0.018) at all time intervals except in the hippocampus of the F3 group. However, DA levels showed a nonsignificant change in the thalamus and hypothalamus (F(5, 24) = 5.821, p = 0.001, W = 0.146, p = 0.979) after 15 days of fasting intermittent (group F3) compared to control rats. Furthermore, the findings of the present study revealed a significant increase in DA levels in the F2 (p = 0.012) and F3 (p = 0.001) groups compared to the F1 group (one day of IF) in the thalamus and hypothalamus, and a significant increase in DA levels in the F3 group compared to the F1 (p < 0.001) and F2 (p < 0.001) groups in the hippocampus (Fig. 2). Furthermore, a two-way ANOVA analysis revealed a nonsignificant change in DA levels in the midbrain when comparing the duration of IF and the diet regimen intervention (F = 0.948, p = 0.402). On the other hand, a two-way ANOVA revealed a significant change in DA levels in the thalamus and hypothalamus, and hippocampus between the duration of IF and the diet regimen intervention (F = 5.428, p = 0.011) and (F = 16.282, p < 0.001), respectively.
Fig. 2
Dopamine, norepinephrine, and serotonin levels in different brain areas (midbrain, thalamus and hypothalamus, and hippocampus) in rats exposed to IF (24 h alternate-day fasting) for one, seven, and fifteen days. Values are provided as means ± SD (n = 5). a, b, and c reflect significant differences (P < 0.05) compared to the control, F1, and F2 groups, respectively
Compared to the control group, NE levels showed a nonsignificant change in the midbrain (F(5, 24) = 0.564, p = 0.726, W = 1.135, p = 0.369) in all experimental groups. However, the data obtained showed a significant increase in NE levels in the thalamus and hypothalamus (F(5, 24) = 7.516, p < 0.001, W = 0.171, p = 0.971) after one day of IF (group F1), while there was a significant decrease in NE levels in the F3 (p = 0.023) group compared to the F1 group. Furthermore, there was a significant increase in NE levels in the F2 group in the hippocampus (F(5, 24) = 4.085, p = 0.008, W = 1.291, p = 0.301) compared to the control group, while NE levels decreased significantly in the F3 group compared to the F2 (p = 0.017) group (Fig. 2). Furthermore, the two-way ANOVA analysis revealed a nonsignificant change in NE levels in the midbrain, thalamus and hypothalamus, and hippocampus between the duration of IF and the diet regimen intervention (F = 0.306, p = 0.740), (F = 2.622, p = 0.093), and (F = 2.843, p = 0.078), respectively.
Figure 2 also shows a nonsignificant change in 5-HT level (F(5, 24) = 1.348, p = 0.279, W = 0.389, p = 0.852) in all time intervals compared to the control group in the midbrain. In the area of the thalamus and hypothalamus, the 5-HT level showed a significant increase (F(5, 24) = 4.961, p = 0.003, W = 0.914, p = 0.488) in the F1 group compared with the control group. Furthermore, the 5-HT level in the hippocampus increased significantly (F(5, 24) = 3.707, p = 0.013, W = 0.577, p = 0.717) in the F2 group compared to the control group. Furthermore, a two-way ANOVA analysis revealed a nonsignificant change in 5-HT levels in the midbrain between the duration of IF and the diet regimen intervention (F = 1.079, p = 0.356). On the other hand, a two-way ANOVA findings revealed a significant change in 5-HT levels in the thalamus and hypothalamus, and hippocampus between the duration of IF and the diet regimen intervention (F = 5.921, p = 0.008) and (F = 4.038, p = 0.03), respectively.
Amino acids changes in different areas of the brain after intermittent fastingTo elucidate the effect of IF on neurotransmitters, we determined the levels of GABA, GLU, ASP, and GLY in different areas of the brain, namely, the midbrain, thalamus and hypothalamus, and hippocampus. Compared to the control group, the present data showed a nonsignificant change in GABA levels in the midbrain (F(5, 24) = 2.793, p = 0.040, W = 1.252, p = 0.316) in all experimental groups. Furthermore, a nonsignificant change in GABA levels was detected (F(5, 24) = 3.545, p = 0.015, W = 1.577, p = 0.204) in all experimental groups in the thalamus and hypothalamus compared to the control group, however a significant increase in GABA levels in the F3 group compared to the F2 group (p = 0.039) group was detected. Furthermore, the findings of the present study revealed a nonsignificant change in GABA levels (F(5, 24) = 4.935, p = 0.003, W = 1.199, p = 0.339) in the F1, F2 and F3 groups compared to the control group in the hippocampus (Fig. 3). Furthermore, a two-way ANOVA results revealed a nonsignificant change in GABA levels in the midbrain, thalamus and hypothalamus, and hippocampus between the duration of IF and the diet regimen intervention (F = 2.873, p = 0.076), (F = 2.216, p = 0.131), and (F = 0.848, p = 0.441), respectively.
Fig. 3
GABA, glutamate, aspartate, and glycine levels in different brain areas (midbrain, thalamus and hypothalamus, and hippocampus) in rats exposed to IF (24 h alternate-day fasting) for one, seven, and fifteen days. Values are provided as means ± SD (n = 5). a, b, and c reflect significant differences (P < 0.05) compared to the control, F1, and F2 groups, respectively
Figure 3 showed a significant decrease in the GLU level (F(5, 24) = 6.482, p = 0.001, W = 3.140, p = 0.025) in all experimental groups compared to the control group in the midbrain. In the thalamus and hypothalamus, the GLU level showed a nonsignificant change (F(5, 24) = 3.153, p = 0.025, W = 1.843, p = 0.142) at all time intervals compared to the control group.
Furthermore, the level of GLU in the hippocampus was significantly decreased (F(5, 24) = 6.056, p = 0.001, W = 2.129, p = 0.097) in the F2 group compared to the control group. Additionally, a two-way ANOVA findings revealed a nonsignificant change in GLU levels in the midbrain and, thalamus and hypothalamus between the duration of IF and the diet regimen intervention (F = 0.948, p = 0.401) and (F = 2.288, p = 0.123), respectively. However, a two-way ANOVA results revealed a significant change in GLU levels in the hippocampus between the duration of IF and the diet regimen intervention (F = 6.925, p = 0.004).
The results obtained (Fig. 3) revealed a significant decrease in ASP levels (F(5, 24) = 8.995, p < 0.001, W = 1.653, p = 0.184) in the F2 and F3 groups compared to the control group in the midbrain. However, ASP levels showed a nonsignificant change in the thalamus and hypothalamus (F(5, 24) = 2.217, p = 0.086, W = 0.736, p = 0.604) in all experimental groups, while there was a significant increase after 15 days of intermittent fasting (group F3) compared to group F2 (p = 0.05). Furthermore, the findings of the present study revealed a significant decrease in ASP levels (F 5, 24) = 7.241, p < 0.001, W = 1.282, p = 0.304) in the F1 and F2 groups compared to the control group in the hippocampus, but a significant increase in F3 compared to the F2 (p = 0.024) group. Furthermore, a two-way ANOVA analysis revealed a nonsignificant change in ASP levels in the midbrain and, thalamus and hypothalamus between the duration of IF and the diet regimen intervention (F = 3.258, p = 0.056) and (F = 3.376, p = 0.051), respectively. However, a two-way ANOVA results revealed a significant change in ASP levels in the hippocampus between the duration of IF and the diet regimen intervention (F = 10.074, p < 0.001).
Compared to the control group, the data obtained showed a nonsignificant change in the GLY level (F(5, 24) = 2.655, p = 0.048, W = 0.592, p = 0.706) in the midbrain after one, seven, and fifteen days of IF (F1,F2 and F3 groups). In the thalamus and hypothalamus, there was a nonsignificant change in the GLY level (F(5, 24) = 1.656, p = 0.184, W = 2.949, p = 0.033) in all groups compared to the control group. Furthermore, a significant increase in GLY levels was detected in the hippocampus (F(5, 24) = 6.525, p < 0.001, W = 2.548, p = 0.055) in the F1 group compared to the control group and a significant decrease in F3 compared to the F1 (p = 0.001) and F2 (p = 0.038) groups (Fig. 3). Furthermore, two-way ANOVA findings revealed a nonsignificant change in GLY levels in the midbrain and, thalamus and hypothalamus between the duration of IF and the diet regimen intervention (F = 1.137, p = 0.338) and (F = 3.046, p = 0.066), respectively. However, a two-way ANOVA revealed a significant change in GLY levels in the hippocampus between the duration of IF and the diet regimen intervention (F = 4.965, p = 0.016).
Oxidative stress status in different areas of the brain after intermittent fastingTo elucidate the effect of IF on biomarkers of oxidative stress, MDA, NO, and GSH levels were determined in different areas of the brain (Fig. 4). The results obtained revealed a significant decrease in MDA levels after one and seven days of IF and in NO levels after one and fifteen days in the midbrain (MDA: F(5, 24) = 10.644, p = 0.001, W = 3.186, p = 0.025; NO: (F(5, 24) = 10.986, p = 0.001, W = 0.702, p = 0.627) and a significant decrease in MDA levels after one and seven days of IF and a significant decrease in NO levels after 7 days of IF in hippocampus (MDA: F(5, 24) = 14.742, p < 0.001, W = 1.335, p = 0.283; NO: (F(5, 24) = 14.405, p < 0.001, W = 0.560, p = 0.730), while a significant increase was recorded in the F3 compared to the F1 groups (MDA: p = 0.018; NO: p = 0.001) and F2 (MDA: p = 0.005; NO: p = 0.001). In the thalamus and hypothalamus, MDA and NO levels showed a nonsignificant change (F(5, 24) = 3.233, p = 0.023, W = 0.342, p = 0.833; NO: (F(5, 24) = 5.766, p = 0.001, W = 0.496, p = 0.776) at all time intervals compared to the control group,. Furthermore, the F2 (MDA: p = 0.05; NO: p = 0.05) and F3 (MDA: p = 0.05; NO: p = 0.05) groups showed a significant increase in MDA and NO levels compared to the F1 group.
Fig. 4
Oxidative stress biomarkers (MDA, NO, and GSH) levels in different brain areas (midbrain, thalamus and hypothalamus, and hippocampus) in rats exposed to IF (24 h alternate-day fasting) for one, seven, and fifteen days. Values are provided as means ± SD (n = 5). a, b, and c reflect significant differences (P < 0.05) compared to the control, F1, and F2 groups, respectively
Furthermore, a two-way ANOVA analysis revealed a nonsignificant change in MDA levels in the midbrain between the duration of IF and the diet regimen intervention (F = 2.406, p = 0.112). On the other hand, a two-way ANOVA revealed a significant change in MDA levels in the thalamus and hypothalamus, and hippocampus between the duration of IF and the diet regimen intervention (F = 5.782, p = 0.009) and (F = 6.869, p = 0.004), respectively. Moreover, two-way ANOVA results revealed a nonsignificant change in NO levels in the midbrain between the duration of IF and the diet regimen intervention (F = 1.695, p = 0.205). On the other hand, a two-way ANOVA analysis revealed a significant change in NO levels in the thalamus and hypothalamus, and hippocampus between the duration of IF and the diet regimen intervention (F = 8.079, p = 0.002) and (F = 13.018, p < 0.001), respectively.
In comparison with the control group, the data obtained in Fig. 4 showed a nonsignificant change in GSH levels (F(5, 24) = 1.655, p = 0.184, W = 0.5000, p = 0.773) in the middlebrain and (F(5, 24) = 2.451, p = 0.063, W = 0.975, p = 0.453) in the thalamus and hypothalamus, and (F(5, 24) = 1.774, p = 0.156, W = 0.560, p = 0.730) in the hippocampus at all time intervals. Furthermore, a two-way ANOVA analysis revealed a nonsignificant change in GSH levels in the midbrain, thalamus and hypothalamus, and hippocampus between the duration of IF and the diet regimen intervention (F = 1.482, p = 0.247), (F = 0.691, p = 0.511), and (F = 0.807, p = 0.458), respectively.
Modifications of the BDNF protein levels in different areas of the brain after intermittent fastingTo elucidate the effect of IF on the BDNF protein, we determined the level of BDNF protein in different areas of the brain of albino rats. Compared to the control group, there was a significant decline in BDNF levels in the F3 group in all brain areas tested except the hippocampus (middle brain: F(5, 24) = 7.618, p < 0.001, W = 0.319, p = 0.897; thalamus and hypothalamus: F(5, 24) = 7.625, p < 0.001, W = 1.235, p = 0.316; hippocampus: F(5, 24) = 6.318, p < 0.001, W = 0.485, p = 0.784). Furthermore, compared to the F1 group, there was a significant decrease in BDNF levels in the F2 group in all brain areas tested except thalamus and hypothalamus (midbrain: (p = 0.02); thalamus and hypothalamus: (p = 0.05); hippocampus: (p = 0.025) (Fig. 5). Furthermore, a two-way ANOVA analysis revealed a significant change in BDNF levels in the midbrain, thalamus and hypothalamus, and hippocampus between the duration of IF and the diet regimen intervention (F = 6.923, p = 0.004), (F = 11.370, p < 0.001), and (F = 6.433, p = 0.006), respectively.
Fig. 5
BDNF levels in different brain areas (midbrain, thalamus and hypothalamus, and hippocampus) in rats exposed to IF (24 h alternate-day fasting) for one, seven, and fifteen days. Values are provided as means ± SD (n = 5). a, b, and c reflect significant differences (P < 0.05) compared to the control, F1, and F2 groups, respectively
留言 (0)