
記住我

This single-center, retrospective study enrolled consecutive patients with SSc without SSc-ILD with FVC > 80% and DLCO > 60%.
Patients were selected based on the fulfilment of the 2013 ACR/EULAR classification criteria for SSc [10] who had followed up with cardiopulmonary function with PFTs, CPET, HRCT and Doppler echocardiogram. Patients with heart failure with both reduced and preserved ejection fraction, primary and secondary ILD, pulmonary hypertension, valvular heart diseases, arrhythmias and conduction disorders, neuromuscular diseases, cancer, eating disorders, myositis, end stage kidney disease, smokers were excluded.
At the time of enrolment, all SSc patients were undergoing treatment with calcium channel blockers (nifedipine 30 mg/day). None of the patients was treated in the last 6 months before the enrolment with immunosuppressive agents (e.g. rituximab, mycophenolate mofetil or prednisone dose > 10 mg/day).
All patients who met inclusion and exclusion criteria were consecutively enrolled. lcSSc and dcSSc patients were enrolled regardless of disease duration. There is no selection bias because the two groups are numerically equivalent (22 lcSSc and 22 dcSSc).
This study was approved by the Ethics Committee of Sapienza University (IRB 0304) and written informed consent was obtained from all patients.
Clinical assessment of SScAccording to classification, SSc patients were classified based on the degree of skin involvement in diffuse cutaneous (dc) or limited cutaneous (lc) SSc [11]. The modified Rodnan skin score was used for skin thickening [12], disease activity index (DAI) [13] and disease severity scale (DSS) [14] were recorded.
Nailfold videocapillaroscopy was performed with videocapillaroscope (software Pinnacle Studio Version 8) equipped with a 500 × optical probe. The patterns identified within the “SSc pattern” include early, active, and late [15].
Study proceduresPulmonary function testsBody plethysmography parameters of flows and volumes [(FEV1, forced expiratory volume in the 1st second), FVC (Forced vital capacity), FEV1/FVC)] and single breath carbon monoxide (CO) diffusing capacity (DLCO), corrected for hemoglobin concentration, total lung capacity (TLC) were recorded with a Quark PFT 2 spirometer (Cosmed) and expressed according to the standards recommended by the American/European Respiratory Society [16, 17]. All spirometric parameters are expressed as percentage of predicted.
Cardiopulmonary exercise testA maximal symptom-limited CPET was performed on an electronically braked cycloergometer (Ergoline-800, Mortara, Bologna, Italy), the subject wearing a nose clip and breathing through a mass flow sensor (Quark PFT, Cosmed, Rome, Italy) connected to a saliva trap. A personalized ramp exercise protocol was performed, aiming at a test duration of 10 ± 2 min [18]. The exercise was preceded by few minutes of resting breath-by-breath gas exchange monitoring and by a 3 min unloaded warm-up. The maximum (max) rate (V) of oxygen (O₂) consumption in one minute per kilogram of body weight (ml/kg/min) (VO2 max) was calculated according to the standard formula. The lactate threshold (LT) was identified through a V-slope analysis of VO2 and carbon dioxide production (VCO2), as well as of minute ventilation (VE), and it was confirmed through specific behaviour of O2 (VE/VO2) and CO2 (VE/VCO2) ventilatory equivalents and pressure end-tidal of O2 (PetO2) and CO2 (PetCO2). The end of the isocapnic buffering period was identified when VE/VCO2 increased, and end-tidal pressure of CO2 decreased. The relation between VO2 and workload (VO2/WR) was calculated as the slope of the linear relationship between VO2 and WR from the beginning of loaded exercise to the end of the exercise test. The relation between VE and VCO2 (VE/VCO2 slope) was calculated as the slope of the linear relationship between VE and VCO2 from one minute after the beginning of loaded exercise to the end of the isocapnic buffering period. CPET was self-terminated by the subjects when they claimed that they had achieved maximal effort. However, we considered maximal effort as achieved if the respiratory exchange ratio (RER), calculated as the ratio between VCO2 and VO2, was above 1.05. A 12-lead ECG, arterial systemic blood pressure and arterial O2 saturation (integrated pulse-oxymeter) were also recorded at baseline and during effort [19]. All CPET were executed and analyzed by two physicians blinded to patients’ clinical features.
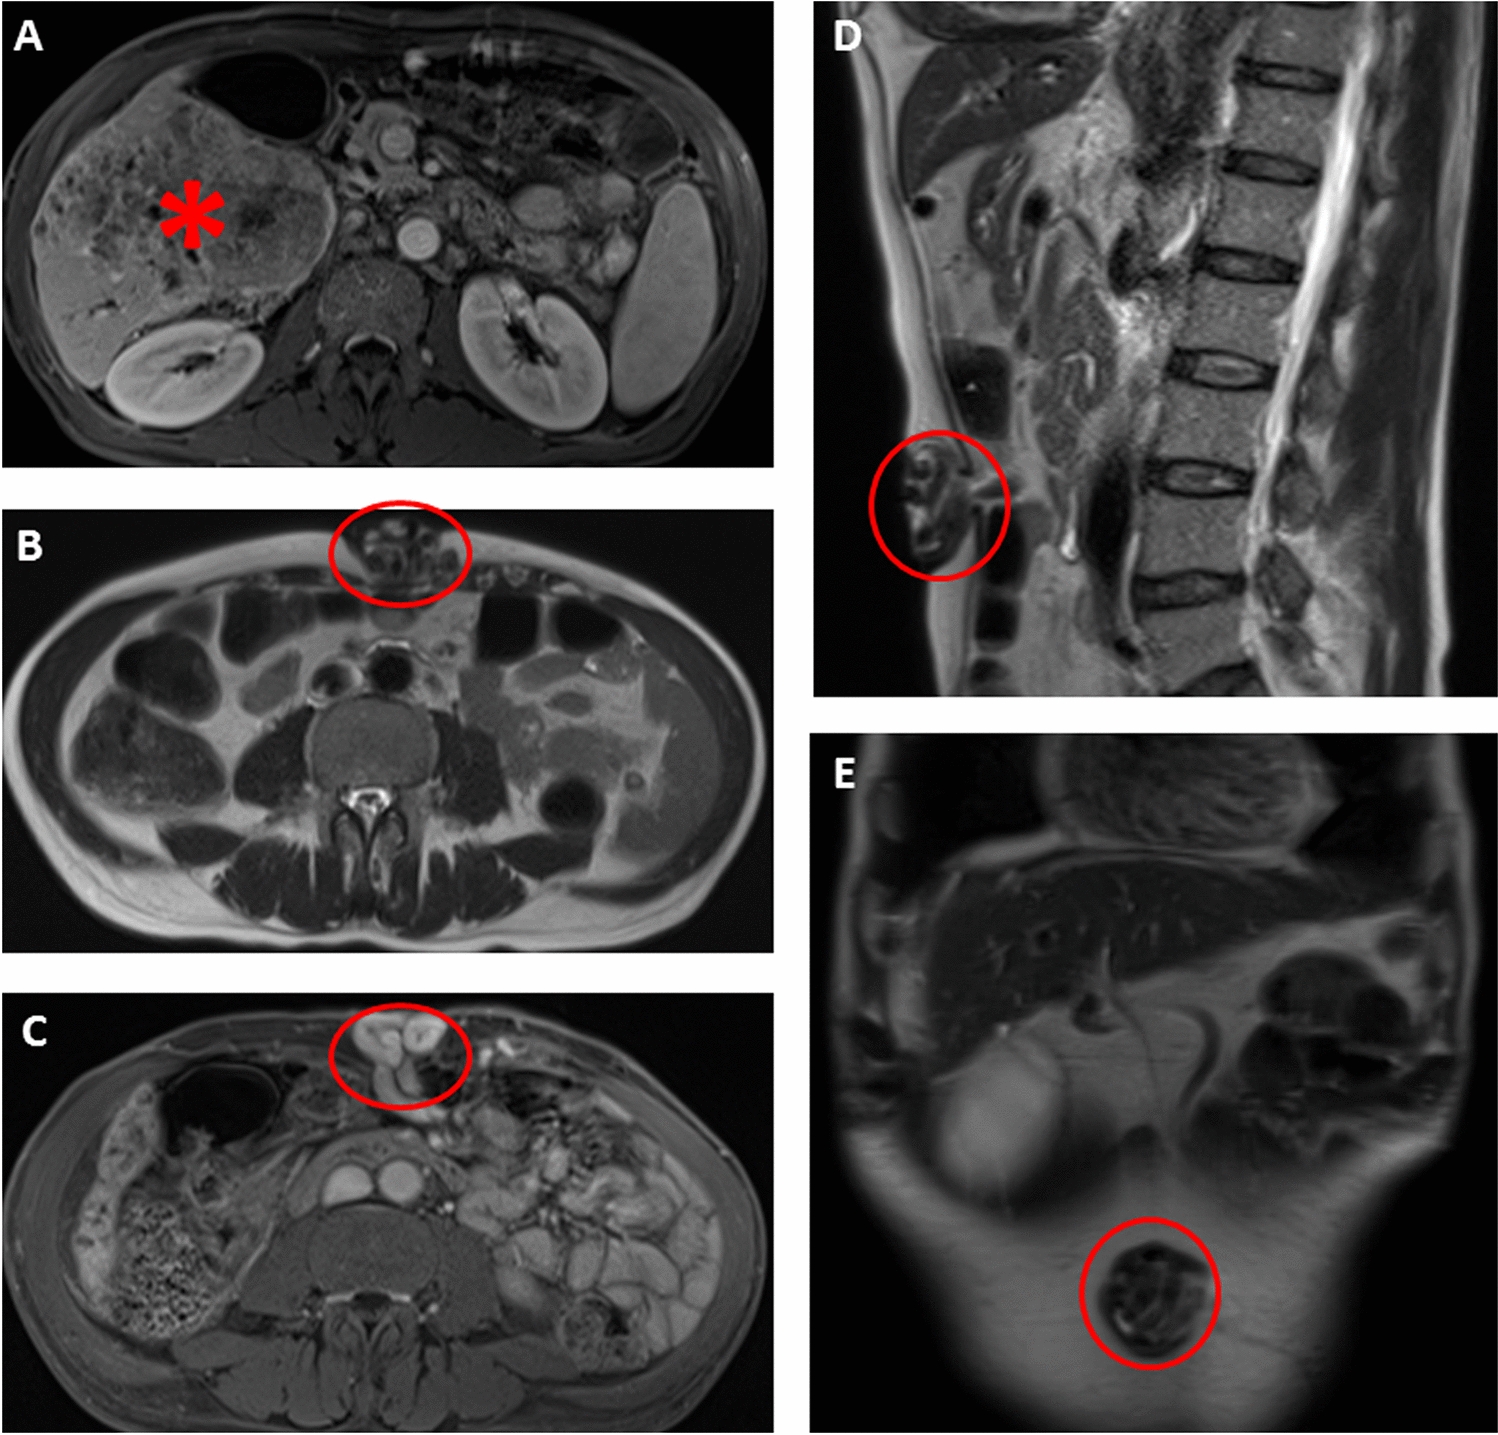
High-resolution computed tomographyHRCT of the chest was performed at baseline using a 128 slice CT scanner (Ingenuity Core, Philips, Amsterdam, Netherlands) and classified according to score of ground-glass opacities, fibrosis and to exclude ILD [20]. The CWMA was evaluated at the level of the ninth thoracic vertebra on the mediastinal window of CT, because the image at this level includes accessory respiratory muscles, such as the latissimus dorsi muscle, erector spinae muscle, serratus anterior muscle, inferior trapezius muscle and inferior pectoralis major muscle, with minimal inclusion of breast tissue and rectus abdominis muscle tissue [4]. The accessory respiratory muscles play a major role in forced expiration and thus are a major contributor to FVC measurement, whereas inspiratory muscles, such as the diaphragm and intercostal muscles activate during tidal breathing [21]. The accessory respiratory muscles were semi-automatically traced (Fig. 1), using a threshold-based approach (including all tissue with density comprised between 0 and 100 Hounsfield units, outside from rib cage) and total area was quantified using Vitrea Advanced Visualization software (Canon Group, Minnetonka, MN). Breast parenchyma and costal cartilages were manually excluded. The mean of two measurements was used for analysis.
Fig. 1
The chest wall muscle area was semi-automatically segmented on axial CT images at the level of the ninth thoracic vertebra, using the mediastinal viewing window. All soft tissues with Hounsfield values comprised between 0 and 100, located outside the rib cage (excluding ribs, vertebrae and lung parenchyma), were segmented (green color) and considered as accessory respiratory muscles (color figure online)
Doppler echocardiographyDoppler echocardiography was performed by a senior cardiologist with the General Electric Vivid S5 apparatus (GE Medical Systems, Israel Ltd.). Left ventricular ejection fraction and systolic pulmonary arterial pressure (sPAP) was determined from peak tricuspidal jet velocity using the simplified Bernoulli equation and combining this value with an estimate of the right atrium pressure:
sPAP = 4(V)2 + RA pressure, where V is the peak velocity (in meters per second) of the tricuspid valve regurgitant jet, and RA pressure is estimated from inferior vena cava diameter and respiratory changes [22, 23].
Statistical analysisSPSS version 26.0 software was used for statistical analysis. After evaluation of normality by Shapiro–Wilk test, continuous variables were expressed as median and IQR and categorical variables were expressed as absolute frequency and percentage. Differences between groups were evaluated by Student’s or Mann–Whitney’s U test. Differences between categorical variables were evaluated by the chi-square or Fisher exact test. The Pearson or Spearman correlation test was used for bivariate correlations. Multiple regression analysis was performed to evaluate relationship between dependent variables (VO2 max or maximum workload) and independent variables [age, body mass index (BMI), DLco, sPAP and chest wall muscle area]. p-values < 0.05 were considered significant.
留言 (0)