
記住我

This was a retrospective observational cohort study using de-identified EHR data.
Data sourceThis study used de-identified EHRs from the NeuroBlu Database (Holmusk Technologies Inc., New York, NY, USA) Version 21R2. NeuroBlu is a longitudinal behavioral health real-world database comprising both structured and semi-structured patient-level clinical data aggregated from the MindLinc EHR [28]. At the time of the analysis, the database comprised over 560,000 patients and more than 14 million clinical visits at 25 hospitals/care systems in the US. The clinical sites included in this study were psychiatric specialty clinics. Thus, a combination of psychiatrists, nurses, or other mental health care specialists may have prescribed ADHD medications and conducted clinical assessments (e.g., Clinical Global Impression – Severity [CGI-S]) that were analysed in this study. The NeuroBlu Database has been standardized into a common data model (CDM) that conforms with the Observational Health Data Sciences and Informatics (OHDSI) data standards. For the MindLinc EHR, institutional review board approval for this study was not required because MindLinc data are de-identified and thus exempt from Health Insurance Portability and Accountability Act (HIPAA) requirements. The NeuroBlu Database platform received a waiver of authorization for analysis of de-identified healthcare data from the WCG Institutional Review Board (Ref: WCG-IRB 1-1470336-1).
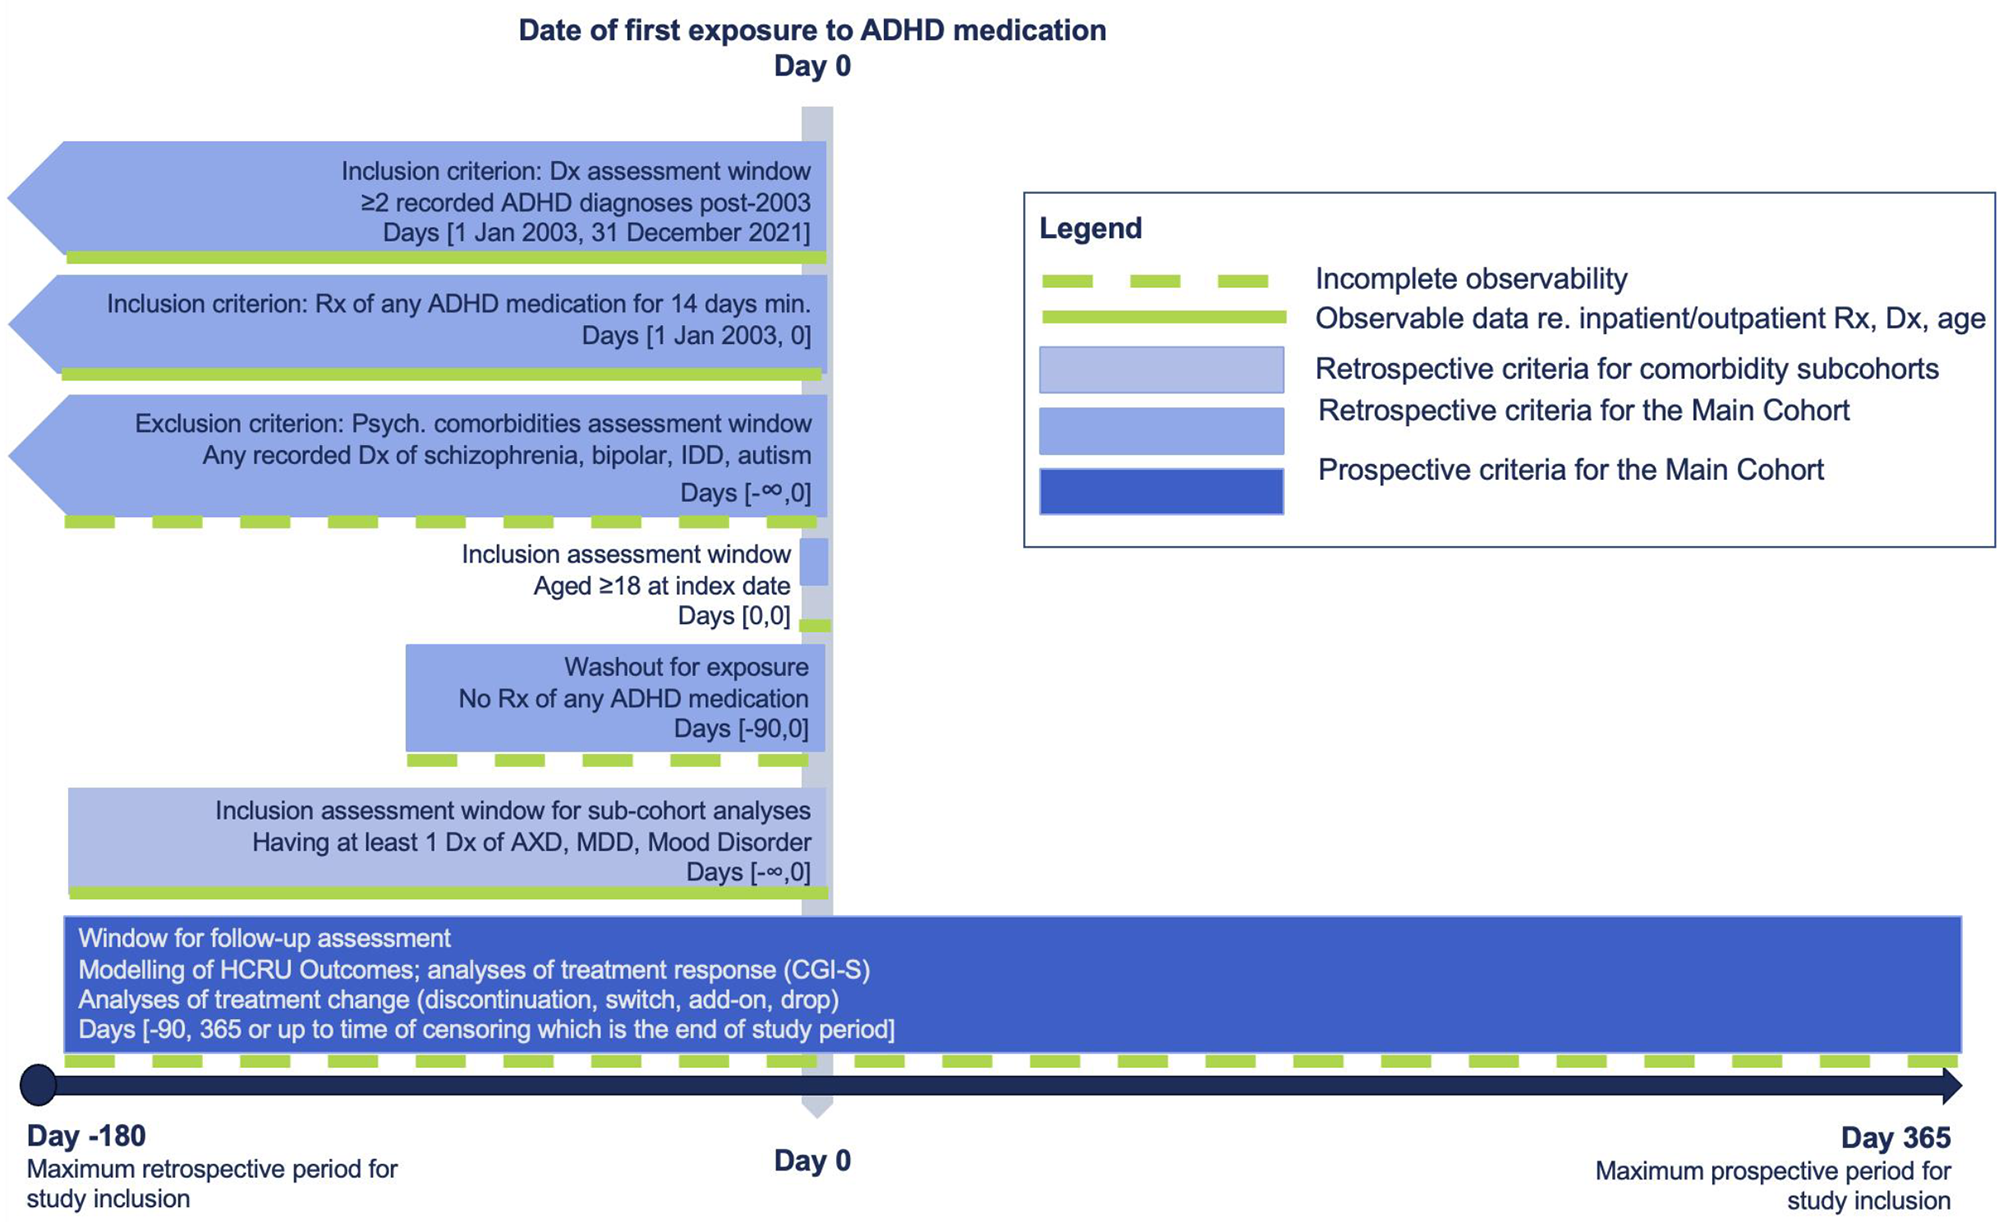
Study populationPatients were included if they: 1) had ≥ 2 clinical encounters with a documented diagnosis of ADHD based on International Classification of Diseases, Ninth Revision, Clinical Modification (ICD-9-CM) of 314.00 or 314.01, or International Classification of Diseases, Tenth Revision, Clinical Modification (ICD-10-CM) of F90.0, F90.1, F90.2, F90.8, or F90.9; 2) were aged ≥ 18 years at first prescription of ADHD-related medication (index date; see Fig. 1); 3) were prescribed a pharmacologic medication for ADHD for ≥ 14 days (index event); 4) had a 90 day no ADHD-related treatment washout period (see Fig. 1) before their index prescription of ADHD-related medication; and 5) had ≥ 3 months of pre-index clinical activity, defined as a record of any type of visit. Patients were excluded if they had any lifetime diagnosis of schizophrenia, bipolar disorder, intellectual disabilities, or autism. Two subsets were derived from the study population (hereafter referred to as the Main Cohort) for specific analyses: (1) Subset A, which requires patients to have at least 12 months of post-index visit data, and (2) Subset B, which requires patients to have at least 6 months of post-index visit data.
Fig. 1
Study design
Abbreviations: ADHD, attention-deficit/hyperactivity disorder; AXD, anxiety disorder; Dx, diagnosis; IDD, intellectual disabilities; MDD, major depressive disorder; Rx, prescription
Study period and index dateThis study period was set between July 1, 2002 to December 31, 2021. To allow variable assessment pre-index, index events were only allowed to occur between January 1, 2003 and December 31, 2021 (Fig. 1). The index date was defined as the date of first prescription of ADHD medication that satisfied the study eligibility criteria. The pre-index period was defined as 6 months (180 days) before the index date, while the follow-up period was defined as 12 months (365 days) after the index date.
Variables and outcomesBaseline variables included demographic (sex, age, race) and clinical characteristics (concomitant medications, ADHD symptoms, disease severity measurements [CGI-S], HCRU, and psychiatric comorbidities). CGI-S scores that were present ± 14 days from the index date were treated as baseline CGI-S scores. Baseline CGI-S scores were only reported on patients with CGI-S records within the aforementioned time window. For patients with multiple measurements, the median of all measurements at the measurement date closest to the time point of interest was used. ADHD symptoms that were present within ± 30 days from the index date were derived from MSE notes using previously published natural language processing (NLP) methods [29]. ADHD symptoms were only reported for patients with MSE records within the aforementioned time window. Index treatment characteristics were reported for the Main Cohort, including type of ADHD-related agent prescribed, treatment duration, and type of formulation. Pharmacological treatments for ADHD include short- and long-acting stimulants (amphetamine, dexmethylphenidate, dextroamphetamine, lisdexamfetamine, methamphetamine, methylphenidate, modafinil, and pemoline) and non-stimulants (clonidine, viloxazine, atomoxetine, and guanfacine).
Variables for outcome assessment included variables related to treatment changes from index ADHD medication (presence of any treatment changes, number of treatment changes, time to first treatment change, type of first treatment change), HCRU (time to first psychiatric hospitalization, inpatient psychiatric hospitalization frequency, emergency department [ED] visit frequency, outpatient visit frequency), and change in CGI-S. Treatment change was defined at the therapeutic agent level and includes the following four types (Supplemental Figs. 1–4): (1) Treatment discontinuation: defined as no ADHD-related agent for 120 consecutive days after last day of prescription of the index treatment regimen. Treatment discontinuation rate was determined by the percentage of patients who discontinued their index treatment regimen within the 12 months post-index follow-up period; (2) Treatment switch was defined as initiation of a new ADHD-related agent with no prescription refills from the index treatment regimen ± 60 days from the index treatment regimen end date. Treatment switch rate was determined by the percentage of patients who switched from their index treatment to a different therapeutic agent within the 12 months post-index period; (3) Treatment add-on was defined as initiation of a non-index ADHD-related agent that served as an adjunctive treatment with index treatment regimen; and (4) Treatment drop was defined as discontinuation of an ADHD-related agent for patients who had started with two or more ADHD medications at the index date (other medications prescribed from index, including another ADHD medication or non-ADHD medication, may have been continued). Frequency of visits were assessed by visit type (inpatient, outpatient, or ED) and estimated from the number of visits normalized by the length of the observation period (in months). In addition, a composite utilization rate, estimated using all inpatient and outpatient visits normalized by the length of observation period, was also reported to provide a comprehensive measure of overall HCRU. All utilization rates were calculated on a per-patient basis.
Statistical analysisDescriptive analysis of baseline characteristicsContinuous variables were summarized using means with standard deviations (SDs) for normally distributed data and medians with interquartile ranges (IQRs) for skewed data. Categorical variables were summarized using frequencies and percentages. Baseline comparisons between sub-cohorts for continuous data were made using Kruskal-Wallis H test, while comparisons for categorical data were made using Chi-squared test, or Fisher’s exact test if the counts in any of the sub-cohorts were deemed to be relatively small, i.e., counts of 10 or less in each cell. A statistically significant p-value, defined as p-value less than 0.05, generated by any of these tests would indicate a potentially substantial difference in the data distribution between any of the sub-cohorts. In addition, standardized mean differences (SMDs) were also calculated to assess the magnitude of differences between the sub-cohorts, where SMDs equal to 0.2, 0.5, and 0.8 represent small, medium, and large differences between cohorts, respectively [30].
Analysis of treatment changeNumber of treatment changes and type of first treatment change within the follow-up period were reported (from Subset A), which were further stratified by comorbidities in a post-hoc analysis. Kaplan-Meier survival analysis (from the Main Cohort) was used to obtain a more robust and generalizable estimate of treatment duration in the real-world. Patients were followed up to the point of first treatment change (treatment discontinuation, treatment switch, treatment add-on, or treatment drop) or censoring (for patients who did not experience the event by end of the study follow-up period or who were lost to follow-up), whichever was earlier. Censoring-adjusted incidence rate of treatment change over the follow-up period was subsequently estimated.
Cox proportional-hazard models were developed on the Main Cohort to determine if any demographic and clinical characteristics were predictive of time to change in ADHD treatment. Relevant predictors were selected by first conducting a univariate analysis where individual characteristics were independently assessed for their statistical significance against the time to ADHD treatment change. Stepwise regression was then conducted where predictors were sequentially added into the model based on their statistical significance, measured using Wald’s test at a significance level of 0.05. To prevent predictors with strong multicollinearity against each other from being included in the model, the variance inflation factor (VIF) method was used after each step of the stepwise regression algorithm, where predictors with VIF exceeding 5 were excluded. Proportional hazard assumptions were examined, and interaction terms were explored. Unadjusted and adjusted hazard ratios, 95% confidence intervals (CI), and p-value (calculated using Wald’s test) of all predictors are reported to assess for the significance, relationship, and extent of contribution of each of the predictors to the change in treatment pattern. A variable with a hazard ratio (HR) of more than 1 and a p-value of < 0.05 represents that there is a higher risk of the experiencing treatment change related to the variable. Interactions between index ADHD medication against demographic variables and comorbidities were explored, and any interactions found to be statistically significant based on Wald’s test, i.e., p-value below 0.05, were included in the final regression model.
In addition, segmentation of the Main Cohort was done using classification tree analysis, which allowed us to understand not just the individual characteristics but also combination of characteristics that contribute to treatment change. The dependent variable was a binary outcome of whether treatment change was observed within 12 months from the index date.
Analysis of treatment response outcomeAssessment of HCRU ratesAll analyses involving HCRU are conducted from Subset B. Frequency of inpatient hospitalization, outpatient visits, and composite HCRU rates (defined by a combination of inpatient, outpatient, and emergency department visits) were studied. Frequency of inpatient hospitalizations and outpatient visits were assessed up to 3, 6, 9, and 12 months after the index date and compared to frequency within 3 months before the index date using a Wilcoxon signed-rank test. Bonferroni correction was conducted to reduce the risk of Type I errors. Composite HCRU rates were compared for pre-index (3 and 6 months before index date) and post-index (3 and 6 months after index date) data using Wilcoxon signed-rank test. For both analyses, a significance level of 0.05 was used.
Generalized linear model with negative binomial distribution and log link function was used to assess the utilization frequency of psychiatric care resources during the follow-up period. Composite rates were used as the dependent variable to ensure sufficient variability in the data for regression modelling. Pre-index HCRU rates were included as an adjustment factor in the model. Variability in observation length was adjusted by introducing a time variable as an offset to model rates. All relevant predictors included in the final model for time to treatment change were subsequently considered as covariates to assess the association between patient characteristics and treatment response. Incidence rate ratios (IRRs) with 95% CI are reported for each covariate.
Assessment of disease severityDisease severity was assessed at baseline and at 3-, 6-, 9-, and 12-months after the index date using subsets of patients from the Main Cohort with available CGI-S data at the relevant time points. Clinically meaningful and substantial improvements were defined as a decrease in CGI-S scores of at least 1 point and 2 points, respectively [31]. Wilcoxon signed-rank test was used to compare CGI-S scores at the index date and during follow-up. Bonferroni correction was conducted to reduce the risk of Type I errors. In addition, association between the baseline characteristics and change in CGI-S from index date to follow-up patients were studied on the Main Cohort with available CGI-S data using mixed linear models. As with the HCRU rates, covariates selected in the final treatment change model were also used as fixed effects in the mixed linear models, except for baseline CGI-S (encoded as an ordinal variable with 7 levels), which was applied as a random effect.
SoftwarePython 3.8 and R 4.0.3 were used for all analyses in this study.
留言 (0)