
記住我

First, this study conducted MGCFA on three measurements of PHQ-9 and GAD-7 to assess their measurement invariance across different time points. By gradually adding constraints, the fit of the Configural Invariance model, Metric Invariance model, Scalar Invariance model, and Strict Invariance model was compared, as detailed in Table 3. The results showed that although the model fit indices slightly decreased with each added constraint, these decreases were minimal. Overall, the factor structure, factor loadings, item intercepts, and measurement error variances of the questionnaires remained consistent across different time points. This indicates that the questionnaires possess good measurement invariance.
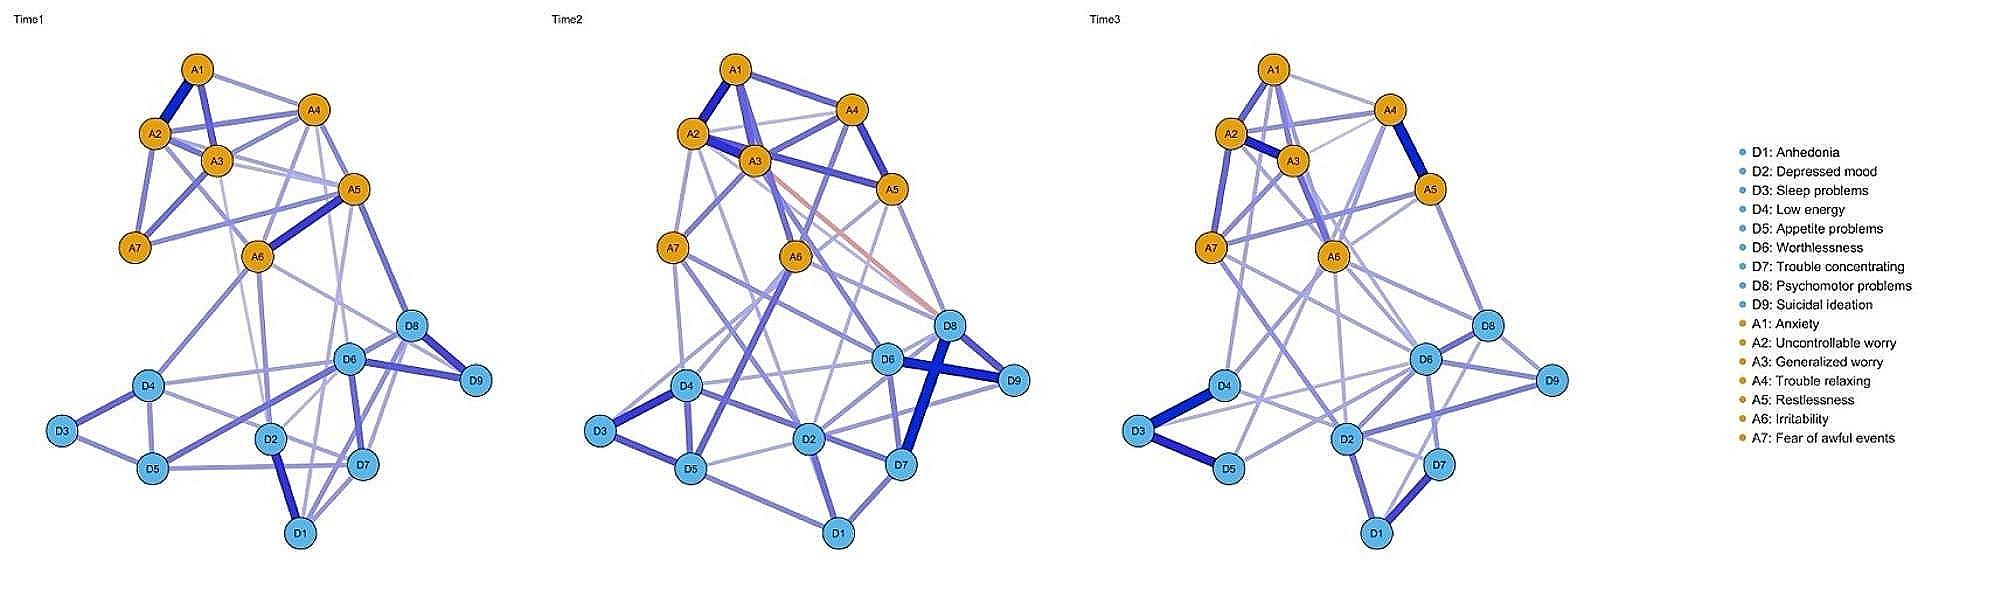
Table 3 Model fit of various invariance models for the PHQ-9 and GAD-7 by timeNetwork AnalysisNetwork comparisonFigure 1 illustrated the NA results at three different time points. The number of non-zero edges in different NAs is relatively consistent (nT1 = 39, nT2 = 40, nT3 = 38). And edge weights of the three NAs are highly correlated (rT1&T2 = 0.609, p < 0.001, CI95% = [0.526, 0.680], rT2&T3 = 0.634, p < 0.001, CI95% = [0.555, 0.702], rT1&T3 = 0.650, p < 0.001, CI95% = [0.573, 0.716]). Similarly, the EI of symptoms in the three network models is highly significantly correlated (rT1&T2 = 0.690, p = 0.003, CI95% = [0.295, 0.883], rT2&T3= 0.593, p = 0.015, CI95% = [0.138, 0.841], rT1&T3= 0.546, p = 0.028, CI95% = [0.069, 0.820]).
Fig. 1
Network Analysis of Different Time Point
Results from the network invariance test indicate non-significant differences between NAT1 and NAT2 (Test statistic M = 0.255, p = 0.25), between NAT1 and NAT3 (Test statistic M = 0.187, p = 0.82), and between NAT2 and NAT3 (Test statistic M = 0.304, p = 0.05). The global strength test results demonstrate that the overall EI of the three networks remains stable. Specifically, there are no significant differences in global strength between NAT1 and NAT2 (Global strengthNAT1 = 5.89, Global strengthNAT2 = 5.91, Test statistic S = 0.019, p = 0.95), NAT1 and NAT3 (Global strengthNAT1 = 5.89, Global strengthNAT3 = 5.77, Test statistic S = 0.120, p = 0.82), and NAT2 and NAT3 (Global strengthNAT2 = 5.91, Global strengthNAT3 = 5.77, Test statistic S = 0.140, p = 0.79).
Symptom centralityDue to the presence of negative correlations in NA in this study, the EI centrality indicator is primarily referenced, with the other two indicators used as supplementary references. The results of the centrality analysis are depicted in Fig. 2, along with the outcomes of the EI centrality difference test (Appendix fig S1). The specific symptom centrality results are as follows: in NAT1, A2 has the highest EI, followed by A5 and D6. In NAT2, A2, D8, and D6 show the highest EI. In NAT3, D6 has the highest EI, with A3, A2, and A6 following closely.
As depicted in Fig. 2, the Bridge Expected Influence analysis reveals that the EI of bridges in A6 and D2 in NAT1 is significantly higher than in some other symptoms. In NAT2, A6 and D2 exhibit higher bridge EI compared to other symptoms. Among NAT3, A6 and D6 have the higher bridge EI.
Fig. 2
Centrality Measures of NA and LNA
Edges weightThe five strongest edges in the three network models differ. In NAT1, the five strongest edges are A1 and A2 (β = 0.333), D2 and D1 (β = 0.266), A5 and A6 (β = 0.255), D9 and D8 (β = 0.238), and D9 and D6 (β = 0.212). In NAT2, the five strongest edges are D7 and D8 (β = 0.305), D9 and D6 (β = 0.280), A1 and A2 (β = 0.258), A2 and A3 (β = 0.245), and D3 and D4 (β = 0.233). For NAT3, the five strongest edges are D3 and D4 (β = 0.339), A4 and A5 (β = 0.328), A2 and A3 (β = 0.290), D3 and D5 (β = 0.284), and D1 and D7 (β = 0.243). The results of the edge weight difference test are illustrated in Appendix fig S2.
Accuracy and stabilityThe bootstrap confidence interval results for the edge weights indicate that all three network models are moderately accurate. There is considerable overlap between the CI95% of the edge weights, although some of the strongest edges do not overlap with the confidence intervals, as illustrated in Appendix fig S3. The bootstrap results for node stability indicate that the EI of nodes and the EI stability of bridge nodes for the three network models are acceptable, as displayed in Appendix fig S4.
Longitudinal Network AnalysisNetwork comparisonThe two cross-lagging network models are illustrated in Fig. 3. There are variations in the number of non-zero edges in different cross-lag network models (nT1 − T2 = 132, nT2 − T3 = 117). A significant negative correlation was observed between the edges of the cross-lagging network model (r = -0.155, p = 0.016, CI95% = [-0.276, -0.029]). The correlation for out-EI was not significant (r = -0.380, p = 0.146, CI95% = [-0.737, 0.142]), and the overall correlation for in-EI was not significant (r = 0.493, p = 0.052, CI95% = [-0.003, 0.795]).
Fig. 3
Longitudinal Network Analysis of Different Time Point
Symptom centralityThe results of the centrality analysis for LNA are displayed in Fig. 2, specifically in the out-EI and in-EI. Combined with the results of the centrality difference test (Appendix fig S5 & Appendix fig S6), it is evident that nodes with high out-EI and in-EI in the LNA exhibit temporal specificity. Notably, the in-EI of D6, D4, and A6 is the strongest, and the out-EI of D9 is the strongest in LNAT1−T2. In LNAT2−T3, A2, A4, and D2 have the strongest in-EI, while D6 has the strongest out-EI. Additionally, this study identified that D9 emitted a positive effect in LNAT1−T2, while a negative effect in LNAT2−T3.
Edges weightThe five strongest edges in the analysis of the two LNAs are not identical, and the results of the edge weight difference test are presented in Appendix fig S7. In LNAT1−T2, the strongest edge is from D9 → D6 (β = 0.376), the second strongest is from D9 → D2 (β = 0.300), the third strongest is from D9 → D8 (β = 0.282), the fourth strongest is from D9 → A3 (β = 0.197), and the fifth strongest is from D9 → A7 (β = 0.196). In LNAT2−T3, the strongest edge is from D6 → A1 (β = 0.250), the second strongest is from D5 → D3 (β = 0.211), the third strongest is from D6 → D2 (β = 0.206), the fourth strongest is from D6 → D1 (β = 0.197), and the fifth strongest is from D1 → A3 (β = 0.176).
Accuracy and stabilityThe results of the edge-weighted bootstrap confidence interval indicate that both LNA are moderately accurate. There is substantial overlap between the CI95% of the edge weights, although some of the strongest edges do not overlap with the confidence interval, as depicted in Appendix fig S8. The bootstrap results for node stability demonstrate that the edge, out-EI, and in-EI stability are acceptable in both networks, as illustrated in Appendix fig S9.
留言 (0)