
記住我

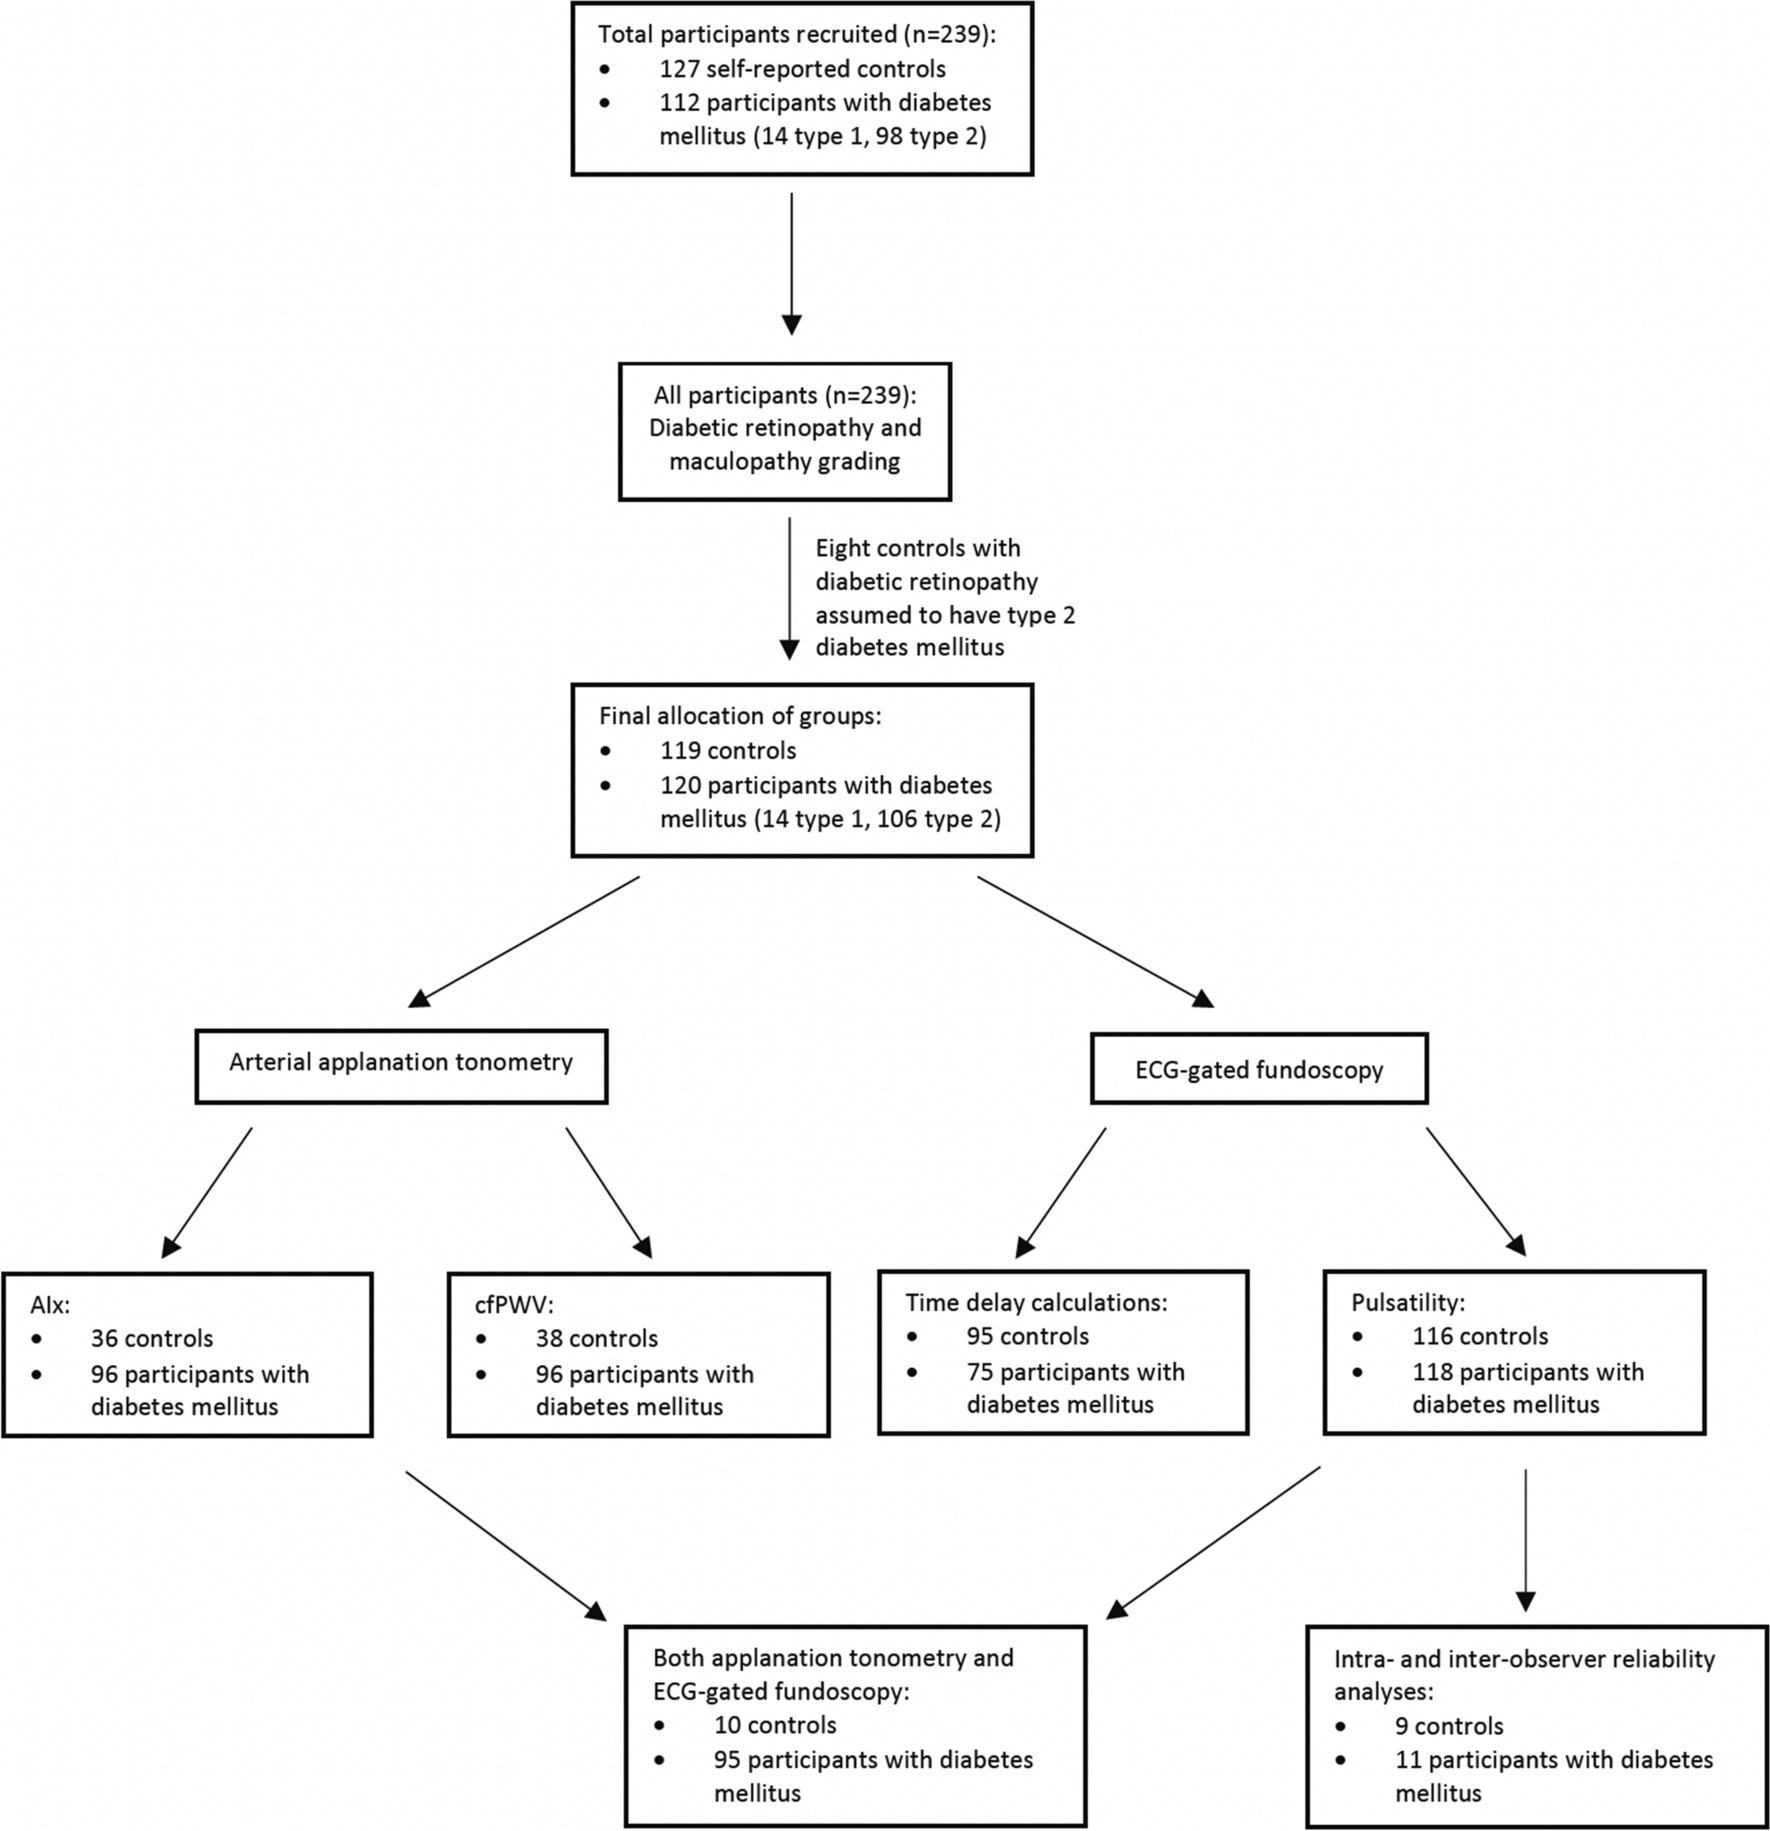
Table 1 summarises the participant characteristics of the study. Compared with controls, participants with diabetes mellitus had a higher mean age, body mass index, waist circumference, MAP, SBP, DBP, and heart rate. Caucasians and South Asians formed a large proportion of participants. A greater proportion of participants with diabetes mellitus were ex-smokers and a lower proportion had never smoked, compared with controls. A higher proportion of participants with diabetes mellitus had hypertension, hypercholesterolaemia and fatty liver compared to controls. All participants’ health conditions were well controlled with medications. All participants had no clinically significant age-related maculopathy and the majority of participants had no diabetic retinopathy.
Table 1 Participant baseline characteristicsFigure 3 compares the median cfPWV and AIx in controls and participants with diabetes mellitus. The median cfPWV was higher in diabetes mellitus compared with controls (controls 5.80m/s, IQR 1.55 vs diabetes mellitus 7.00m/s, IQR 2.35, p<0.0001). The median AIx was higher in diabetes mellitus compared with controls but this did not reach statistical significance (controls 19.26%, IQR 19.94 vs diabetes mellitus 23.27%, IQR 14.94, p=0.28). There was also no correlation between cfPWV and AIx (r=0.13, p=0.15).
Fig. 3
Comparison of median cfPWV and AIx with IQR values in controls and participants with diabetes mellitus. AIx, Augmentation index; cfPWV, carotid-femoral pulse wave velocity; IQR, interquartile range. ****p<0.0001
The time delay in retinal image initiation to acquisition between controls and participants with diabetes mellitus was calculated across four points of the cardiac cycle (0ms, 220ms, 300ms and 380ms). From the desired time of 0ms after the QRS, the actual time of photo acquisition was significantly before the QRS in participants with diabetes mellitus than controls (controls: -61.66ms, 95%CI -72.62- -51.04 vs diabetes mellitus: -39.40ms, 95%CI -50.34- -29.22, p=0.006). There was no statistically significant difference between the controls and participants with diabetes mellitus in actual times of photo acquisition compared to the desired times of 220ms (controls: 247.78ms, 95%CI 245.09-250.43 vs diabetes mellitus: 248.85ms, 95%CI 247.57-250.04, p=0.49), 300ms (controls: 305.85ms, 95%CI 304.07-308.11 vs diabetes mellitus: 305.85ms, 95%CI 304.73-307.00, p=1.00) and 380ms (controls: 386.90ms, 95%CI 385.01-389.20 vs diabetes mellitus: 386.90ms, 95%CI 385.67-388.18, p=1.00) after the QRS.
Figure 4 shows median changes in mean retinal arteriolar and venular calibres from baseline in controls and participants with diabetes mellitus. The mean changes in retinal arteriolar and venular calibres at all three time points after the QRS were significantly different from baseline (p<0.0001) in the controls and participants with diabetes mellitus. The highest arteriolar pulsatility and venular pulsatility occurred at 300ms after the QRS in both groups and both vessel types. A significantly higher median change in mean retinal arteriolar calibre from baseline was observed in participants with diabetes mellitus than controls at 220ms (controls: 0.13%, IQR 0.45 vs diabetes mellitus: 0.81%, IQR 1.12, p<0.0001), 300ms (controls: 0.92%, IQR 0.63 vs diabetes mellitus: 2.05%, IQR 1.25, p<0.0001) and 380ms (controls: 0.31%, IQR 0.77 vs diabetes mellitus: 0.88%, IQR 1.24, p<0.0001) after the QRS. A significantly higher median change in mean retinal venular calibre from baseline was also observed in participants with diabetes mellitus than controls at 220ms (controls: 0.02%, IQR 0.17 vs diabetes mellitus: 0.30%, IQR 0.48, p<0.0001), 300ms (controls: 0.40%, IQR 0.34 vs diabetes mellitus: 0.88%, IQR 0.71, p<0.0001) and 380ms (controls: 0.05%, IQR 0.22 vs diabetes mellitus: IQR 0.73, p<0.0001) after the QRS.
Fig. 4
Median and IQR values comparing mean changes in retinal arteriolar and venular calibres at 220ms, 300ms and 380ms after the QRS from baseline (QRS) between controls and diabetes mellitus. IQR, interquartile range. ****p<0.0001
The correlation of cfPWV and AIx with arteriolar pulsatility and venular pulsatility in controls and participants with diabetes mellitus was determined. There was a weak positive linear correlation of cfPWV with arteriolar pulsatility (r=0.36, p<0.0001) and venular pulsatility (r=0.23, p=0.009). There was no correlation of AIx with cfPWV (r=0.11, p=0.21), arteriolar pulsatility (r=0.07, p=0.41) and venular pulsatility (r=0.01, p=0.87). There was a moderate linear correlation between arteriolar pulsatility and venular pulsatility (r=0.61, p<0.0001).
During the multiple linear stepwise regression analysis, arteriolar pulsatility was independently associated with diabetes mellitus (β=0.64, p=0.0005), cfPWV (β=0.09, p=0.01) and venular pulsatility (β=0.53, p<0.0001). The venular pulsatility was independently associated with arteriolar pulsatility only (β=0.58, p<0.0001). After adjusting for age, sex and heart rate, cfPWV was independently associated with arteriolar pulsatility (β=0.34, p=0.03). After adjusting for age, sex, heart rate, MAP, and BMI, AIx was independently associated with diabetes mellitus only (β=8.21, p=0.0002). Venular pulsatility and cfPWV were not associated with diabetes mellitus.
Figure 5 reflects the receiver operating characteristic curve that compared associations of diabetes mellitus with arterial applanation tonometry, arteriolar pulsatility and venular pulsatility. Both arterial applanation tonometry and the retinal examinations were performed on 36 controls and 95 participants with diabetes mellitus. Figure 5a shows that in these participants, the ability to discriminate between controls and participants with diabetes mellitus was good for arteriolar pulsatility, fair for venular pulsatility and cfPWV, and poor for AIx. The retinal examinations were performed on a total of 116 controls and 118 participants with diabetes mellitus, which included the subset of participants who had completed both arterial applanation tonometry and retinal examinations. Figure 5b shows that in these participants, the ability to discriminate between controls and participants with diabetes mellitus remained good for arteriolar pulsatility and fair for venular pulsatility.
Fig. 5
Receiver operating characteristic curve that compares the associations of diabetes mellitus with a) cfPWV, AIx, arteriolar pulsatility and venular pulsatility (n=95 participants with diabetes mellitus who completed both applanation tonometry and ECG-gated fundoscopy) and b) arteriolar pulsatility and venular pulsatility only (n=118 participants with diabetes mellitus who completed ECG-gated fundoscopy +/- applanation tonometry). cfPWV, carotid-femoral pulse wave velocity; AIx, Augmentation index. ***p<0.001
The intra and inter-observer reliability of arteriolar pulsatility and venular pulsatility measurements was calculated in controls and participants with diabetes mellitus. The intra-observer reproducibility was high in retinal arterioles (ICC 0.87, 95%CI 0.71-0.95, p<0.0001) and venules (ICC 0.95, 95%CI 0.87-0.98, p<0.0001). The inter-observer reproducibility was also high in retinal arterioles (ICC 0.93, 95%CI 0.82-0.97, p<0.0001) and venules (ICC 0.97, 95%CI 0.92-0.99, p<0.0001). This demonstrated that there was good agreement of measurements by the same reviewer and between reviewers.
留言 (0)