
記住我
Vitiligo is characterised by the progressive loss of melanocytes from the epidermal basal layer, clinically presenting as achromic macules of varying shapes and sizes.1 Affecting approximately 0.2%–1.8% of the global population,2 this complex disease involves genetic, environmental, metabolic, and immune factors in its pathogenesis.3 Multiple theories have been explored, encompassing abnormalities in melanocytes and the cutaneous microenvironment, oxidative stress, intracellular abnormalities in keratinocytes, the neural hypothesis, melanocytorrhag theory, and autoimmunity.4
The most recent theory investigates the pivotal role of CD8 + T cells and their effector pathways, particularly the IFN-γ-CXCL9/CXCL-10 axis in vitiligo pathogenesis.5,6
These chemokines, specifically CXCL9 (monokine induced by gamma interferon, MIG) and CXCL-10 (interferon γ-induced protein 10, IP- 10) are secreted in response to IFN-γ, synergistically influenced by TNF-α. These chemokines facilitate the interaction of T cells with antigen-presenting cells in peripheral and central lymphoid organs as well as their migration towards lesional sites, ultimately generating effector and memory T cells against melanocytic antigens.7–9
This concept has prompted researchers to delve into the molecular intricacies and the role of certain chemokines like CXCL1, CXCL8, CXCL9, CXCL10, CXCL12, CXCL13, and CXCL16, examining their expression in both lesional skin and the serum of affected individuals.10–12 Across previous studies and considering all cytokines analysed in serum, CXCL9 and CXCL10 were most significantly associated with vitiligo.10–12 The current study aimed to estimate their expression in the serum of vitiligo patients and explore their associations with disease severity, stability, segmental versus nonsegmental vitiligo, as well as age and gender.
Aims and ObjectivesThe primary objectives of this study were to estimate the serum levels of CXCL9 and CXCL10 in vitiligo patients and age- and sex-matched controls. Additionally, the study aimed to determine a correlation between disease severity and stability with the levels of CXCL9 and CXCL10. The secondary objectives included comparing the levels of CXCL9 and CXCL10 between stable and progressive vitiligo groups, and segmental and non-segmental vitiligo groups. Also, the research aimed to identify any correlation between the presence of koebnerisation and the levels of these chemokines in serum. Furthermore, the effect of age and gender was also studied concerning chemokine levels.
Material and Methods Study Design and Source of DataThis hospital-based cross-sectional study spanned 18 months, focusing on vitiligo cases visiting the Department of Dermatology at a tertiary care hospital in North India. The parameters of interest were analysed in vitiligo patients and compared with those in healthy controls.
Study SubjectsSixty vitiligo patients of all ages and genders, attending the dermatology department, along with 30 age- and sex-matched controls without evidence of acute/chronic auto-inflammatory or autoimmune pathology, were enrolled after institutional ethics committee clearance . The sample size, calculated using the formula n = 4pq/L2, was rounded off to 60 [n = Sample size, p = Prevalence in the area (4% in hospital records), q = 100 – p, L = Error (taken as 5%)].13
Patient AssessmentInclusion Criteria: Cases of vitiligo of all ages and both sexes, including paediatric patients agreeing to give informed consent for serum studies were included.
Exclusion Criteria: Patients with a known history of autoimmune pathology, (alopecia areata, autoimmune thyroid disease, pernicious anaemia, Addison’s disease, juvenile diabetes mellitus), acute/chronic autoinflammatory conditions (rheumatoid arthritis, inflammatory bowel disease, systemic lupus erythematosus) or other associated dermatoses (psoriasis, atopic dermatitis, lichen planus, dermatitis herpetiformis, morphoea, systemic sclerosis) were excluded. Subjects receiving systemic antioxidants, corticosteroids, or immunosuppressants in the past 6 months, along with pregnant and lactating females, were excluded.
Clinical Assessment: Patients were clinically assessed for vitiligo through Wood lamp examination, dermoscopy, and biopsy where indicated. The cases were further assessed for the age of presentation, duration of disease, type of vitiligo (segmental or non-segmental), presence of koebnerisation, disease severity (VASI score),14 and disease stability (VIDA score).15 Subjects were categorised into stable (VIDA score +1, 0, –1) and progressive vitiligo groups (VIDA score +4, +3, +2) based on VIDA scores.
Biochemical AnalysisA 5 mL plain venous blood sample was collected for enzyme-linked immunosorbent assay (ELISA) of chemokines CXCL9 (BT Laboratory, China) and CXCL10 (Diaclone SAS, France). The serum was separated and ELISA detection was performed following the manufacturer’s guidelines. Blood samples were collected before treatment, and Optical Density (OD) values were recorded kinetically at 450 nm with an ELISA reader (LisaScan® EM reader). The ELISA kit sensitivity was 10.01 ng/L for CXCL9 and 5.7 ng/L for CXCL10.
Statistical AnalysisData were analysed using SPSS V.22. Numerical data were expressed as mean ± SD, and categorical data as number (%). The chi-square test and t-test were applied for statistical significance in qualitative and quantitative data, respectively. For the strength of the correlation between two variables, the Pearson correlation coefficient was applied to quantitative data (e.g., the correlation between CXCL9/CXCL10 and VASI score, VIDA score, disease duration, age of presentation) and Spearman’s rho correlation coefficient was applied to qualitative data (e.g., the correlation between CXCL9/CXCL10 and presence of koebnerisation). The p-value of <0.05 was considered statistically significant.
ResultsTable 1 provides an overview of the demographic profiles and patient characteristics for both the vitiligo and the control groups. In vitiligo patients, the mean serum CXCL9 significantly exceeded that of the control group (850.56 ± 398.98 ng/L vs. 364.14 ± 199.94 ng/L, p-value = 0.001*). Similarly, vitiligo patients exhibited markedly higher serum CXCL10 levels compared to controls (56.61± 33.47 ng/L vs. 15.93 ± 13.97, p-value = 0.001*) [Table 2]. Previous studies suggest higher CXCL9 and CXCL10 levels in progressive vitiligo.11,12,16 In the current cohort, when categorised into stable and progressive groups based on VIDA scoring, serum CXCL10 levels were significantly elevated in progressive vitiligo (p-value = 0.008*). However, CXCL9 levels though higher in the progressive group, were without statistical significance (p-value = 0.148) [Table 2]. The comparison between segmental and non-segmental vitiligo revealed higher CXCL9 and CXCL10 levels in non-segmental vitiligo, although the differences lacked statistical significance (p-value = 0.450 and 0.210, respectively) [Table 2].
Table 1: Demographic profile and clinical characteristics of study subjects
Vitiligo group (n = 60) Control group (n = 30) p value Age of presentation in years (mean ± SD) 28.7 ± 14.7 31.40 ± 12.9 0.397 Gender (M:F) 1:1 1:1 0.744 Duration in years (mean ± SD) 7.24 ± 11.54 - - Positive family history (%) 11.67 - - VASI Score (mean ± SD) 11.22 ± 12.51 - - Koebnerisation (%) 38.33 - - Stable: Progressive (n) 9:51 - - Segmental: Nonsegmental (n) 7:53 - -Table 2: Mean values of CXCL9 and CXCL10 levels in study subjects
CXCL 9 (ng/L) CXCL10 (ng/L) Vitiligo group (n = 60) Control group (n = 30) p value Vitiligo group (n = 60) Control group (n = 30) p value 850.56 ± 398.98 364.14 ± 199.94 0.001* 56.61± 33.47 15.93 ± 13.97 0.001* Stable vitiligo (n = 9) 672.58 ± 172.30 - 0.148 29.70 ± 28.94 - 0.008* Progressive vitiligo (n = 51) 881.97 ± 419.98 - 61.35 ± 32.16 - Females (n = 30) 838.16 ± 272.82 - 0.812 54.17 ± 29.51 - 0.577 Males (n = 30) 862.96 ± 499.12 - 59.04 ± 37.36 - Segmental vitiligo (n = 7) 742.29 ± 132.44 - 0.450 41.62 ± 28.61 - 0.210 Non-segmental vitiligo (n = 53) 864.86 ± 420.49 - 58.58 ± 33.80 -Both CXCL9 and CXCL10 demonstrated positive and highly significant correlations with VASI scores (Pearson correlation coefficient, r-value = 0.461 and 0.550, p-value = 0.001* and 0.001* respectively) [Table 3, Figure 1a and Figure 1b]. Despite varying significance in stable and progressive vitiligo, both chemokines showed positive and highly significant correlations with VIDA scores (Pearson correlation coefficient, r-value = 0.277 and 0.575, p-value = 0.032* and 0.001* respectively) [Table 3, Figure 1c and Figure 1d]. While both CXCL9 and CXCL10 correlated negatively with disease duration, the results were statistically insignificant (r-value = –0.071 and –0.082, p-value = 0.590 and 0.534 respectively) [Table 3]. Furthermore, both these parameters correlated positively with the presence of koebnerisation (Spearman’s rho correlation coefficient, r-value = 0.254 and 0.072, respectively), with CXCL9 nearing significance (p-value = 0.059) [Figure 1e and Figure 1f, Table 3].
Table 3: Correlation between various parameters and serum CXCL9 and CXCL10
CXCL9 CXCL10 VASI (Pearson Correlation) r value .461 .550 p-value 0.001* 0.001* VIDA (Pearson Correlation) r value .277 .575 p-value 0.032* 0.001* Disease duration (Pearson Correlation) r value –0.071 –0.082 p-value 0.590 0.534 Age of presentation (Pearson Correlation) r value –0.058 0.024 p-value 0.660 0.853 Koebnerisation (Spearman’s rho correlation) r value 0.245 0.072 p-value 0.059 0.583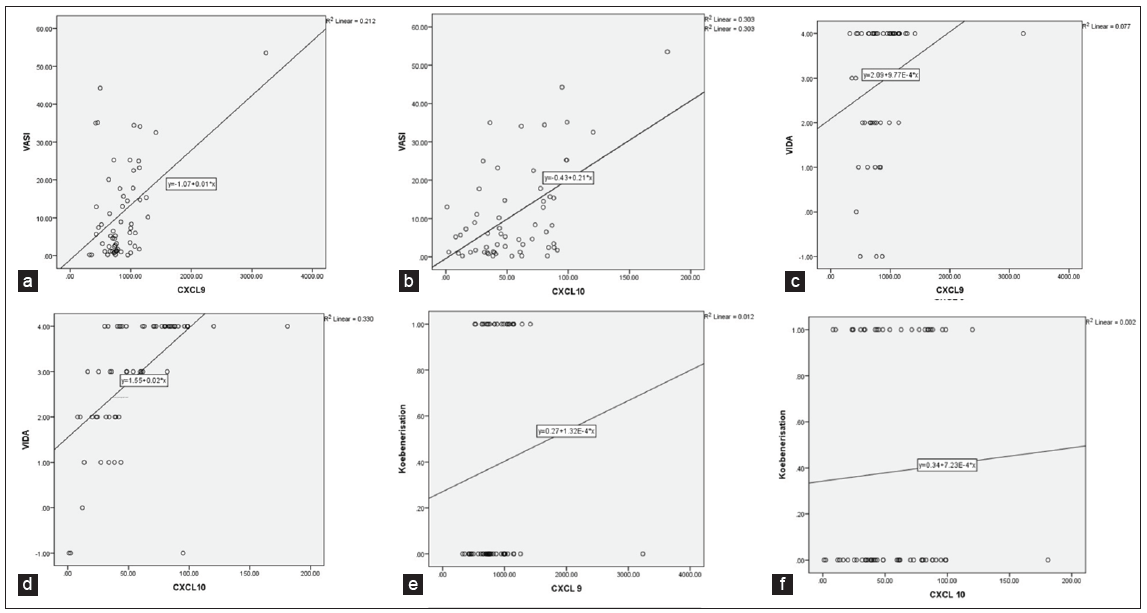
Export to PPT
Upon assessing the effect of age and gender on serum CXCL9 and CXCL10 in vitiligo patients, despite the general reduction of immune functions with advancing age (immunosenescence)17 and potential bias in the expression of immune mediators in gender-diverse study populations,18 no significant differences or correlations with age were found when comparing CXCL9 and CXCL10 levels between males and females and different age groups in the study population [Tables 2 and 3].
DiscussionIn vitiligo, the role of autoimmunity and auto cytotoxicity by immune cells was identified mainly through T cell-mediated immune response, particularly the infiltration of cytotoxic CD8+ melanocyte-specific T cells in the perilesional skin.19 This immune response is initiated by dermal dendritic cells presenting melanocyte-specific antigens to T cells, evidenced by their increased concentration in lesional skin and the invasion of CD11c+ dendritic cells (DCs) into basal layers of the epidermis, juxtaposed with basal keratinocytes and melanocytes. Dendritic cells target melanosome-specific antigens, including tyrosinase, gp100, Melanoma antigen recognized by T cells (MART)-1, Tyrosinase related protein (TRP)-2, P protein, and TRP-1.20 T cell response against Melanoma antigen (Melan-A)/MART-1 is selected during T cell development in the thymus, cross-reacting with melanocytes surface-expressed peptides by MHC class I molecules, to be potentially recognized by antigen-specific CD8+ T cells.21 Melanocyte-specific CD8+ T cells are detected in the peripheral blood of both melanoma and vitiligo patients, with high numbers of Melan-A/MART1 and tyrosinase-specific cells.22,23,24
Effector pathways in vitiligo are predominantly of the Th1 type, complemented by contributions from the innate arm of immunity, Th17, and Th2 responses. The proinflammatory milieu of vitiligo skin harbours cytokines like IL-1α, IL-1β, IL-6, IL-8, IL-12, IL-15, TNF-α, IL-2, IFN-γ, TNF-β, IL-4, IL-5, IL-10, IL-13, IL-17, IL-22 and IL-23, with TNF-α and IFN-γ being the major drivers.25,26
IFN-γ influences naive T cell differentiation into IFN-γ producing effector T cells, perpetuating CD8+ T cell homing to the skin through chemokine induction (CXCL9, CXCL10) and adhesion molecule (CXCR3) expression on endothelial cells.27,28 This IFN-γ-CXCL9/CXCL-10 axis, acting via CXCR3, forms a paracrine axis activating CD8+ T cells, along with the migration of autoreactive T cells into the epidermis, implicated in rapidly progressing and severe disease.7,29
The first investigative report on chemokine levels in vitiligo was published by Rashighi et al in 2014. They found a significant elevation of CXCL10 in vitiligo patients, while CXCL9 and CXCL11 showed no such increase.30 To support their observation, they neutralised CXCL9 and CXCL10 in a mouse model using a neutralising antibody. Their results revealed a significant reduction in depigmentation upon neutralising CXCL10, but CXCL9 did not have the same effect. In 2016, Wang et al conducted another study demonstrating significantly higher expression of both serum CXCL9 and CXCL10 in vitiligo patients, especially in progressive cases compared to stable ones, and in comparison to healthy controls (all p < 0.01).12 They also noted that serum CXCL10 levels decreased in parallel with disease stabilisation, whereas CXCL9 did not show statistically significant changes. The current study aligns with these findings, showing significant elevation of both CXCL9 and CXCL10 in vitiligo patients compared to controls. Moreover, their levels correlated positively and highly significantly with VASI and VIDA scoring, reflecting their expression in serum as the disease progresses and depigmentation expands. Similar observations were reported by Zhang et al and Maouia et al in previous studies [Table 4].10,16 However, when comparing stable and progressive vitiligo, only CXCL10 showed a significant elevation, not CXCL9, consistent with the findings reported by Yang et al as well [Table 5].11
Table 4: Comparison of CXCL9 and CXCL10 levels in the study group and the control group, and their corresponding p values in different studies
Present study Yang et al 201811 Zhang et al 201910 Wang et al 201612 Maouia et al 201716 Rashighi et al 201430 CXCL 9 (ng/L) Vitiligo group 850.56 ± 398.98 3197.68 ± 2275.41 270.4 ± 29.1 75.24 ± 28.39 - - Control group 364.14 ±199.94 3888.16 ± 438.21 99.2 ± 18.3 28.31 ± 9.59 - - p-value 0.001* 0.103 <0.001* <0.01* <0.05* Not significant CXCL 10 (ng/L) Vitiligo group 56.61 ± 33.47 471.41± 203.32 916.9 ±157.3 50.00 ±12.49 - - Control group 15.93 ±13.97 359.58 ± 438.21 117.1 ± 28.1 25.80 ± 7.96 - - p value 0.001* 0.069 <0.001* <0.01* <0.05* SignificantTable 5: Comparison of CXCL9 and CXCL10 levels in stable and progressive vitiligo, and their corresponding p values in different studies
Present study Yang et al 201811 Wang et al 201612 Maouia et al 201716 CXCL9 (ng/L) Progressive vitiligo 881.97±419.98 3608.32±5908.56 75.24±28.39 - Stable vitiligo 672.58±172.30 2577.56±2817.60 52.37±23.64 - p-value 0.148 0.236 <0.01* Reported higher results in progressive vitiligo (figures not available) CXCL10 (ng/L) Progressive vitiligo 61.35±32.16 498.85±317.85 50.00±12.49 - Stable vitiligo 29.70±28.94 428.47±249.63 30.18±10.64 - p-value 0.008* 0.044* <0.01* Reported higher results in progressive vitiligo (figures not available)In the present study, a comparison of means between segmental and non-segmental vitiligo did not yield significant results for either chemokine. This suggests that the type of vitiligo may not significantly influence the expression of these chemokines in the serum, although this observation was limited by an uneven distribution of patients in each group. In a study done by Zhang et al, CXCL9 and CXCL10 were evaluated only in the non-segmental vitiligo group, excluding segmental vitiligo patients.10 Thus, the impact of vitiligo type on serum chemokine levels remains an open question, necessitating further investigation with a larger, evenly distributed patient cohort.
Furthermore, no significant correlations were found between serum CXCL9 and CXCL10 and disease duration, age at presentation, or gender in vitiligo patients. This implies that CXCL9 and CXCL10 may play a role in the initiation and perpetuation of the disease but do not accumulate with disease progression over time, or exhibit variations with ageing, senescence, puberty, or menopause. Richmond et al’s study supports this observation, indicating high expression of CXCL9 before and during the peak disease, whereas CXCL10 peaks with disease activity and is maintained up to 10 weeks after vitiligo induction when the disease stabilises.31
Finally, although not statistically significant, serum CXCL9 & CXCL10 positively correlated with koebnerisation in vitiligo patients. This observation is salient, as koebnerisation is a known clinical marker of disease activity,32 aligning with our earlier finding of a positive correlation between VIDA (disease activity score) and both CXCL9 and CXCL10.
LimitationsThe limitations of the present study included a small control population of 30 due to resource constraints for performing investigations. The voluntary nature of patient recruitment and the absence of a specific sampling technique resulted in an uneven distribution of patients in the progressive and stable vitiligo groups, as well as the segmental and non-segmental groups. Additionally, the study did not include an analysis of chemokines in blister fluid from lesional skin, which could be explored in future research. The impact of therapy on chemokines was not assessed, presenting another potential avenue for the future.
ConclusionBoth serum CXCL9 and CXCL10 were notably elevated in vitiligo patients compared to controls, exhibiting a linear ascent with escalating disease severity and instability. Their higher values in the progressive group suggest their potential as serum biomarkers for assessing disease activity. Since, the serum values of CXCL9 were quantitatively much higher than CXCL10 in the present study, and have shown varied values in different studies available in the literature so far, standardised equipment and procedures to run the investigations over larger sample size, and ROC analysis (Receiver Operator Characteristic) is recommended to address their biomarker potential further. Nonetheless, due to its higher mean values and closer association with the clinical disease activity marker, koebnerisation, CXCL9 appears to be a more reliable and entrusted single biomarker for assessing disease perpetuation in vitiligo patients.
留言 (0)