
記住我


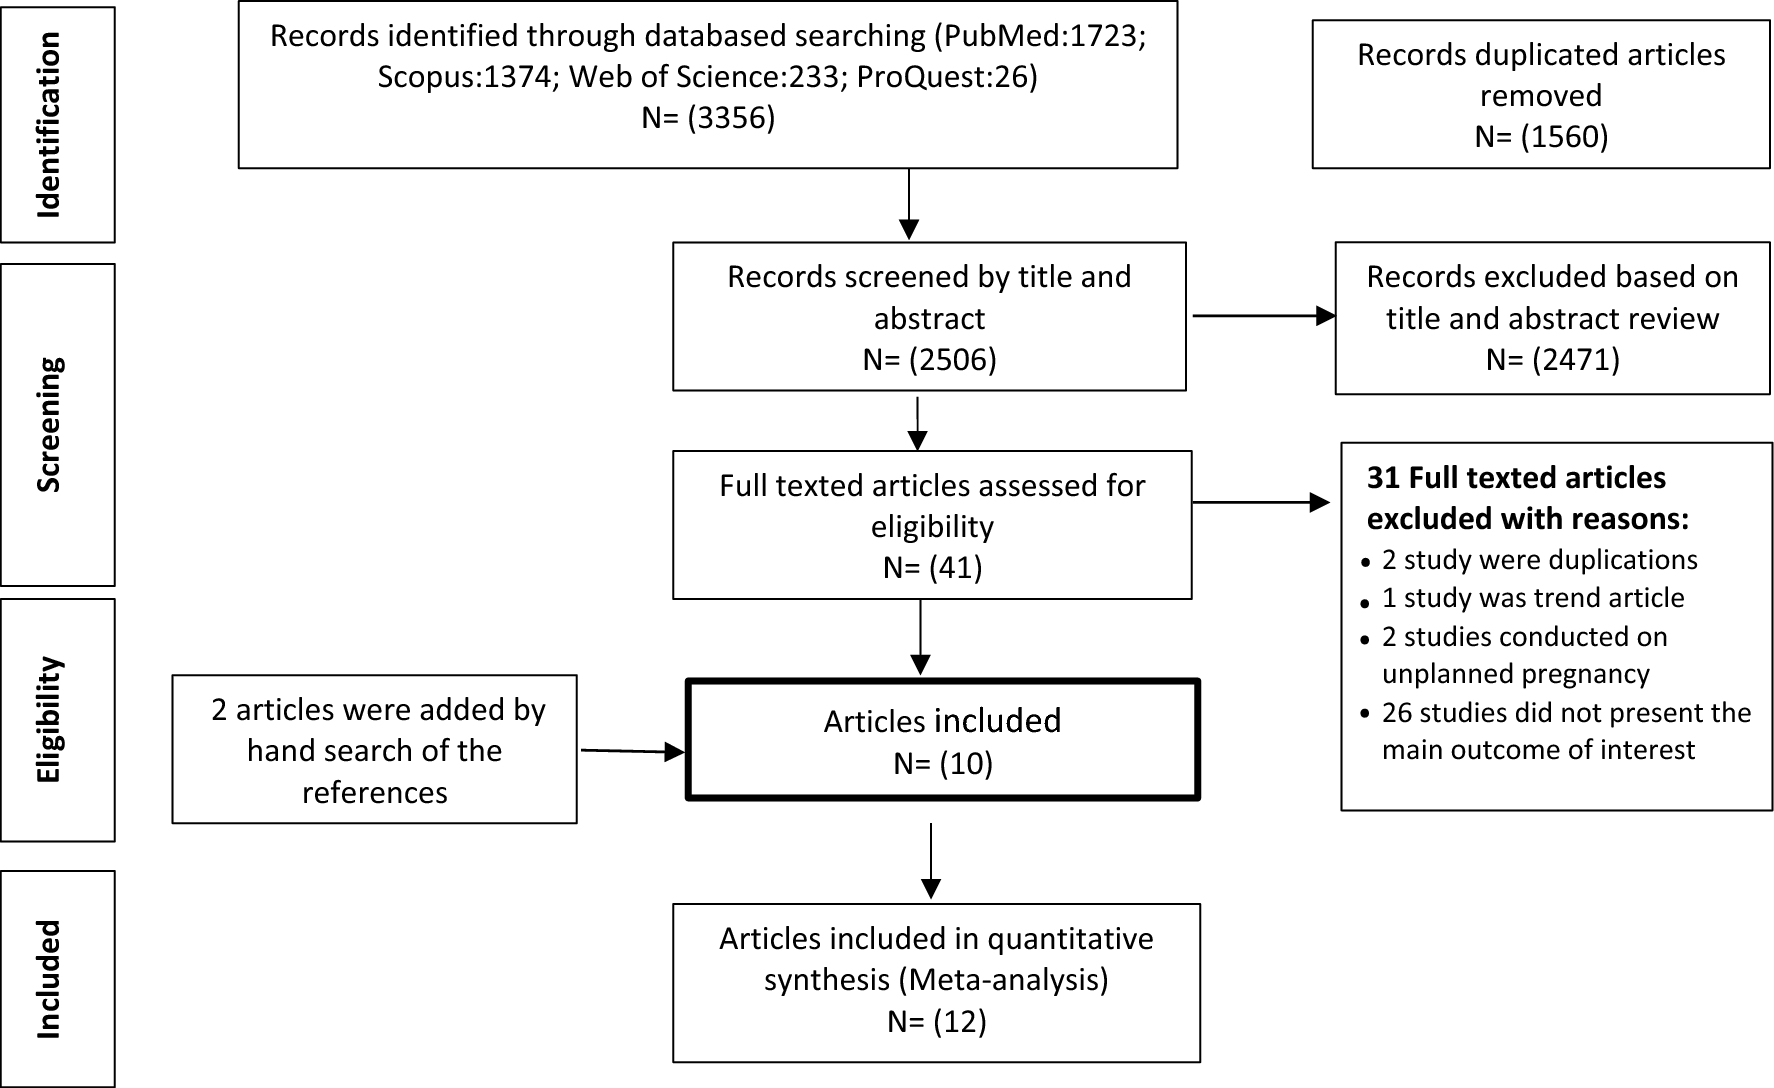

We obtained 14610 publications via the electronic search strategy (Web of Sciences: 6102; PubMed: 5945; Scopus; 2516; Cochrane Library: 47) from inception to 15 December 2023. Of these publications, 4734 duplicates were removed, and 9910 were subjected to title and abstract screening. Thirty articles were selected for eligibility at full-text review of which, 23 were eligible to be included in this review. Figure 1 shows the flowchart of the study.
Fig. 1
The flow diagram of the systematic review for selection of the studie
Study characteristicsDescription of the studies is shown in Table 1. The reviewed observational studies included cohort studies (13 papers), case–control studies (7 papers), and longitudinal design (3 papers). As far as the country of origin of the studies was concerned, four were performed in Italy [26,27,28,29], three in Japan [30,31,32], three in China [6, 33, 34], three in Australia [18, 35, 36], two in the UK [17, 37], two in Denmark [38, 39], two in the USA [40, 41], one in France [42], one in Taiwan [10], one in Sweden [16], and one in Canada [43]. The number of participants in the studies varied from 40 to 1,429,585. In all studies, women of reproductive age were included. The diagnosis of endometriosis in the included studies was based on the results of laparoscopy, surgery, diagnosis code of International Classification of Diseases ICD 9—ICD10, or imaging. In this review, 133,941 women with endometriosis were compared with 8,932,888 healthy women in terms of hypertensive disorders of pregnancy. Table 2 shows the definitions of hypertensive disorders and endometriosis across all included studies.
Table 1 Characteristics of studies included in the systematic reviewTable 2 Definition of hypertensive disorders and endometriosis in the included studiesMeta-analysis of outcomesGestational hypertensionThe relationship between gestational hypertension and endometriosis was investigated in 8 studies [6, 18, 26, 27, 31, 33, 36, 38]. The evidence showed a positive and significant statistical relationship between the two mentioned variables (OR = 1.11, 95% CI: 1.06, 1.16; I2 = 45%, P < 0.0001; N = 8) (Fig. 2). Due to the limited number of papers on the relationship between gestational hypertension and endometriosis, it was not possible to generate a funnel plot.
Fig. 2
Forest plot showing the relationship between gestational hypertension and endometriosis between the two case and control group
Pre-eclampsiaTwelve papers reported the relationship between pre-eclampsia and endometriosis [6, 16,17,18, 26,27,28, 30, 35, 38, 39, 42]. As Fig. 3 shows, there is a positive relationship between pre-eclampsia and endometriosis (OR = 1.27, 95% CI: 1.23, 1.32; I2 = 67%, P < 0.00001; N = 12). Because of high heterogeneity, we performed sensitivity analysis. By removing the effect of three studies [17, 18, 42] on the overall results, heterogeneity reached 44%, and still, the evidence indicated a statistically significant positive relationship between endometriosis and preeclampsia (OR = 1.26, 95% CI: 1.18, 1.36; I2 = 37%, P < 0.00001) (Fig. 4). Based on this, the chance of developing pre-eclampsia in the case group is 1.26 times that of the control group. In other words, the chance of developing pre-eclampsia in the case group is 26% higher than that in the control group. The distribution of points in the funnel plot (Fig. 5) as well as the Egger test results in Table 3 show that there is no publication bias (P-value = 0.808).
Fig. 3
Forest plot showing the relationship between pre-eclampsia and endometriosis between the two case and control group
Fig. 4
Forest plot of sensitivity analysis showing the relationship between pre-eclampsia and endometriosis between the two case and control group
Fig. 5
Funnell plot of included studies to assess the potential publication bias
Table 3 Egger test results for publication biasHypertensive disordersEight papers [10, 29, 32, 34, 37, 40, 41, 43] assessed the overall occurrence of hypertensive disorders (combined gestational hypertension-preeclampsia) in women affected with endometriosis. The meta-analysis showed a statistically significant relationship between hypertensive disorders and endometriosis with high heterogeneity (OR = 1.17, 95% CI: 1.12, 1.22; I2 = 93%, P < 0.00001; N = 8) (Fig. 6). To reduce heterogeneity, we omitted the effect of two papers [10, 40] on the overall results. Heterogeneity reached eight percent, and a statistically significant relationship between the two variables was identified (OR = 1.13, 95% CI: 1.06, 1.21; I2 = 8%, P = 0.0001) (Fig. 7). In other words, the chance of developing hypertensive disorder in the case group is 13% higher than that in the control group. A funnel plot could not be generated due to the limited number of papers on the relationship between hypertensive disorders and endometriosis.
Fig. 6
Forest plot showing the relationship between hypertensive disorders and endometriosis between the two case and control group
Fig. 7
Forest plot of sensitivity analysis showing the relationship between hypertensive disorders and endometriosis between the two case and control group
Assessment of the risk of bias within studiesThe quality assessment of the included studies is shown in Table 4. The median total quality score was 16 which represented moderate quality.
Table 4 Quality assessment of the articles reviewed
留言 (0)