
記住我

In recent years, despite a decline in gastric cancer incidence and mortality, this disease remains a prevalent upper gastrointestinal (UGI) malignancy globally.1 In 2020, there were over 1 million new cases and approximately 770,000 deaths worldwide, ranking fifth in cancer incidence and fourth in mortality.2 China reported 479,000 new cases and 374,000 deaths in 2020, contributing to 43.9% and 48.6% of global cases and deaths, posing a significant public health concern.2 Factors such as rapid economic development, aging population, and unhealthy lifestyles have exacerbated the cancer burden in China, making gastric cancer the third most burdensome cancer.3
As a screening strategy, primary screening is used to identify high-risk populations, followed by diagnostic screening of high-risk populations using gastroscopy. This is the most effective way of reducing the cancer disease burden.4 Since 2005, China has implemented UGI cancer screening in over 110 high-risk areas as part of a national public health program.5 In 2011, the Ministry of Health and the Expert Committee of Early Diagnosis and Treatment of Cancer Project introduced the “Technical Programme of the Early Diagnosis and Treatment of Cancer Project (2011 Edition).”6 Subsequent publications, such as the “Upper Gastrointestinal Tract Cancer Screening and Early Diagnosis and Treatment Technical Programme (2014, Trial)” and the “Upper Gastrointestinal Tract Cancer Population Screening and Early Diagnosis and Treatment Technical Programme (2020),” have further refined UGI cancer screening in China.7 These efforts have had a positive impact on society, with the 5-year relative survival rate for gastric cancer increasing from 27.4% in 2003 to 35.1% in 2015, although it still lags behind Japan (80.1%) and South Korea (77.5%).1,5,8,9
The reasons for the low 5-year relative survival rate for gastric cancer in China may include (i) low public awareness of cancer prevention; (ii) insufficient endoscopic examination equipment and personnel; and (iii) misconceptions about gastroscopy and a low prevalence of related knowledge. The outcomes and survival time for gastric cancer are closely related to how early the disease is detected.10 Based on data from cancer screening programs, the average participation rate in UGI gastroscopy screening in China is 26.07%,11,12 with Kunming, Yunnan Province, having a relatively high participation rate of 24.34%13 and Urumqi, Xinjiang Uygur Autonomous Region, having a lower participation rate of only 15.5%.14 Multiple studies4,15,16 have identified low awareness of UGI screening as a major obstacle to the low screening rate in China. This can be attributed to several reasons: (i) lack of publicity and education; (ii) fear and misconceptions; and (iii) inadequate health care resources.
Thus, improving UGI screening uptake is a key aspect of effective gastric cancer prevention and treatment in China. Due to the late start of cancer screening in China, few studies have systematically explored the factors influencing UGI screening behavior. The main objective of this study is to assess people's knowledge of the UGI cancer screening program and their overall attitude toward the gastroscopy procedure, as well as to investigate the barriers associated with gastroscopy knowledge and behavior. The aim is to improve gastroscopy screening uptake among people at high risk of upper gastrointestinal cancer (UGC), and thus, to reduce UGC incidence and improve UGC survival.
METHODS DesignThis cross-sectional study was conducted from June to September 2022 in a Chinese tertiary care hospital that runs a general cancer screening program. An online questionnaire was used; the participants were informed of confidentiality and only those who consented received the questionnaire. Ethical approval was obtained from the Institutional Review Board of Jiangnan University, China (approval number: JUN20220310IRB37) and the study was conducted in accordance with the revised Declaration of Helsinki.
ParticipantsThe participant inclusion criteria were as follows: (i) patients or family members attending the hospital outpatient clinic; (ii) conscious patients with good verbal communication and comprehension skills; and (iii) voluntary participation with informed consent. Exclusion criteria were as follows: (i) inability to provide consent due to mental or cognitive reasons; and (ii) refusal or failure to complete the questionnaire.
Sample sizeAccording to international standards for questionnaire design as well as recommendations from earlier studies, to improve the structural stability of a questionnaire, the sample size should be 5 to 10 times the number of scale entries.17 Based on a 10% to 20% rejection rate, the final sample for this study was 320.
Outcome measures Questionnaire part 1: general informationThis part of the questionnaire was a self-designed general survey based on China's national conditions and the current situation regarding UGC screening. The questionnaire screened gender, age, and marital status, along with 16 other items (see Table 1).
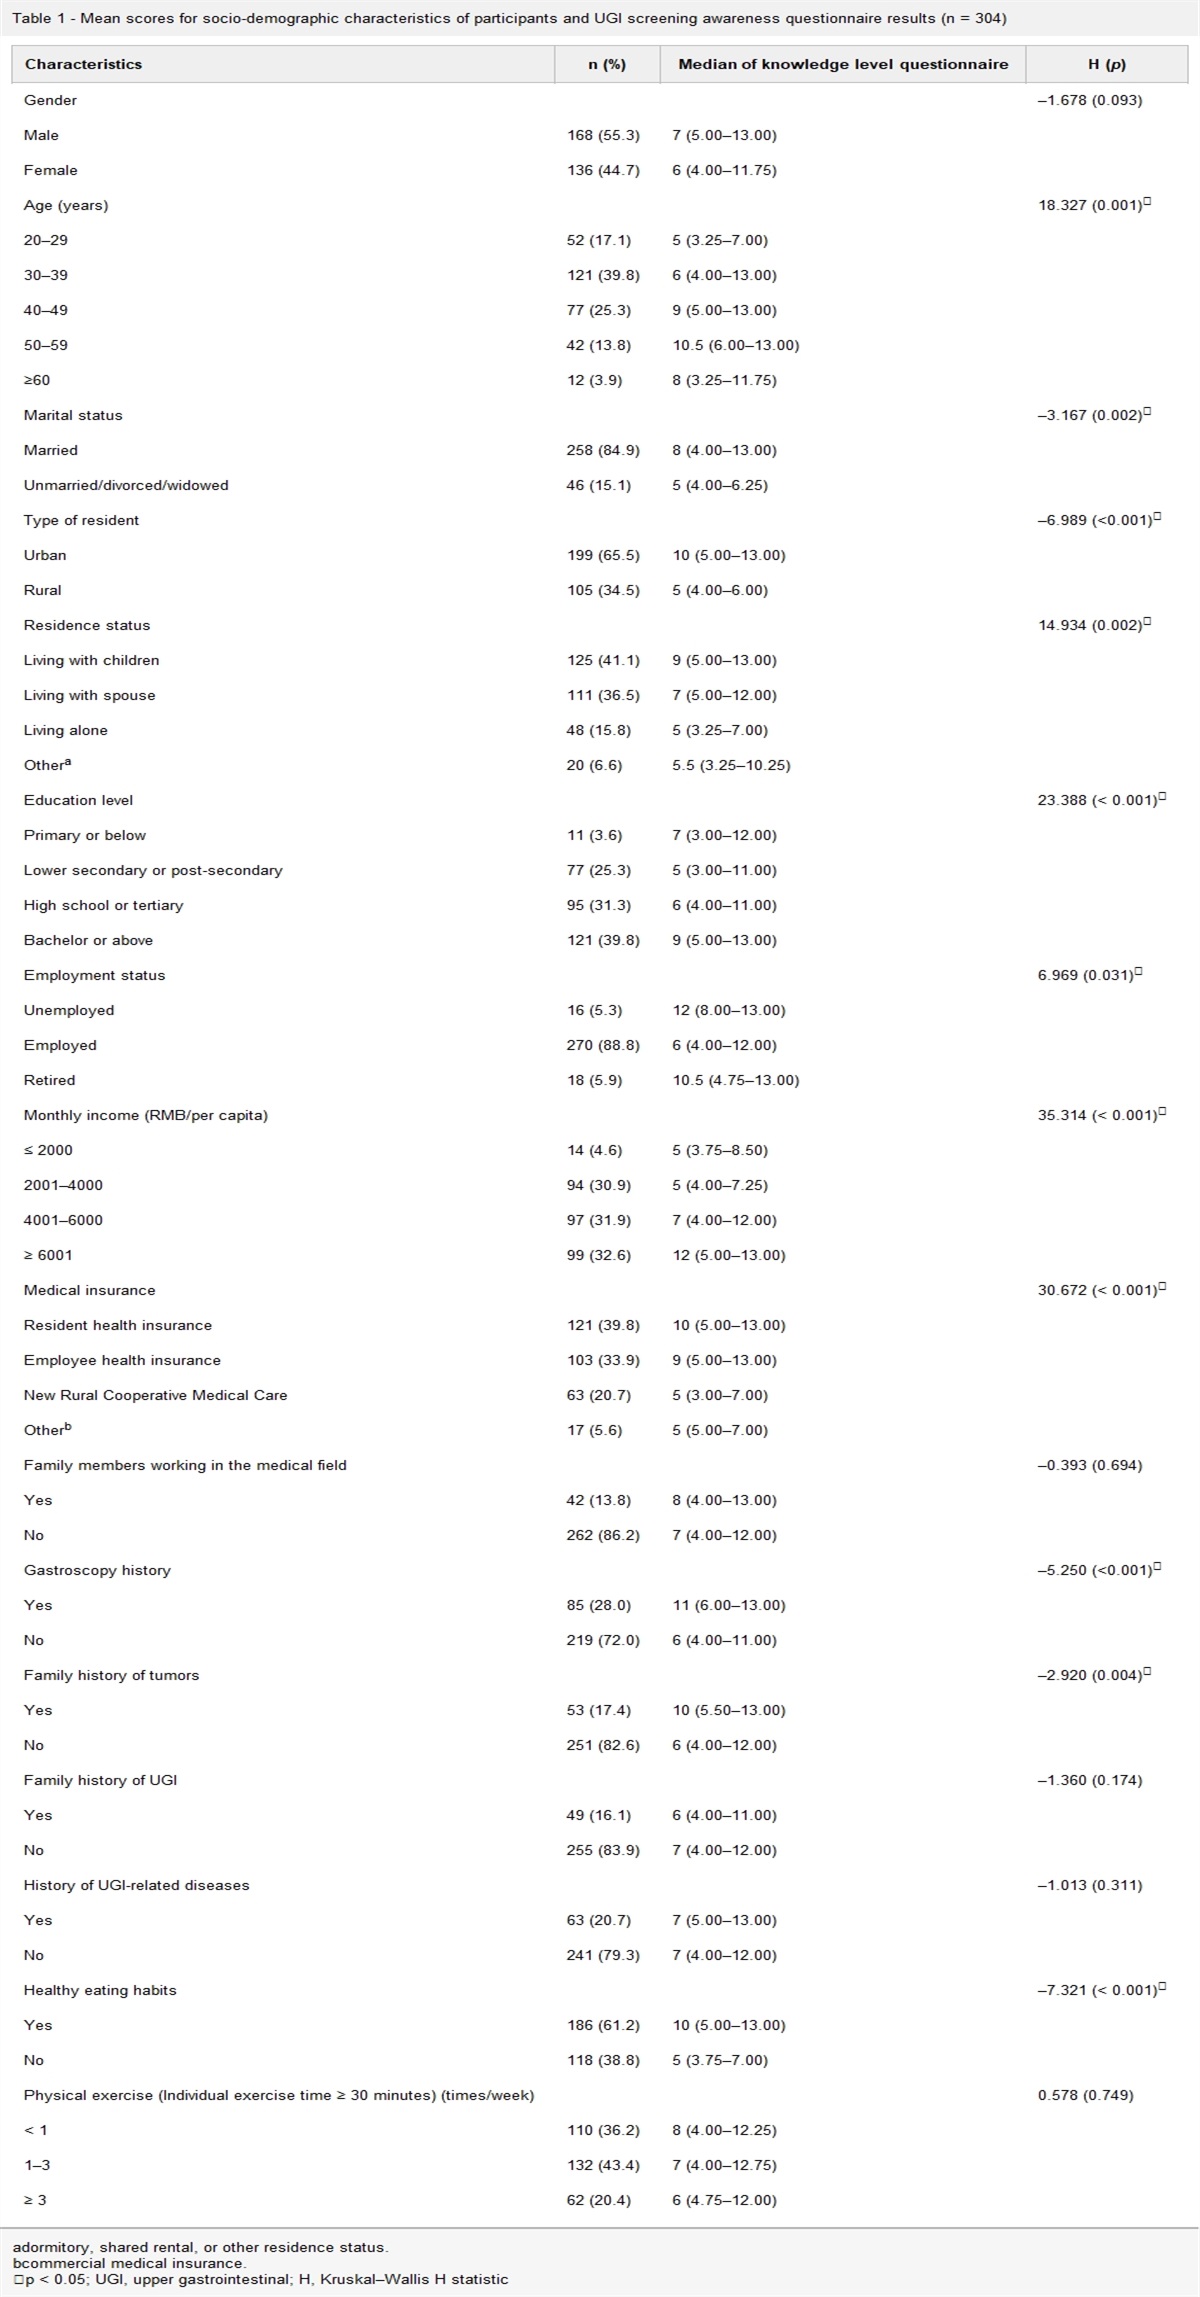
Table 1 - Mean scores for socio-demographic characteristics of participants and UGI screening awareness questionnaire results (n = 304) Characteristics n (%) Median of knowledge level questionnaire H (p) Gender –1.678 (0.093) Male 168 (55.3) 7 (5.00–13.00) Female 136 (44.7) 6 (4.00–11.75) Age (years) 18.327 (0.001)∗ 20–29 52 (17.1) 5 (3.25–7.00) 30–39 121 (39.8) 6 (4.00–13.00) 40–49 77 (25.3) 9 (5.00–13.00) 50–59 42 (13.8) 10.5 (6.00–13.00) ≥60 12 (3.9) 8 (3.25–11.75) Marital status –3.167 (0.002)∗ Married 258 (84.9) 8 (4.00–13.00) Unmarried/divorced/widowed 46 (15.1) 5 (4.00–6.25) Type of resident –6.989 (<0.001)∗ Urban 199 (65.5) 10 (5.00–13.00) Rural 105 (34.5) 5 (4.00–6.00) Residence status 14.934 (0.002)∗ Living with children 125 (41.1) 9 (5.00–13.00) Living with spouse 111 (36.5) 7 (5.00–12.00) Living alone 48 (15.8) 5 (3.25–7.00) Othera 20 (6.6) 5.5 (3.25–10.25) Education level 23.388 (< 0.001)∗ Primary or below 11 (3.6) 7 (3.00–12.00) Lower secondary or post-secondary 77 (25.3) 5 (3.00–11.00) High school or tertiary 95 (31.3) 6 (4.00–11.00) Bachelor or above 121 (39.8) 9 (5.00–13.00) Employment status 6.969 (0.031)∗ Unemployed 16 (5.3) 12 (8.00–13.00) Employed 270 (88.8) 6 (4.00–12.00) Retired 18 (5.9) 10.5 (4.75–13.00) Monthly income (RMB/per capita) 35.314 (< 0.001)∗ ≤ 2000 14 (4.6) 5 (3.75–8.50) 2001–4000 94 (30.9) 5 (4.00–7.25) 4001–6000 97 (31.9) 7 (4.00–12.00) ≥ 6001 99 (32.6) 12 (5.00–13.00) Medical insurance 30.672 (< 0.001)∗ Resident health insurance 121 (39.8) 10 (5.00–13.00) Employee health insurance 103 (33.9) 9 (5.00–13.00) New Rural Cooperative Medical Care 63 (20.7) 5 (3.00–7.00) Otherb 17 (5.6) 5 (5.00–7.00) Family members working in the medical field –0.393 (0.694) Yes 42 (13.8) 8 (4.00–13.00) No 262 (86.2) 7 (4.00–12.00) Gastroscopy history –5.250 (<0.001)∗ Yes 85 (28.0) 11 (6.00–13.00) No 219 (72.0) 6 (4.00–11.00) Family history of tumors –2.920 (0.004)∗ Yes 53 (17.4) 10 (5.50–13.00) No 251 (82.6) 6 (4.00–12.00) Family history of UGI –1.360 (0.174) Yes 49 (16.1) 6 (4.00–11.00) No 255 (83.9) 7 (4.00–12.00) History of UGI-related diseases –1.013 (0.311) Yes 63 (20.7) 7 (5.00–13.00) No 241 (79.3) 7 (4.00–12.00) Healthy eating habits –7.321 (< 0.001)∗ Yes 186 (61.2) 10 (5.00–13.00) No 118 (38.8) 5 (3.75–7.00) Physical exercise (Individual exercise time ≥ 30 minutes) (times/week) 0.578 (0.749) < 1 110 (36.2) 8 (4.00–12.25) 1–3 132 (43.4) 7 (4.00–12.75) ≥ 3 62 (20.4) 6 (4.75–12.00)adormitory, shared rental, or other residence status.
bcommercial medical insurance.
∗p < 0.05; UGI, upper gastrointestinal; H, Kruskal–Wallis H statistic
Given the lack of a validated scale in this study, this section of the questionnaire contained questions to measure the participants’ knowledge of UGC screening (see Appendix I, https://links.lww.com/IJEBH/A144). We reviewed the literature and based our questionnaire on the guidelines of the European Society of Oncology and the American Society of Clinical Oncology; the screening implementation policies of China, South Korea, and Japan; and various sources describing UGI tumor risk factors.18–22 The questionnaire focused on (i) identification of risk factors for gastric cancer; (ii) identification of warning symptoms of gastric cancer; and (iii) views on gastric cancer and screening. Overall, the questionnaire contained 13 items, with 1 point accorded for “Correct/Yes” answers and 0 points for “Incorrect/No” and “Unsure/Don’t know” answers, with the total score ranging from 0 to 13 points. Higher scores indicated greater knowledge of UGI screening.
Questionnaire part 3: gastroscopy acceptanceThis section of the questionnaire examined participants’ attitudes toward gastroscopy, concerns about gastroscopy, opinion about gastroscopy, understanding of gastroscopy, the ease of obtaining information about gastroscopy, understanding the specific process of undergoing a gastroscopy, and the importance of gastroscopy (see Appendix II, https://links.lww.com/IJEBH/A145).
Quality controlBefore starting the survey, we first sent the questionnaire to a group of UGI screening teams, including the head of the early tumor screening project, 2 gastroenterologists, 2 oncology nurses, and 5 gastroenteroscopy examination nurses. This was to ensure that the questionnaire content was clear and easily understandable. Based on the feedback, the questionnaire was modified and improved. For the final version of the questionnaire, the Cronbach's α coefficient was 0.871 and the Kaiser–Meyer–Olkin value was 0.776. This indicates that the questionnaire had good reliability and validity.
Data collectionThe questionnaire was administered electronically, at the hospital. The researcher explained the purpose of the study to participants, obtained consent, and provided instructions for questionnaire completion. Any doubts were addressed on the spot, and the questionnaire took approximately 6–8 minutes to complete. To enhance participation, participants were provided with a free brochure about UGI screening and gastroscopy.
Data analysisData were analyzed using SPSS version 25.0 (IBM, Armonk District, New York City, USA). Descriptive analyses were conducted using frequency counts and percentages. Rank sum tests were used to analyze differences between the UGI screening awareness questionnaire scores. Simple linear regression analyses and binary logistic regression analyses were conducted to determine the factors influencing high UGI screening awareness and the attitudes toward gastroscopy screening. Spearman's correlation analysis was used to test the correlation between the level of awareness of UGI screening and the acceptance of gastroscopy. For all 2-tailed statistical tests, a value of p < 0.05 was considered statistically significant.
RESULTS Socio-demographic characteristics and UGI screening awareness scoresA total of 320 participants took part in the survey, with 304 valid responses, resulting in a valid response rate of 95%. Among the participants, 252 (82.9%) were aged 30 years or above, 168 (55.3%) were male, 199 (65.5%) lived in towns or cities, 236 (77.6%) lived with their children or spouses, 270 (88.8%) were employed, 196 (64.5%) had a monthly household income of RMB 4,000 or more, and 184 (60.5%) had urban residents’ medical insurance or New Farmers’ Cooperative Medical Insurance. The majority of the participants (n = 262, 86.2%) did not have family members working in the medical field. A total of 85 (28.0%) participants had a history of gastroscopy, 186 (61.2%) participants considered their diet as healthy and normal, and 194 (63.8%) engaged in physical activity at least once a week (see Table 1).
Table 1 also shows the differences in UGI screening awareness scores among participants with different socio-demographic characteristics. Participants who were aged 50–59 years, lived with their children, had a bachelor's degree or higher education level, had a per capita household income of over RMB 6,000 per month, were unemployed, and had urban health insurance exhibited the highest level of UGI screening awareness compared with those with the same socio-demographic characteristics (all p < 0.05). The level of UGI screening awareness was higher among married individuals compared with unmarried individuals, and higher among participants living in urban areas compared with those in rural areas (all p < 0.05). Those with a history of gastroscopy, family history of tumors, and a balanced diet had a higher level of UGI screening awareness compared with those without such a history or a balanced diet (all p < 0.05). Differences in the other socio-demographic characteristics were not significant (all p > 0.05).
UGI screening awareness levelTable 2 presents the respondents’ answers to the UGI cancer screening knowledge survey. The top 3 risk factors for UGI cancer in terms of awareness were “Regular consumption of pickled, smoked, hot, fried, spicy, high-salt, or moldy foods increases the risk of upper gastrointestinal cancer”(n = 221, 72.70%), “Regular smoking and drinking increases the risk of upper gastrointestinal cancer” (n = 178, 58.55%), and “First-degree relatives (parents, siblings, children) with a history of esophageal or stomach cancer are at greater risk of developing upper gastrointestinal cancer” (n = 162. 53.29%). Regarding the recognition of UGI cancer warning symptoms, 192 (63.16%) participants agreed with the statement, “Chronic acid reflux, difficulty swallowing, nausea and vomiting, bloating and abdominal pain, loss of appetite, weight loss, and black stools are warning signs of upper gastrointestinal cancer.”
Table 2 - Screening awareness questionnaire Question number Question Correct n (%) Don’t know n (%) Incorrect n (%) 1 Cancer can be prevented. 221 (72.70) 45 (14.80) 38 (12.50) 8 Regular consumption of pickled, smoked, hot, fried, spicy, high-salt, or moldy foods increases the risk of UGI cancer. 221 (72.70) 41 (13.49) 42 (13.82) 3 Early detection, early diagnosis, and early treatment can eradicate approximately one-third of cancers. 211 (69.41) 54 (17.76) 39 (12.83) 9 Chronic acid reflux, difficulty swallowing, nausea and vomiting, bloating and abdominal pain, loss of appetite, weight loss, and black stools are warning signs of UGI cancer. 192 (63.16) 73 (24.01) 39 (12.83) 10 The most effective method of early screening for UGI cancer is gastroscopy. 189 (62.17) 90 (29.61) 25 (8.22) 7 Regular smoking and drinking increases the risk of UGI cancer. 178 (58.55) 91 (29.93) 35 (11.51) 12 Compared with ordinary gastroscopy, painless gastroscopy is a similar procedure and although it is more expensive, it is comfortable and painless. 177 (58.22) 89 (29.28) 38 (12.50) 11 Physical examinations for UGI cancer should be regularly performed. 173 (56.91) 86 (28.29) 45 (14.80) 13 Gastroscopy requires an appointment. 166 (54.61) 96 (31.58) 42 (13.82) 4 First-degree relatives (parents, siblings, children) with a history of esophageal or stomach cancer are at greater risk of developing UGI cancer. 162 (53.29) 103 (33.88) 39 (12.83) 2 Cancer can have no symptoms in its early stages. 157 (51.64) 103 (33.88) 44 (14.47) 6 People over 40 years of age are more likely to develop UGI cancer. 155 (50.99) 106 (34.87) 43 (14.14) 5 People who are positive for H. pylori infection are at greater risk of developing UGI cancer. 142 (46.71) 112 (36.84) 50 (16.45)UGI, upper gastrointestinal.
Regarding perceptions of stomach cancer and screening, the top 3 ratings were “Cancer can be prevented” (n = 221, 72.7%), ”Early detection, early diagnosis, and early treatment can eradicate approximately one-third of cancers” (n = 211, 69.41%), and “The most effective method of early screening for upper gastrointestinal cancer is gastroscopy” (n = 189, 62.17%).
Analysis of factors influencing the level of awareness of UGI screeningLinear regression analysis revealed that age, place of residence, education, employment status, per capita monthly household income, history of gastroscopy, dietary habits, physical activity, and ease of access to information were significantly associated with the level of awareness of UGI screening (all p < 0.05). Those who lived in urban areas, were older, more educated, had higher per capita monthly household income, history of gastroscopy, healthy diet, and ease of access to information had better knowledge of UGI cancers. In addition, participants with a low frequency of weekly physical activity had a higher level of knowledge about UGI cancers (see Table 3).
Table 3 - Factors associated with UGI awareness and gastroscopy acceptance Linear regression analysis Two-category logistic regression analysis B β p B p Exp (B) Gender 0.653 0.056 0.265 0.151 0.585 1.163 Age (years) 0.729 0.132 0.025∗ 0.269 0.079 1.308 Marital status –1.089 –0.067 0.199 –0.263 0.503 0.769 Type of resident –2.386 –0.195 <0.001∗ –0.777 0.009∗ 0.460 Residence status 0.273 0.042 0.431 0.169 0.297 1.184 Education level 0.970 0.148 0.005∗ –0.082 0.610 0.921 Employment status –2.349 –0.135 0.008∗ –0.729 0.106 0.483 Monthly income 1.085 0.168 0.001∗ 0.496 0.002∗ 1.642 Medical insurance –0.506 –0.079 0.128 0.036 0.819 1.036 Gastroscopy history 2.057 0.159 0.003∗ 0.471 0.152 1.602 Family members working in the medical field –0.924 –0.057 0.232 –0.307 0.397 0.735 Family history of tumors 0.854 0.056 0.286 0.491 0.214 1.633 Family history of UGI –0.355 –0.022 0.653 0.274 0.474 1.315 History of UGI-related diseases –0.193 –0.013 0.788 0.139 0.689 1.149 Healthy eating habits 3.065 0.257 <0.001∗ 0.484 0.080 1.623 Physical exercise –0.903 –0.114 0.019∗ –0.011 0.949 0.989 Self-perceived health status 0.110 0.019 0.686 –0.330 0.011∗ 0.719 Easy access to information 1.319 0.233 <0.001∗ –0.045 0.905 0.956R2 = 0.415, D–W = 2.160, p = 0.294.
∗p < 0.05; UGI: upper gastrointestinal; B, non-standardized coefficient; β, standardization coefficient; exp (B), odds ratio; R2, coefficient of determination; D–W, Durbin–Watson; p, p-value
In this survey, 83.8% of participants were aware of the gastroscopy program, but only 56.2% stated that they would schedule a gastroscopy if they had symptoms. In total, 77.91% of participants who would not undergo a gastroscopy claimed that they would do so if recommended by an outpatient doctor. The top 3 concerns about gastroscopy among respondents were “Pain and other discomfort associated with gastroscopy” (n = 114, 37.5%), “Risk of anesthesia for painless gastroscopy” (n = 87, 28.62%), and “Painless gastroscopy is expensive” (n = 81, 26.64%).
Analysis of factors influencing attitudes toward gastroscopySpearman's correlation analysis of UGI screening cognition level and gastroscopy acceptance showed a correlation coefficient of r = 0.243, p < 0.001, indicating that there was a correlation between the acceptance of gastroscopy and UGI screening cognition level.
The binary logistic regression model developed was tested for goodness of fit using the Hosmer–Lemeshow goodness-of-fit test, with a p-value of 0.294, indicating a good model fit. Binary logistic regression analysis revealed that the factors significantly associated with gastric cancer screening behavior were place of residence, per capita monthly household income, and self-perceived health status (all p < 0.05). Participants living in towns, with a high per capita monthly income, and with good self-perceived health status were more likely to undergo gastroscopy. (See Table 3).
DISCUSSIONThe results of the study showed that the majority of participants agreed with the statements ”Cancer is preventable“ (72.7%) and ”Early detection, diagnosis, and treatment can cure about one-third of cancers“ (69.41%), indicating some knowledge about early cancer diagnosis and treatment. However, there was variation in knowledge regarding UGI cancer risk factors. For example, 72.7% of participants recognized unhealthy dietary habits as a risk factor, but only 46.71% believed that H. pylori infection increased the risk. A Chinese case-cohort study clearly showed that more than 60% of gastric cancers are caused by H. pylori infection, and the H. pylori positivity rate was 44.2% in mainland China.23 This rate is lower compared with a study in Korea where 58.3% of the general population recognized the association. The authors suggested that this difference may be attributed to better educational interventions by health care professionals in Korea.24
This study analyzed factors influencing the awareness of UGI screening and found that participants who were 40 years old, actively employed, rural residents, and had a monthly income of RMB 4,000 had lower levels of awareness. Factors influencing attitudes toward gastroscopy included living in towns or cities, high household income, and good self-perceived health. There was a correlation between the acceptance of gastroscopy and UGI screening cognition. The partial overlap observed between factors influencing the level of awareness of UGI screening and those influencing attitudes toward gastroscopy was consistent with the study of He et al.25
Acceptance and understanding of information related to cancer prevention and gastroscopy screening varies depending on literacy level. Thus, more literate populations were more aware of the benefits of early cancer screening and looked for more ways to gain information about UGC screening,26 thereby directly influencing screening behavioral outcomes. Sanguinetti et al.27 also concluded that low educational level is closely related to poor knowledge about cancer prevention. Moreover, literacy levels were responsible for the lower level of knowledge about UGI screening among rural residents than urban residents, and participants from rural populations were generally less educated. More educated people were likely to have higher per capita monthly household income; therefore, those with higher per capita monthly household income had higher levels of awareness of UGI screening and were also more likely to undergo gastroscopy.
Awareness of UGI screening was higher among participants who engaged in physical activity at least once a week, which may be explained by the fact that people who are physically active on a regular basis have higher health literacy and are more aware of their own health status. Moreover, engaging in regular exer
留言 (0)