
記住我


CBCT images use a grayscale density value scale, which is similar to the HU value of ordinary CT. However, the difference is that the HU value is fixed, usually set to 0,45 and the range of grayscale values and contrast of CBCT images can vary depending on the interpolation method chosen by the equipment manufacturer, the imaging equipment, the parameters chosen during scanning and the field of view, etc. Moreover, the voxels containing teeth in CBCT images only account for about 1%–3% of the whole image, which causes unbalanced distribution of categories and slows down the training speed and accuracy of the network. The existing methods do not provide targeted processing for the above characteristics of CBCT images, only using general image preprocessing methods, which delete the first 0.5% and last 99.5% data of the image, and then perform regularization.
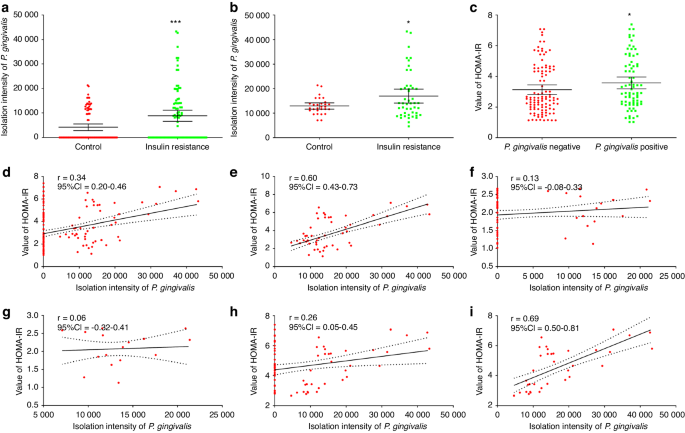
After performing CT value distribution statistics on the existing dataset, we plotted the histogram of grayscale value distribution for each data, and Fig. 6a–d shows several typical distributions of grayscale values of CBCT images in the dataset. It can be seen that each image usually contains one or two spikes and one peak. Based on the original image, it can be seen that the spikes represent the air in the image, while the peak represents the grayscale value of the soft tissue. The goal of image preprocessing is to delete data with a grayscale value smaller than the bone tissue and then perform normalizing processing.
Fig. 6
CBCT image slices with different field of view, gray value range and contrast ratio and corresponding gray histograms
Looking at the statistical histogram, it can be seen that the CBCT images vary in their grayscale range and that one or two spikes appear because the voxels appearing outside the field of view and the voxels representing air have the same grayscale value, respectively; on the other hand, since most of the images are of soft tissues, a peak appears, whereas there is no significant undulation of bones, teeth, and artificial restoration. Therefore, the average grayscale value xs for soft tissue can be obtained by calculating the midpoint of the soft tissue peak in the histogram, while the truncated gray value for bone is:
where d is the difference between the soft tissue grayscale value and the bone grayscale value.
To obtain the values of xs and d, we consider the histogram of the grayscale distribution as a digital signal and introduce frequency domain processing methods for signal processing, and finally obtain the requested values. The detailed method is as follows.
First, we consider the calculated histogram of the gray distribution as a signal curve representing the frequency of captured gray values for further analysis. To improve the curve quality, a median filter is applied to remove spikes or noise artifacts.
Next, the midpoint of the soft tissue peak on the filtered signal curve is determined, and this point is the xs to be calculated. To eliminate the impact of curve fluctuations on peak calculation, it is necessary to set a minimum threshold for the width and height of the target peak. In this experiment, the width was set to 5, and the height was set to 0.1% of the total number of pixels in the image through statistical analysis of the dataset used.
Subsequently, define the ROI around the peak by selecting a width of 200 units on both sides of the midpoint of the peak. We assume that the peak in this area obeys the Gaussian distribution, and select the Gaussian distribution density function to model the ROI. The functional equation is:
$$f\left(x\right)=\frac\sigma }^^}^}}$$
(2)
where μ is the midpoint of the wave, σ is the standard deviation, and k is the amplitude.
Finally, based on the fitted Gaussian distribution function, the relationship between the soft tissue and bone gray value disparity d and σ to be calculated is obtained experimentally.
Figure 7 illustrates the above processing flow, where the blue curve is the original histogram, the red curve is the curve after median filtering, the green curve is the fitted Gaussian distribution probability density function, and the black line segment is the wave peak midpoint.
Fig. 7
Histogram of grayscale distribution of CBCT images with preprocessing results
Figure 8 shows the CBCT image slices after the application of the above preprocessing method, in relation to the selected d and σ.
Fig. 8
Images when different preprocessing parameters are selected separately
Network structureFor the two stages of skeletal segmentation and neural tube segmentation, we selected the 3D-UNet network39,46 as the network backbone. The Swin-UNETR network was selected for the tooth instance segmentation stage to achieve this task. Due to the limitations of the size of the convolutional kernel and the number of filter channels in CNNs, the receptive field is limited, making it difficult to capture and store long-range dependency information.25 In order to capture long-range dependencies, it is usually only possible to increase the size of the convolutional kernel or the number of channels, which can lead to gradient vanishing or dimensional disasters. In terms of the problem to be solved in this paper, the above problems will make it difficult to obtain the relationship between two teeth that are far away when performing tooth instance segmentation, which leads to low segmentation accuracy. The existing CNN-based tooth instance segmentation methods require other feature information as input, such as pre-obtained tooth centroids, tooth positions obtained using oral scan models, etc.
The transformer structure in the NLP domain is inherently capable of capturing long-range dependency information, thus achieving significant success in the field of computer vision in recent years.8,17,22,47,48,49 In the field of tooth instance segmentation, the localization of teeth according to the FDI Two-Digit Notation and the identification of missing teeth depend mainly on their adjacent teeth and the overall dentition information, which makes it necessary that the applied deep learning network also has the ability to model between pixels at long distances and requires the network to be able to learn local features of the image at the same time due to the close grayscale values and blurred boundaries of the teeth and jaws in the root portion of the tooth. Therefore, we chose the Swin-UNETR25 network, which has demonstrated excellent performance in semantic segmentation of brain tumors, as the segmentation network. This method can simultaneously model the relationships between long-distance pixels and extract local information, which is crucial for predicting tooth position.
The Swin-UNETR model consists of the following components:
Swin-Transformer: as a feature extractor, used to extract meaningful feature representations from the input image. It is based on the Swin-Transformer architecture50 and uses non-overlapping sliding windows at multiple levels for feature extraction through a self-attentive mechanism and a fully connected network. This feature extraction method takes full account of the global contextual information and local detail information of the image, which helps to improve the semantic segmentation performance.
Encoder part: it includes several UNetR base modules51 for gradually decreasing feature dimensionality. The encoder extracts a more abstract and semantically rich feature representation from the output features of the Swin-Transformer through multiple layers of convolution and normalization operations. Each encoder block contains convolution operations and residual concatenation, which help to preserve important feature information and mitigate the gradient disappearance problem.
Decoder part: includes multiple UNetR upsampling blocks for gradually restoring the feature dimension to its original size. The decoder recovers the lost detail information by fusing the encoder features with higher resolution features through upsampling operations and jump connections. This improves the accuracy and precision of the segmentation results.
Output layer: used to generate the final segmentation prediction results. The output layer maps the decoder features to the probability distribution of the target class through a series of convolution and normalization operations. The final output results can be used for semantic segmentation at the pixel level.
The network structure of the Swin-UNETR model takes full advantage of the Swin-Transformer to enable fine-grained segmentation tasks with the encoder–decoder design of the UNet structure while maintaining the global perception capability. In this task, the selected hyperparameters are shown in Table 7.
Table 7 Network hyperparameters selectionLoss functionWe weighted the results of the CE loss and Dice loss26 calculations together as the loss function at training.
where wCE and wDice are the weights of CE loss and Dice loss, respectively, which are both set to 1 in this experiment.
$$}_}=-\frac\mathop\limits_^\mathop\limits_^__\log \left(_\right)$$
(4)
$$}_}=1-\frac\mathop\limits_^\frac_^__}_^_^+_^_^}$$
(5)
where C is the number of categories; N is the total number of voxels; wj is the weight of category j; Pi,j is the probability that the i-th voxel belongs to category j as output from the model; Gi,j is the probability that the i-th voxel belongs to category j after encoding the ground truth with one-hot code.
DatasetIn this study, we collected a total of 451 CBCT data with entire dental arch from 10 different medical institutions and publicly available datasets, including 11 CBCT manufacturers and 13 imaging modalities, to evaluate the accuracy of the proposed method, excluding CBCT blurring caused by patient motion or insufficient imaging parameters during the imaging process. The detailed imaging protocols (i.e., image resolution, manufacturer, manufacturer’s model name, and radiation dose information for tube current and tube voltage) and patient age–sex distribution of the data are shown in Table 8. At the same time, we also collected a total of 55 CBCT data from the 10 medical institutions mentioned above, including 11 CBCT manufacturers, to verify the generalizability of the proposed method.
Table 8 Description and characteristics of the CBCT datasets from different medical institutions (only voxel size is available in the public dataset)CBCT images were labeled under the guidance of professional dentists to obtain the gold standard. The dataset was randomly divided into three categories: training set, validation set, and test set, while all personal information of patients is removed.
The physical resolution of the CBCT images we collected was distributed from 0.18 to 1.0 mm. Considering the clinical application and data processing efficiency, it was, therefore, necessary to first resample the data according to the physical resolution of 0.4 mm. The resampled CBCT data were first preprocessed by the preprocessing method proposed above, and the retained grayscale values ranged from the grayscale values of the bones obtained by preprocessing to 99.5% of the overall, and then normalized to obtain a standard image with a mean of 0 and a standard deviation of 1. During the training process, data of size 96 × 160 × 160 were randomly cropped from the 3D images as training data. In order to improve the generalizability of the model, we also apply random mirror flip and random add mask methods to enhance the data, where random mirror flip is performed along three axes and random add mask is a random crop operation on the training data, where the size of 12 × 12 × 12 data is cropped and replaced by 0. The number of crops is in the range of 0–16 and the location of the crops is random.
Evaluation metricsWe chose to use Dice similarity coefficient (DSC), mIoU, HD, and ASD to accurately evaluate the segmentation results.
DCS is used to measure the similarity between two sets, and the value range of DSC is between 0 and 1, where 1 indicates complete overlap between sets A and B, and 0 indicates no overlap. In image segmentation tasks, A and B typically represent predicted segmentation results and actual segmentation annotations, respectively.
IoU is the ratio of intersection divided by union, and mIoU is the average of all categories of IoU, which is used to measure the segmentation performance of the model on each category. The higher the value, the better the segmentation performance of the model on different categories.
HD is used to measure the maximum difference between two sets, that is, the maximum value of the shortest distance from a point in one set to another set, reflecting the worst situation between the two sets, that is, the maximum distance between the model segmentation result and the actual annotation. The smaller the value of HD, the closer the two are.
ASD is the average surface distance between two sets, which is the average of the shortest distance from each point in one set to another set. It is used to evaluate the average error of the segmentation boundary, which is the average distance between the model segmentation result and the actual annotation. A smaller ASD indicates a closer segmentation boundary between the two.
Implementation detailsWe chose the training framework PyTorch 2.0.0 with AdamW as the optimizer, a fixed learning rate of 5e-4 and a weight decay factor of 1e-5. The network was trained on two Nvidia GeForce RTX 3090Ti GPUs in a Linux environment with the batch size of 2 and 300 epochs.
留言 (0)